
Filtering is one of the most powerful tools in Geographic Information Systems (GIS), enabling you to sift through vast amounts of data to focus on what truly matters. Whether you're analyzing urban landscapes, managing natural resources, or optimizing transportation routes, filtering helps you extract meaningful insights by selecting data that meets specific criteria. In this guide, we’ll explore what GIS filtering is, why it’s essential, and how to use it effectively on platforms like GISCARTA.
What is GIS Filtering?
GIS filtering is the process of selecting data from a large dataset based on predefined criteria. It allows you to isolate objects or values that meet specific conditions, such as location, time, type, or other attributes. By applying filters, you can streamline your analysis, improve accuracy, and create clearer visualizations.
Why Use Filtering in GIS?
Simplify Analysis: When datasets are too large or complex, filtering helps you focus on the most relevant information for your task.
Increase Precision: Filters allow you to zero in on data that meets specific parameters, such as objects within a defined area or with certain characteristics.
Optimize Performance: Working with smaller, filtered datasets speeds up processing and improves efficiency.
Enhance Visualization: Filtering highlights key elements on your map, making them more visible and easier to interpret.
Types of GIS Filtering
Spatial Filtering
By Geometry: Select objects within a specific geographic area (e.g., inside a polygon or near a point).
By Distance: Choose objects within a defined radius from a point (e.g., finding nearby facilities).
By Intersection: Identify objects that intersect with others (e.g., land parcels crossing roads).
Attribute Filtering
By Attribute Values: Filter objects based on specific attributes (e.g., population density, land use type).
By Value Range: Select objects with attributes falling within a defined range.
Combined Filtering
Apply both spatial and attribute filters simultaneously to meet multiple conditions.
Temporal Filtering
Use time-based data to analyze changes over time, such as land use evolution or ecosystem shifts.
Where Can GIS Filtering Be Used?
Urban Planning: Identify suitable construction sites based on soil type or population density.
Natural Resource Management: Analyze land parcels by soil quality, pollution levels, or ecosystem health.
Engineering and Construction: Filter areas with optimal conditions for infrastructure projects like roads or buildings.
Environmental Studies: Highlight zones with high air or water pollution for targeted conservation efforts.
Transportation and Navigation: Optimize routes by filtering data on road networks, traffic congestion, or parking availability.
How to Use Filtering in GISCARTA
GISCARTA makes filtering intuitive and efficient. Here’s how to get started:
Step 1: Access Layer Settings
Open the layer properties you want to filter by clicking the three dots next to its name.
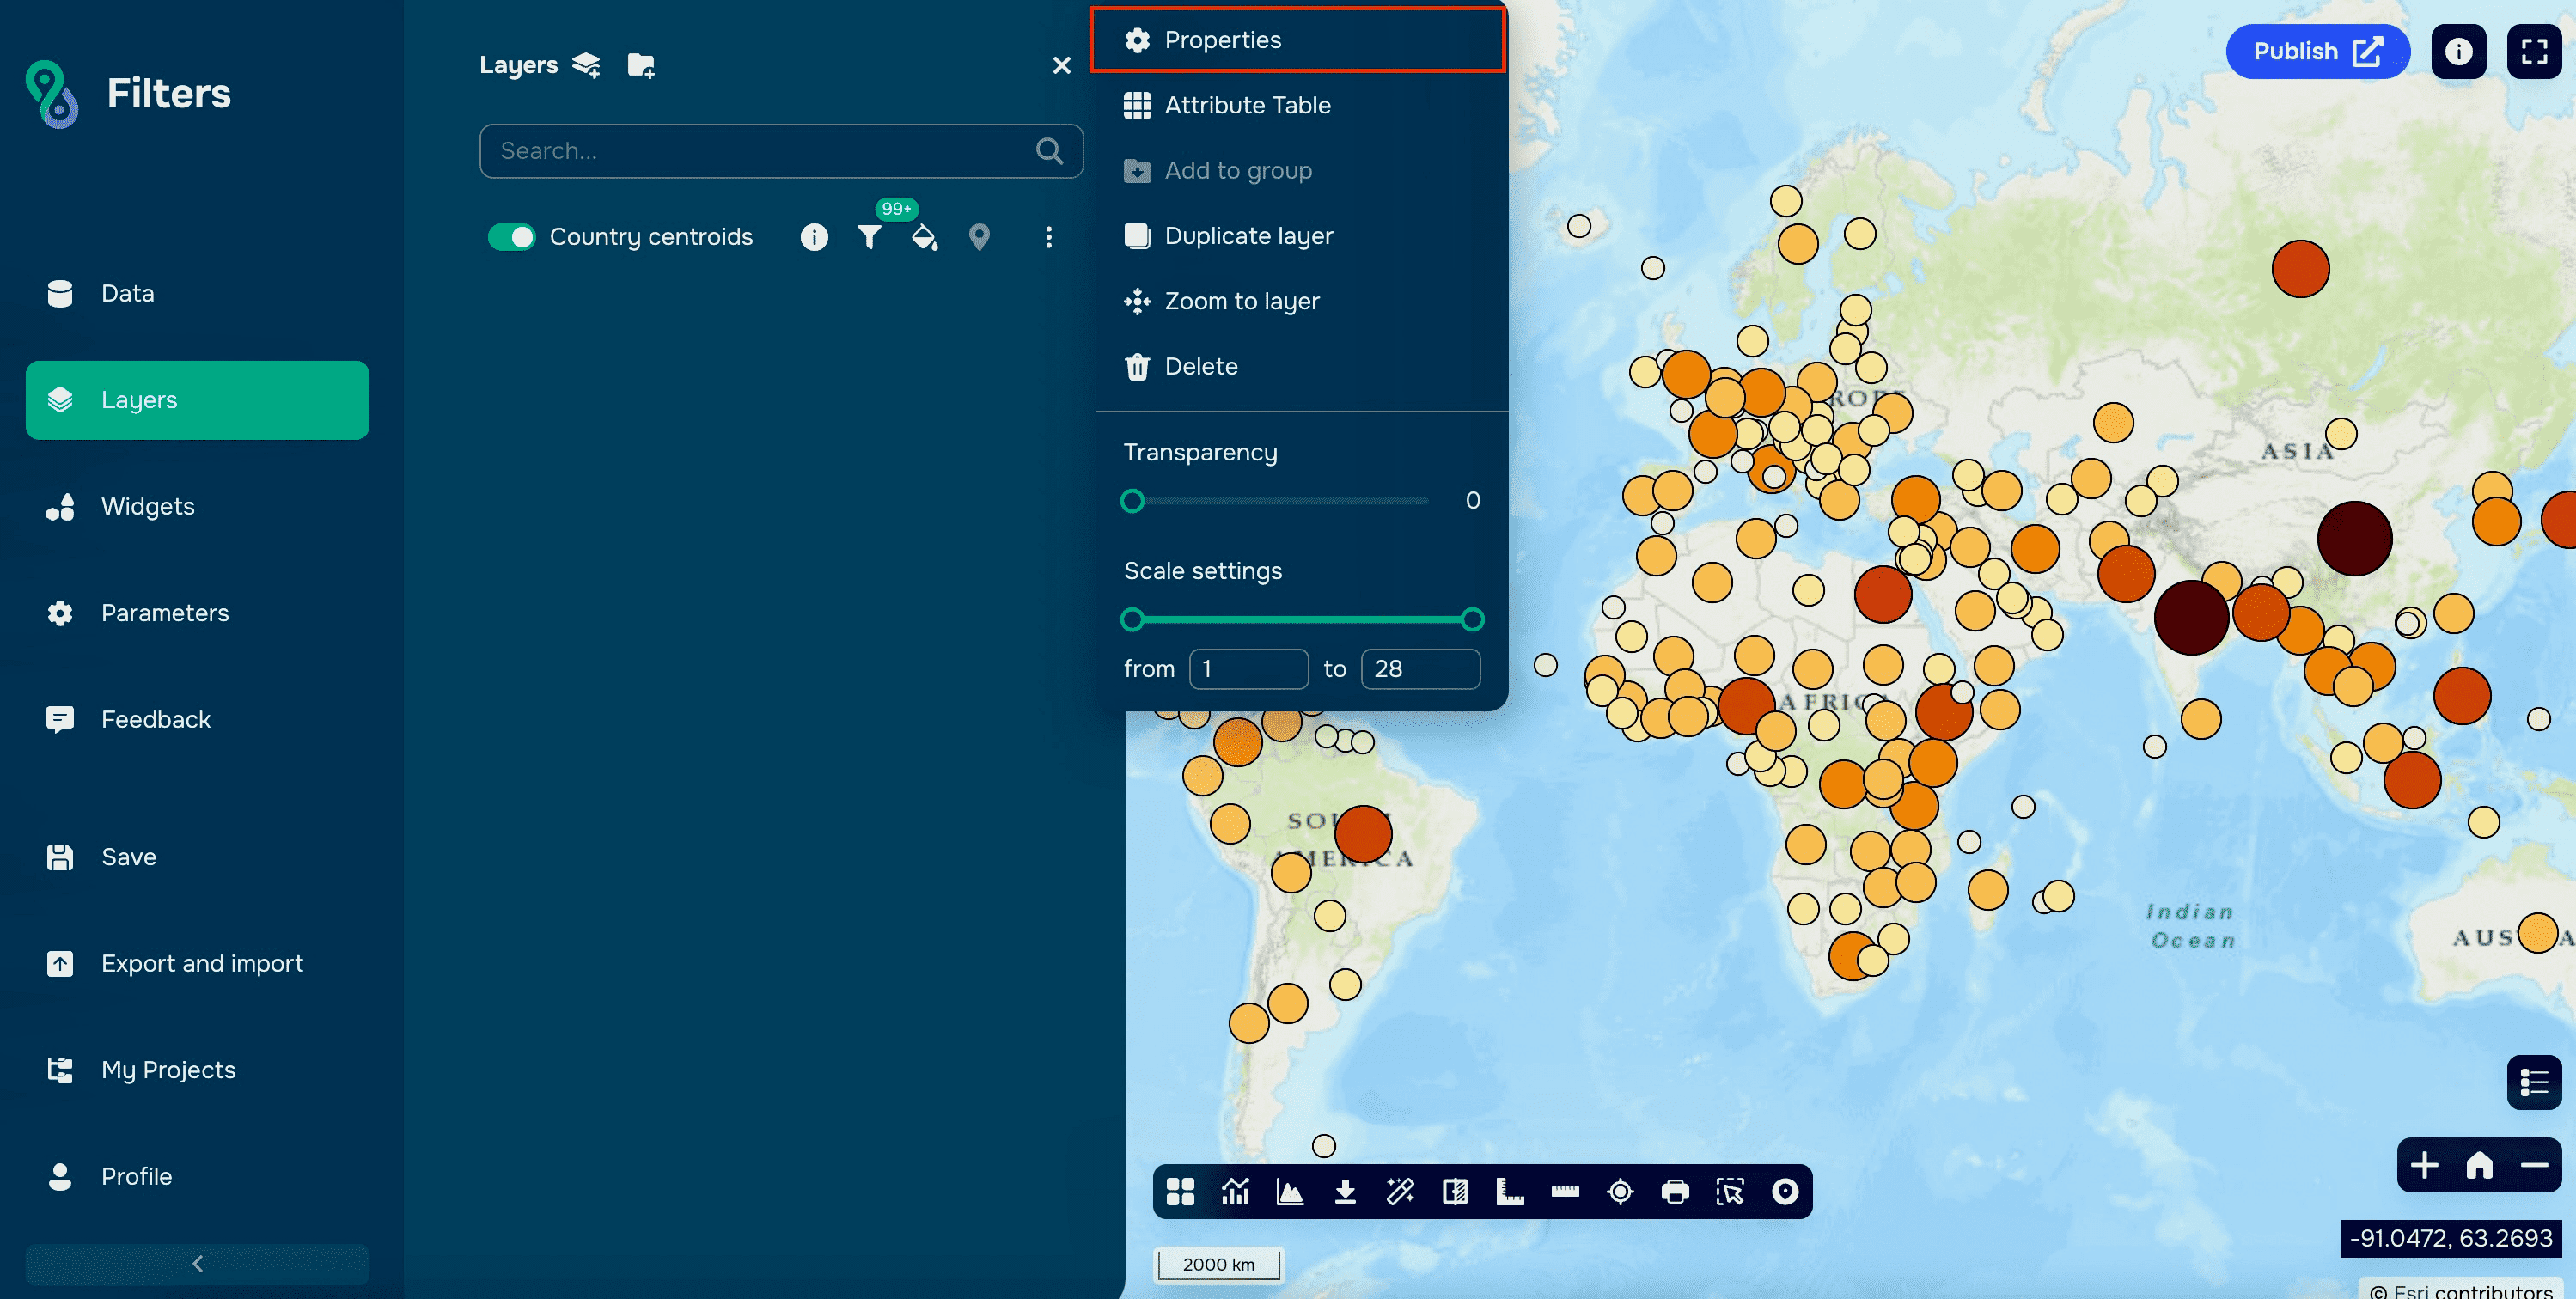
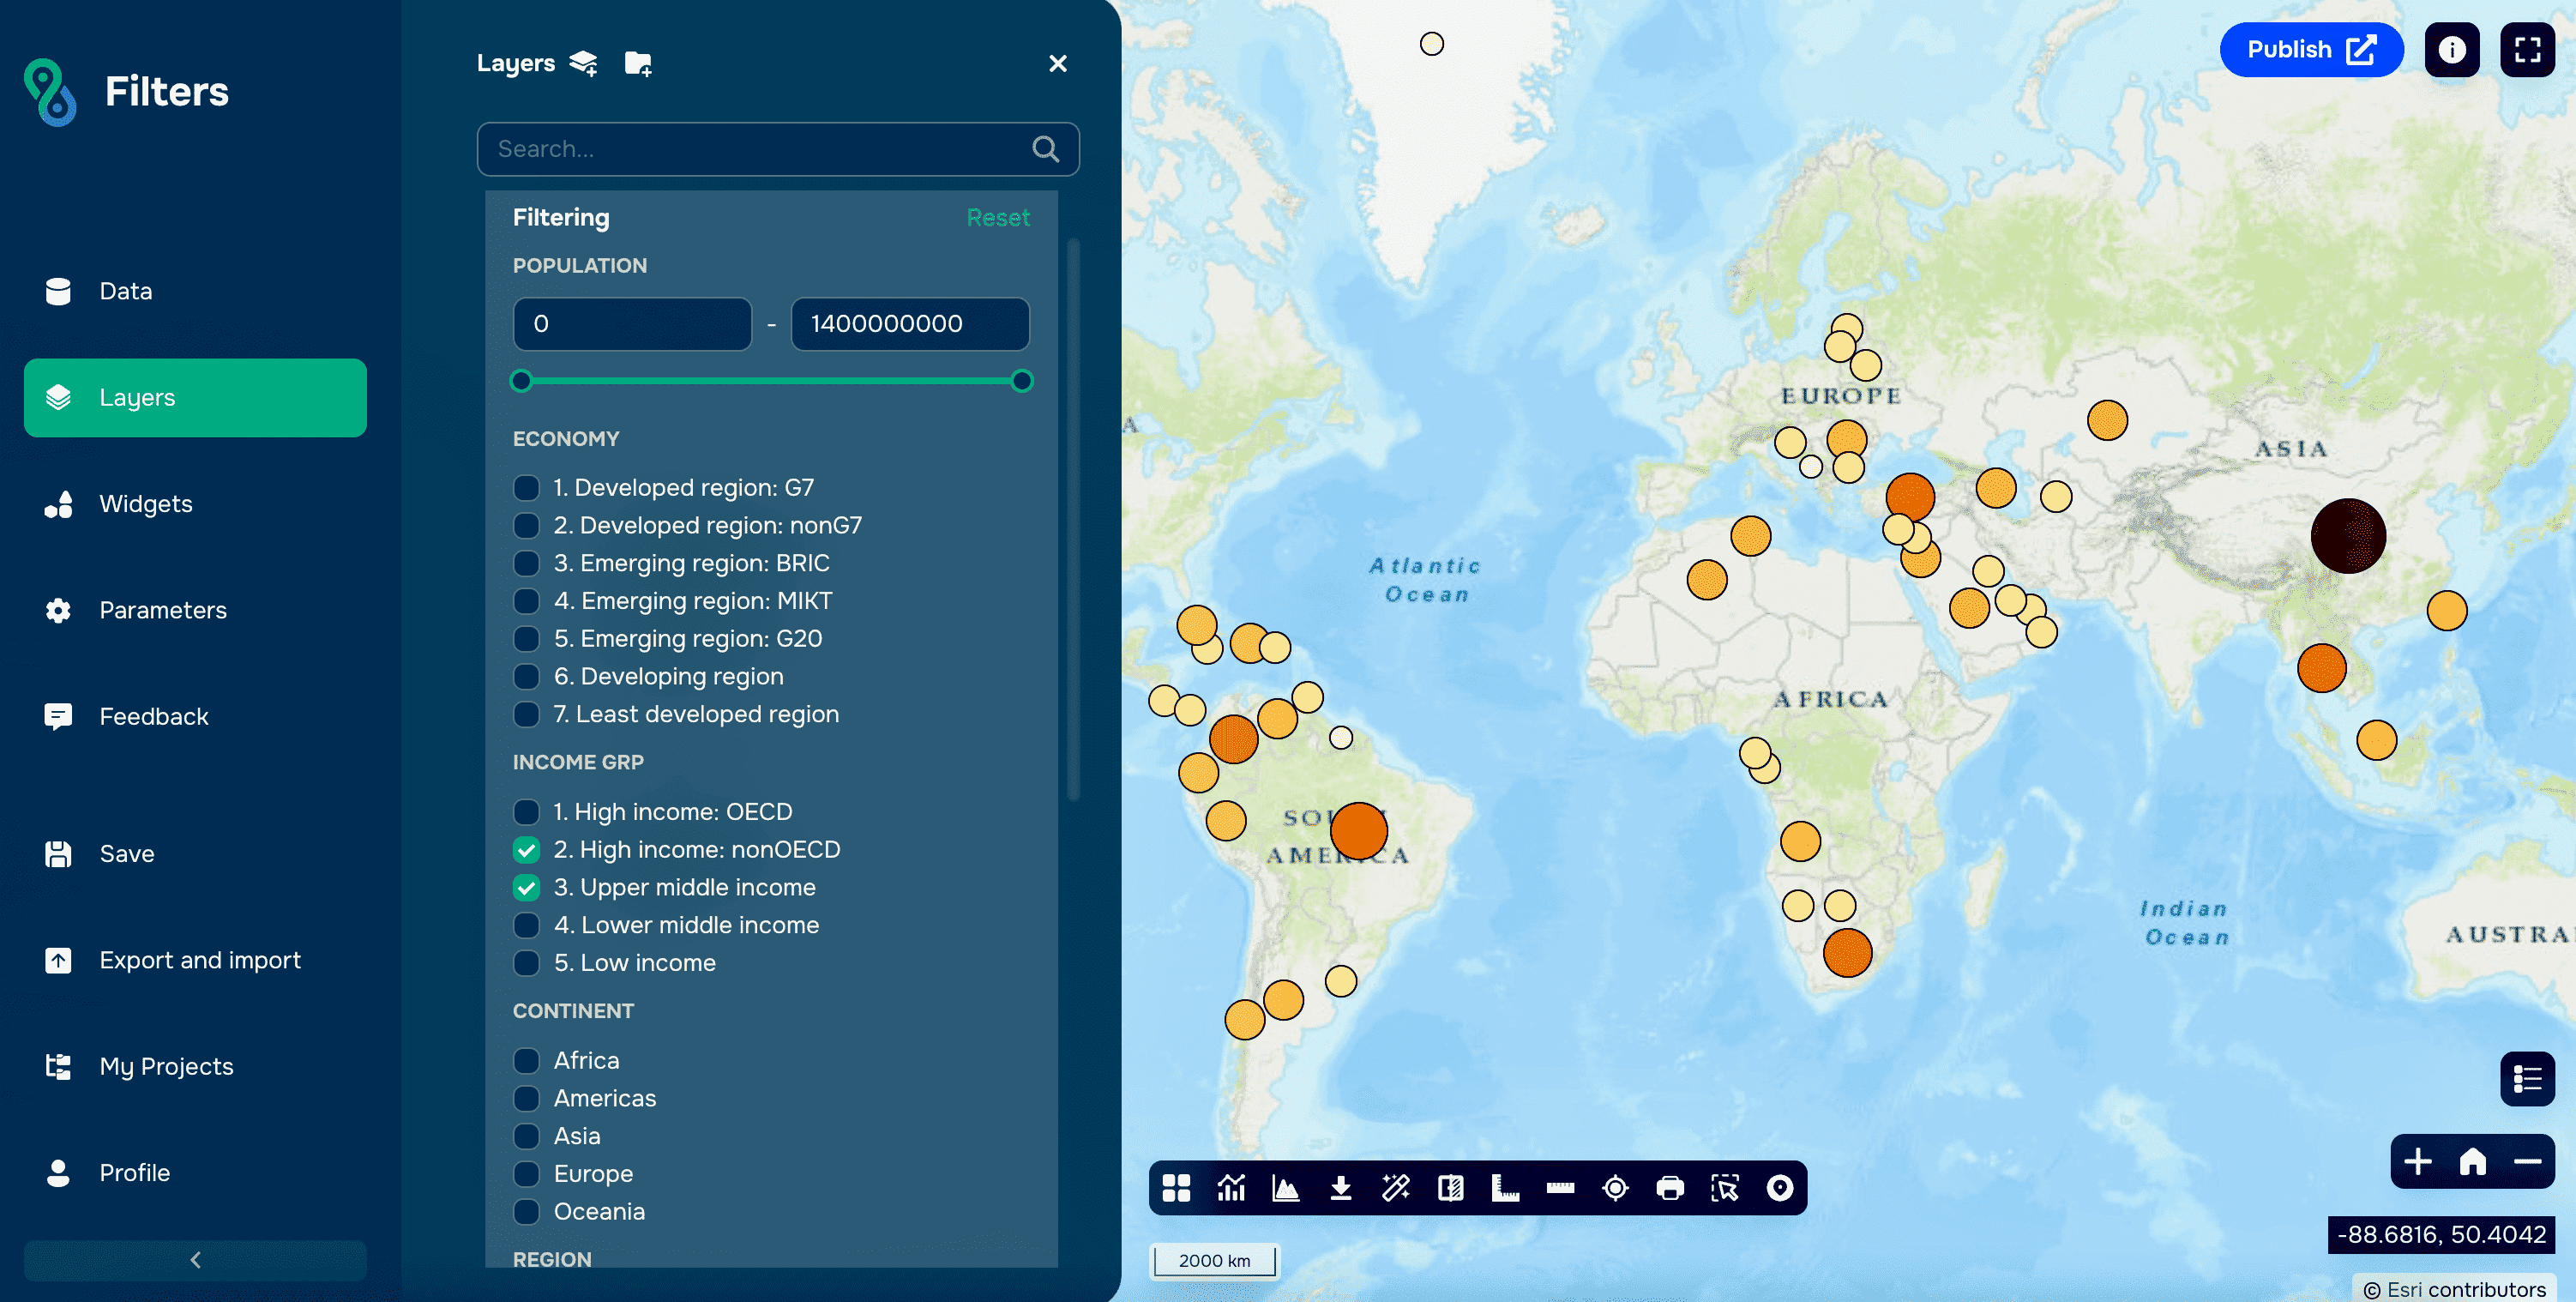
Navigate to the Filtering section in the layer settings.
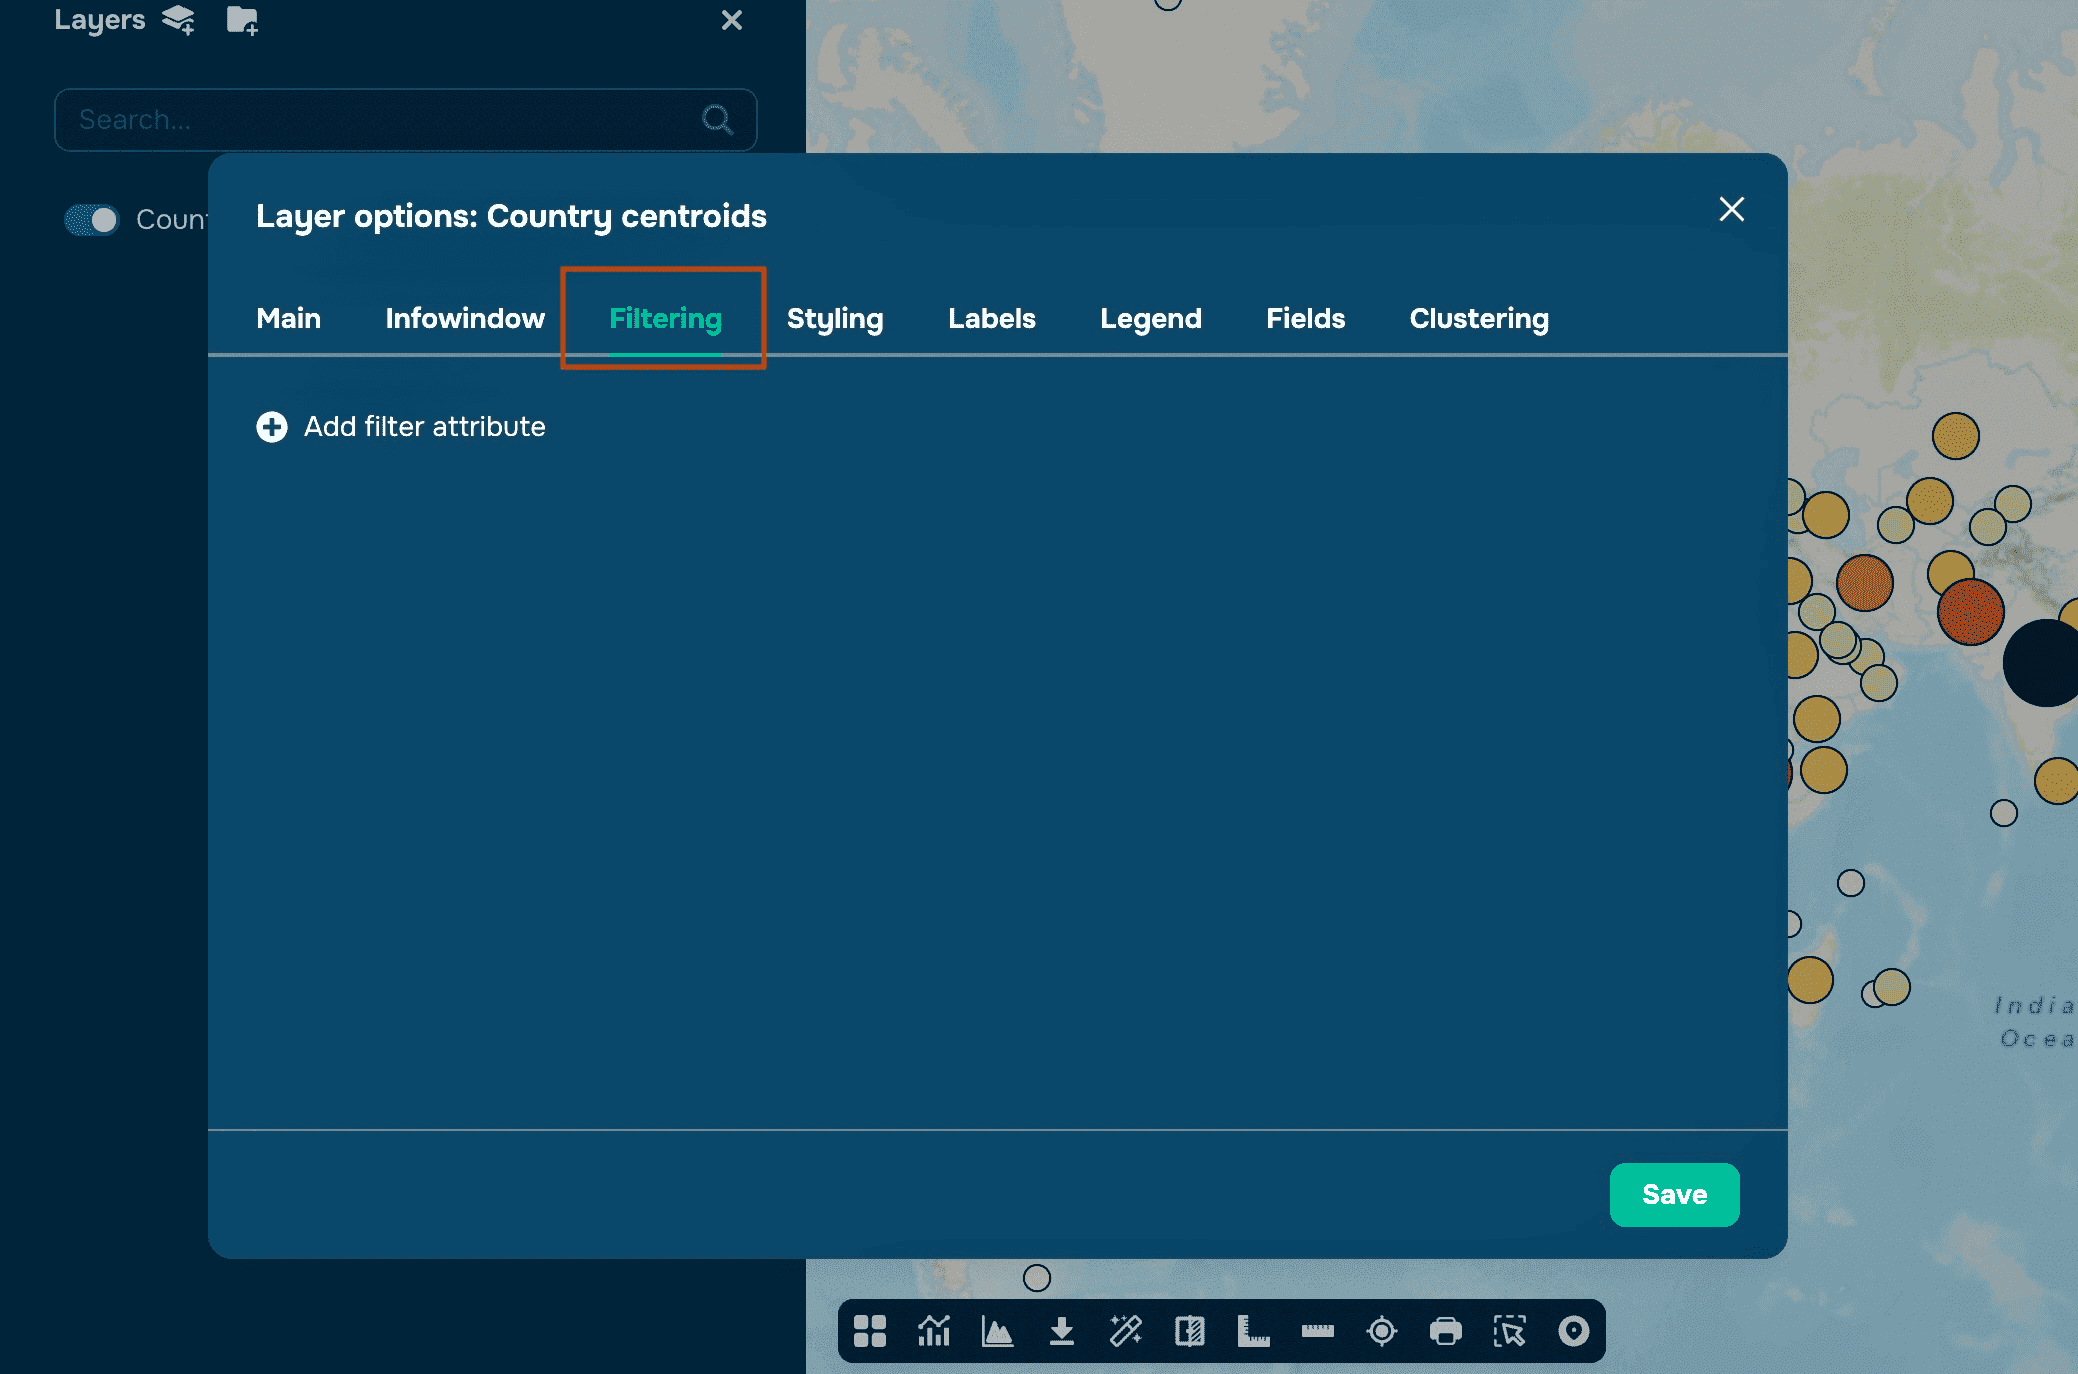
Step 2: Add a Filter
Click the + button to add a new filter.
Choose the attribute (or table field) you want to filter by.
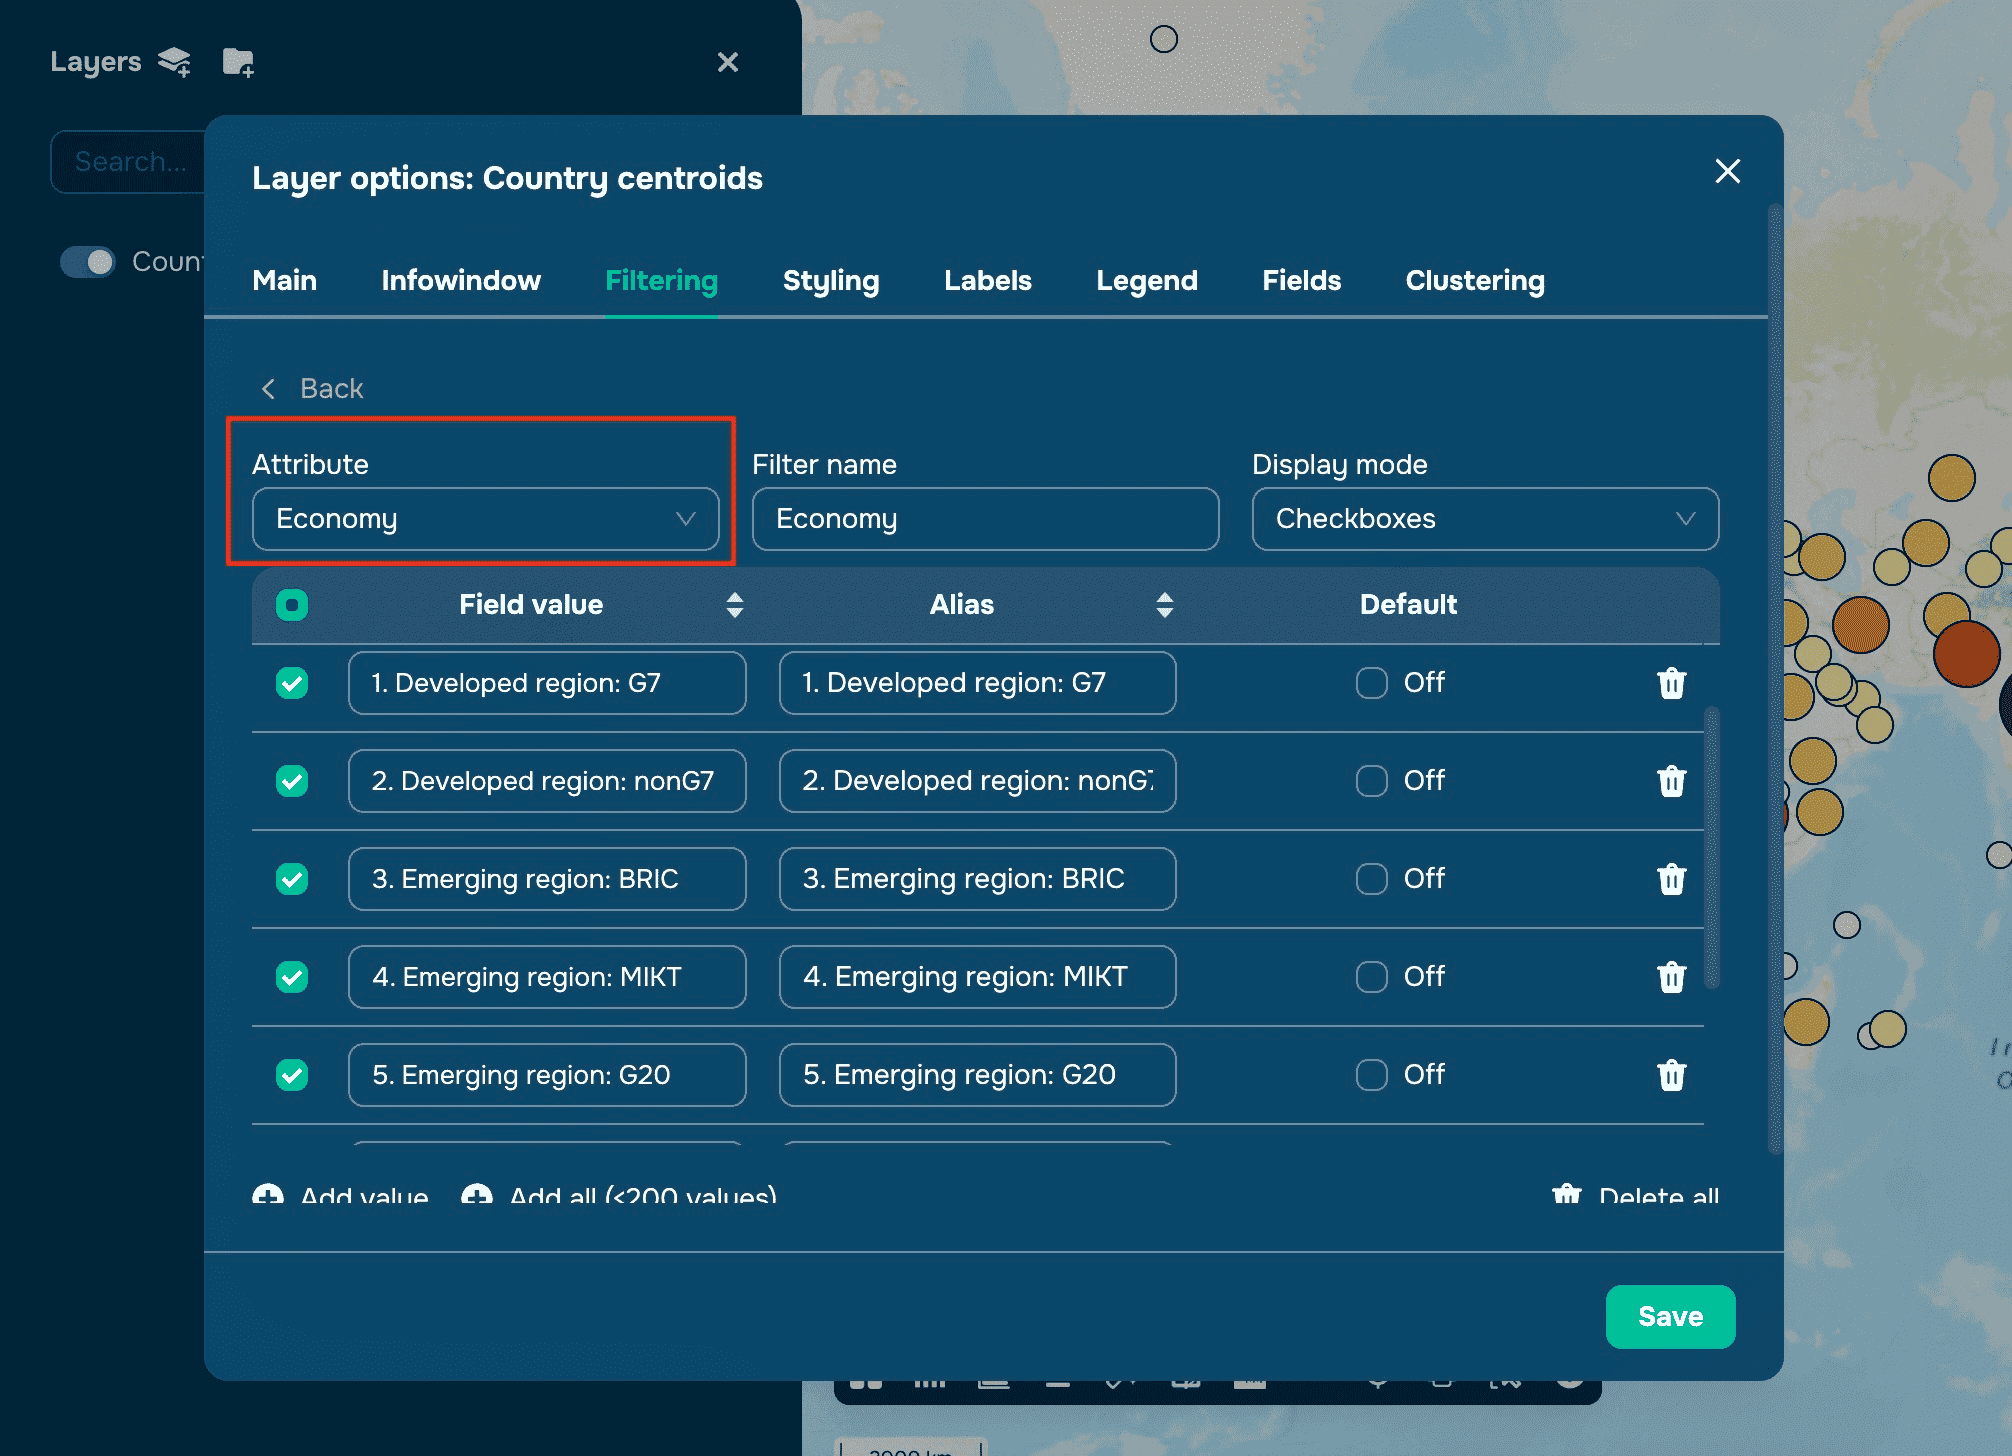
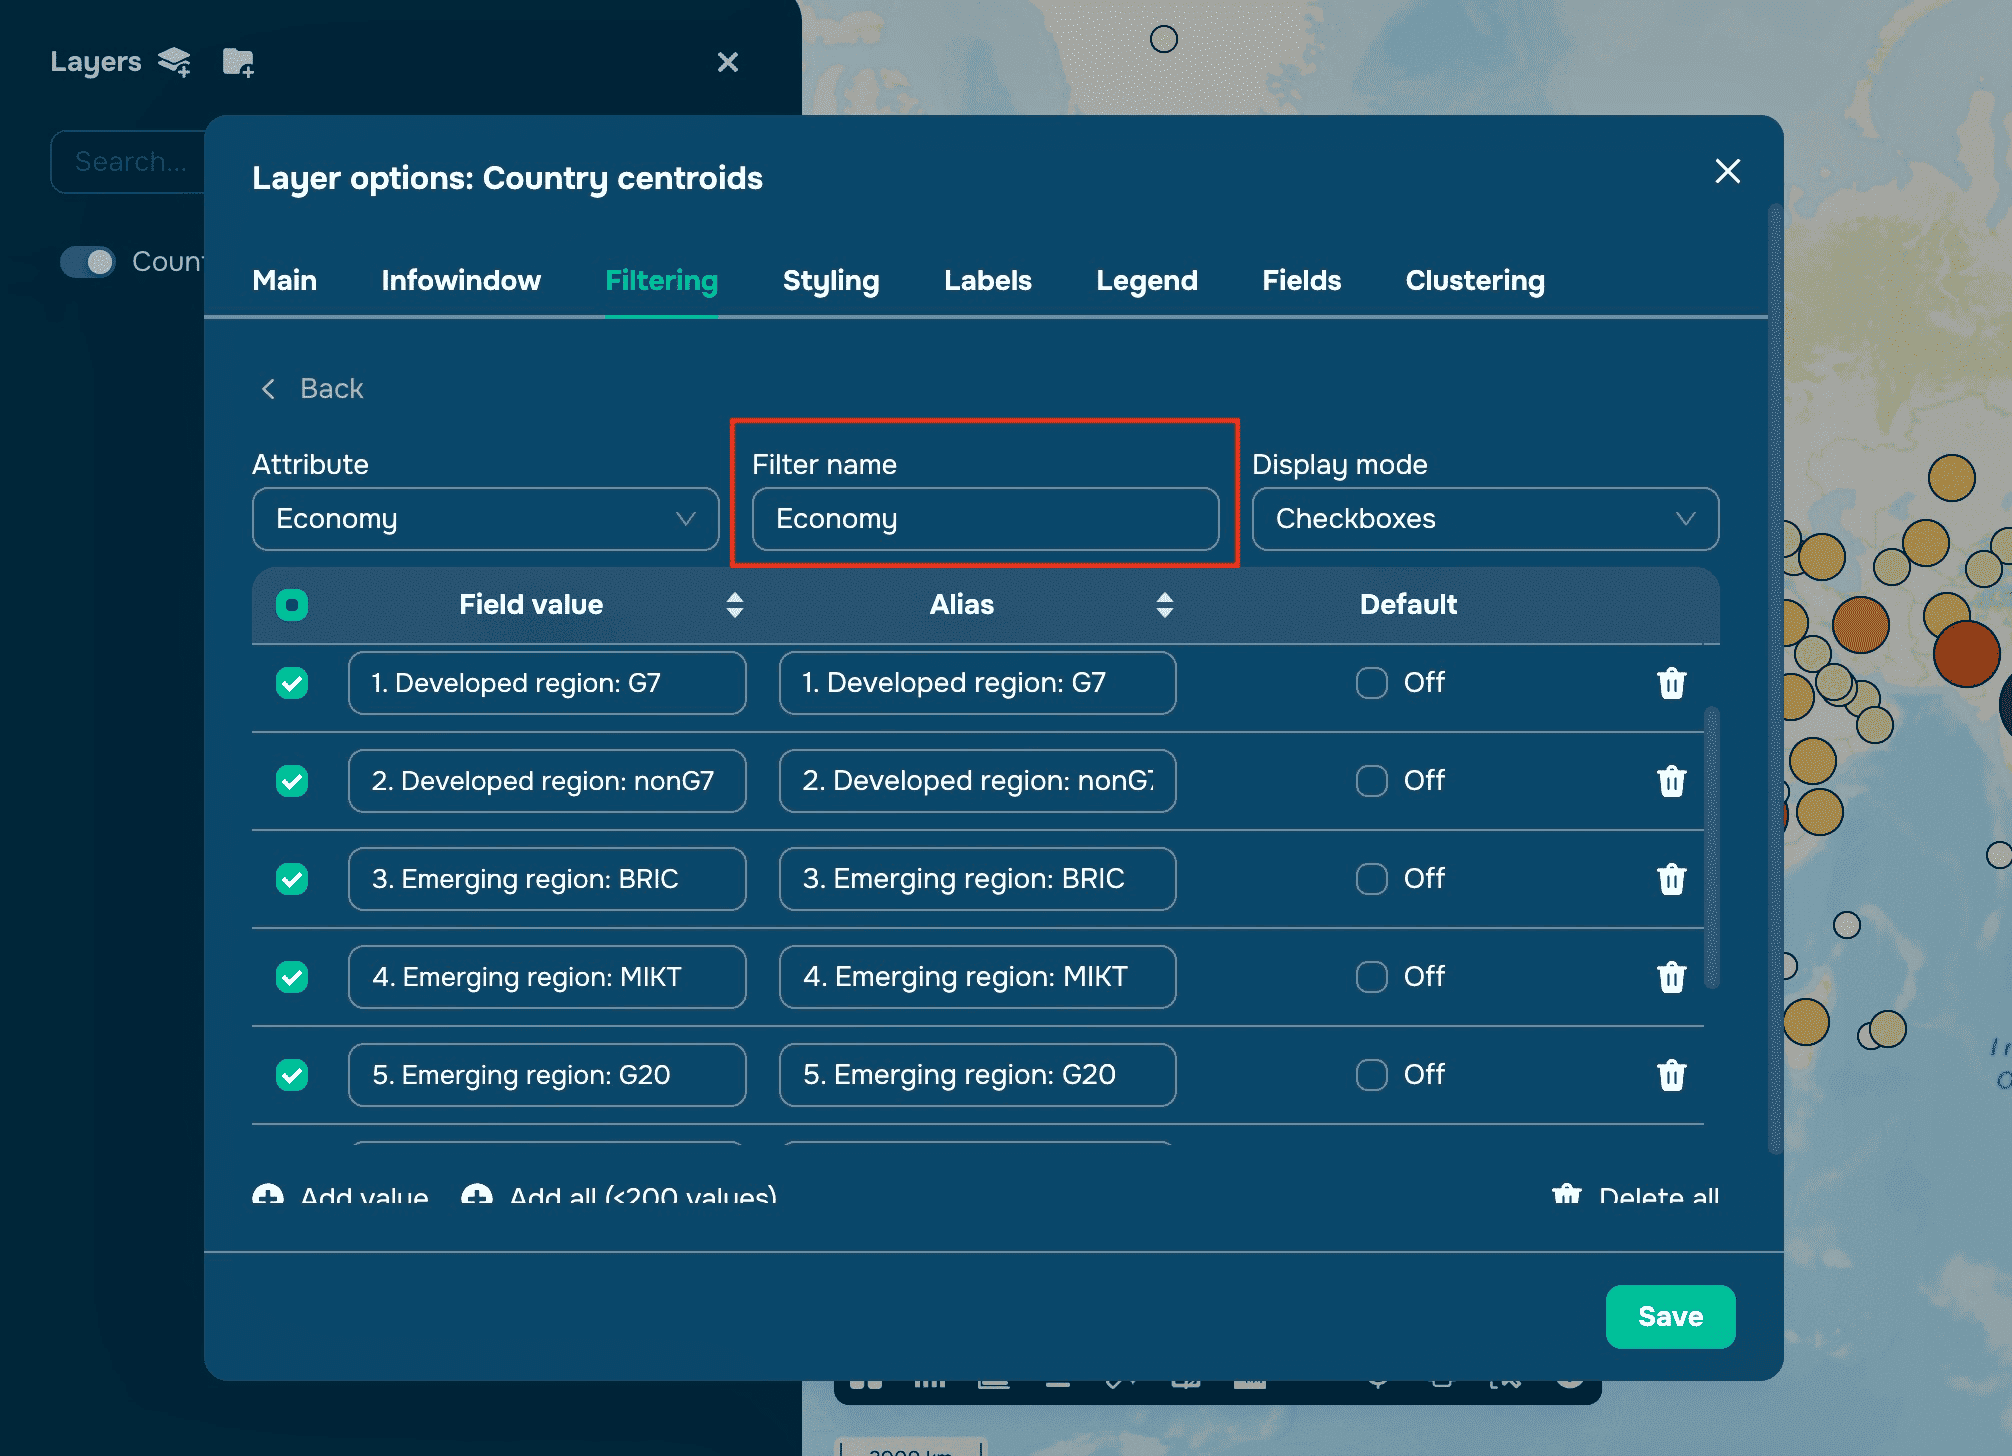
Customize the filter with a Name
Customize the filter with Display Type:
Checkboxes: Select one or multiple options from a list.
Radio Buttons: Choose a single option from multiple choices.
Range Slider: Select values within a numeric range (available for numeric attributes).
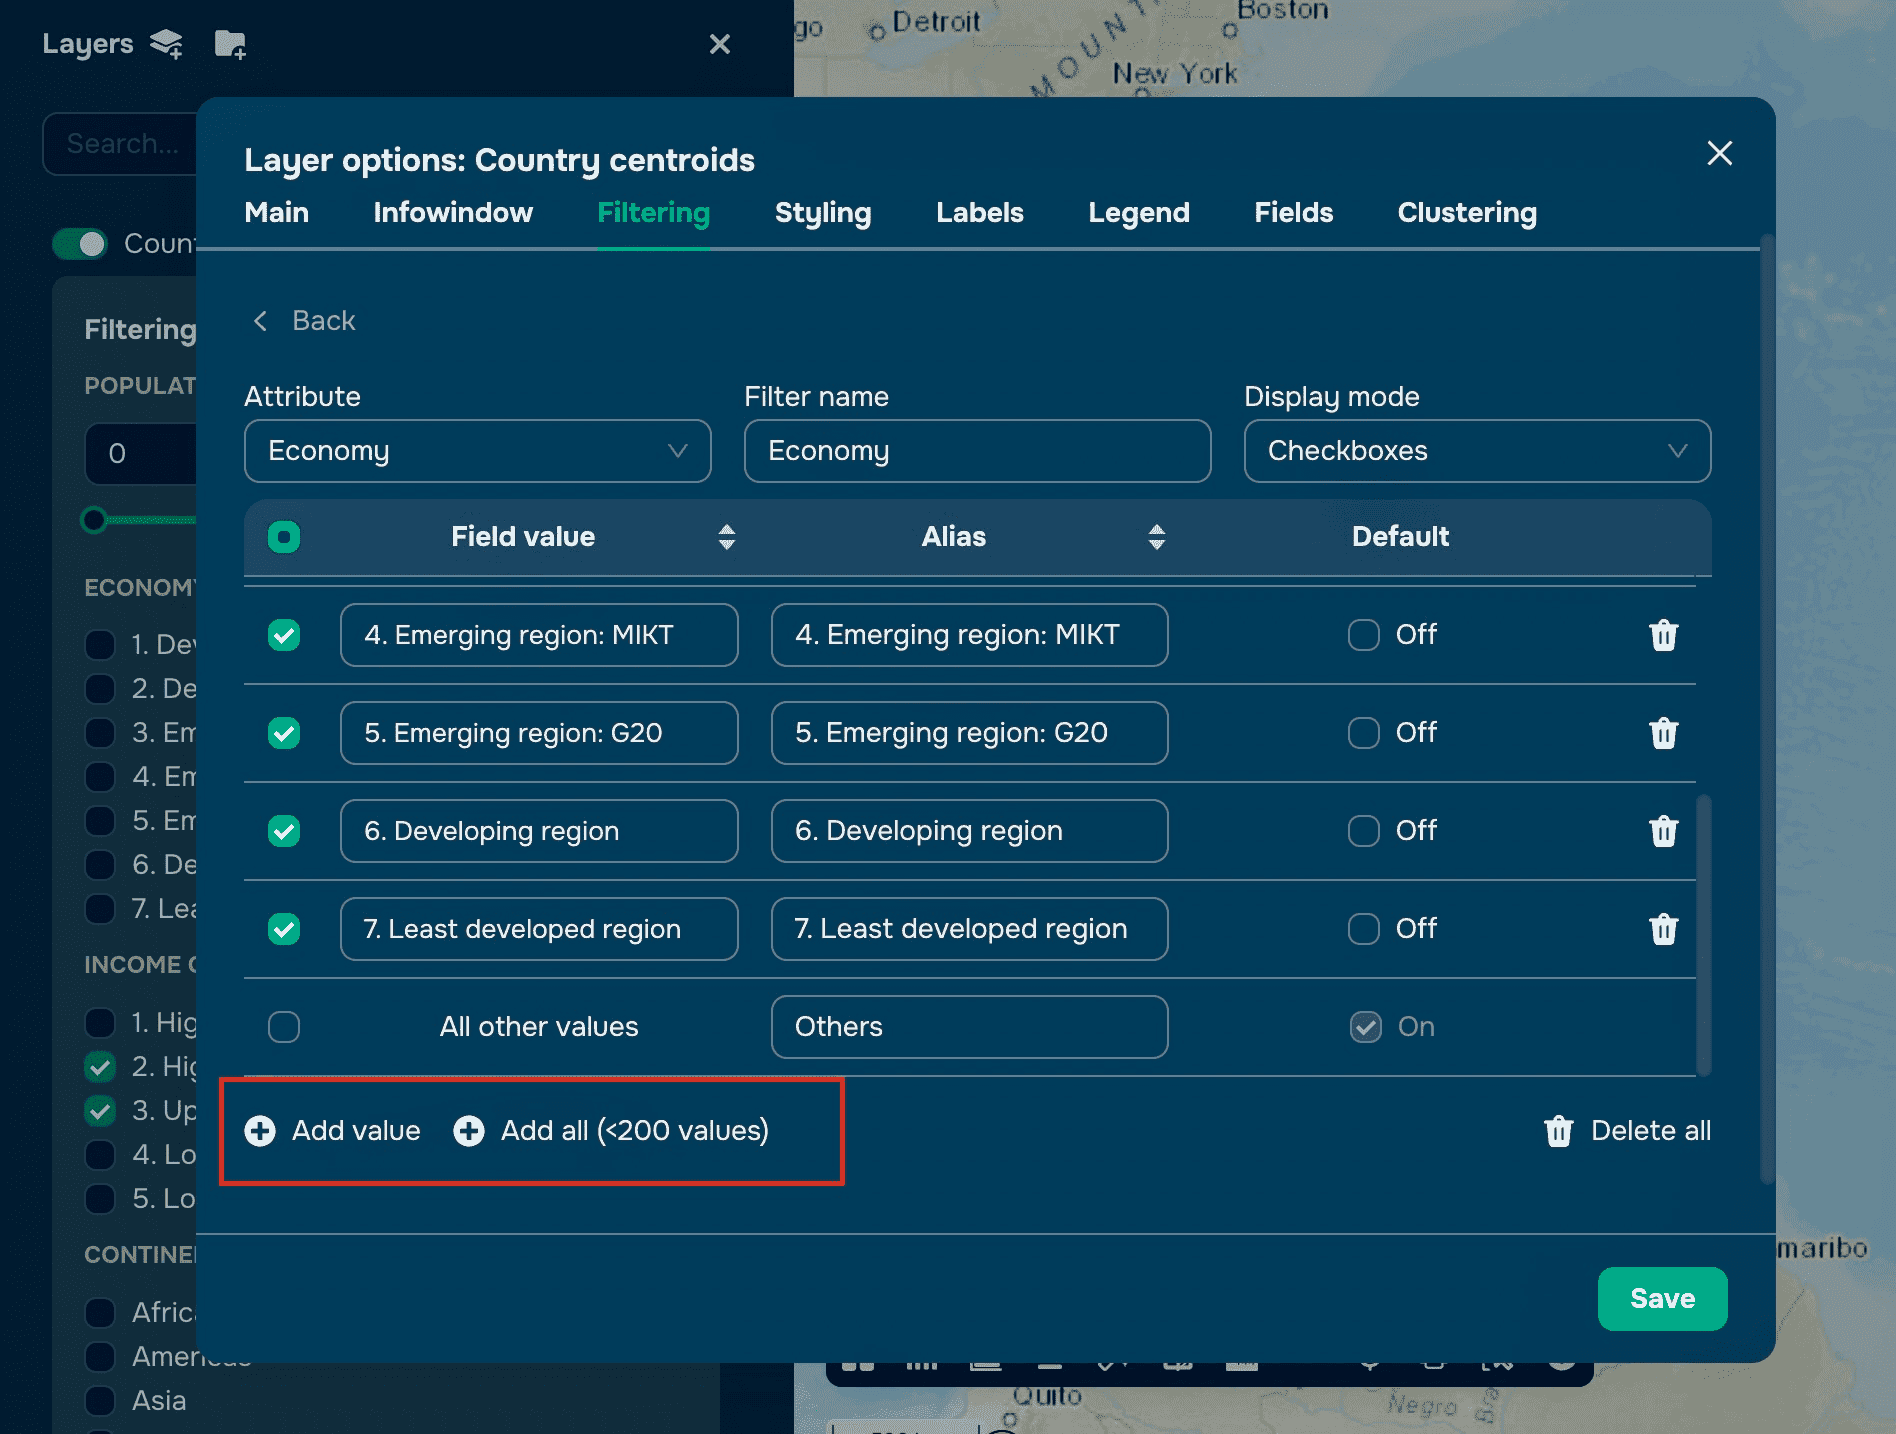
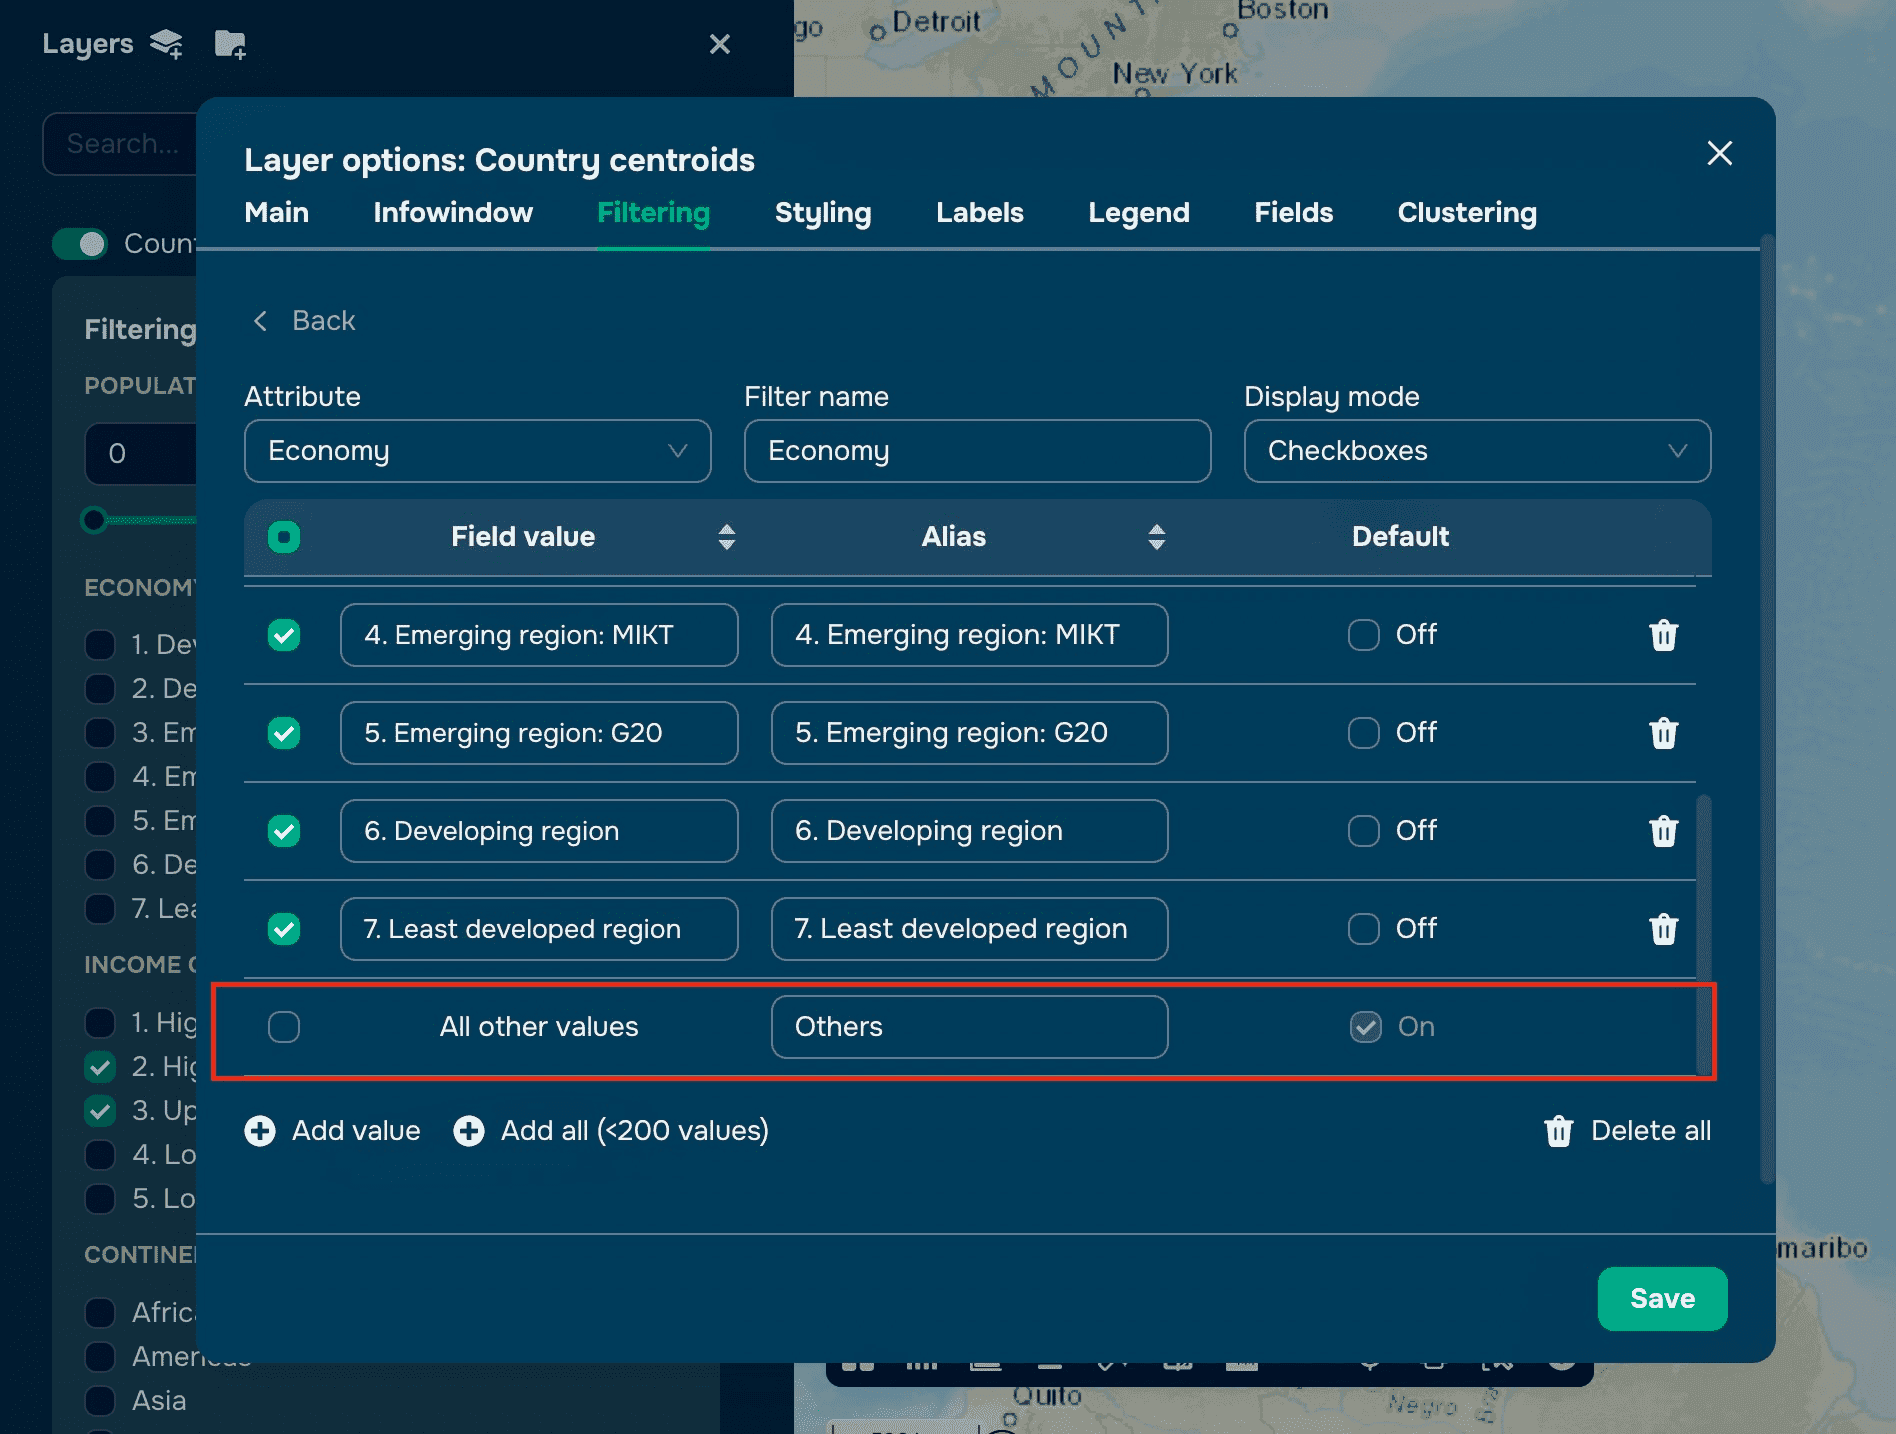
Add values manually or click Add All to include all available values (up to 200).
Optionally, disable the All Other Values row by unchecking the box.
Step 3: Save and Apply
Click Save to apply the filter.
A funnel icon will appear next to the layer name, indicating that filtering is active.
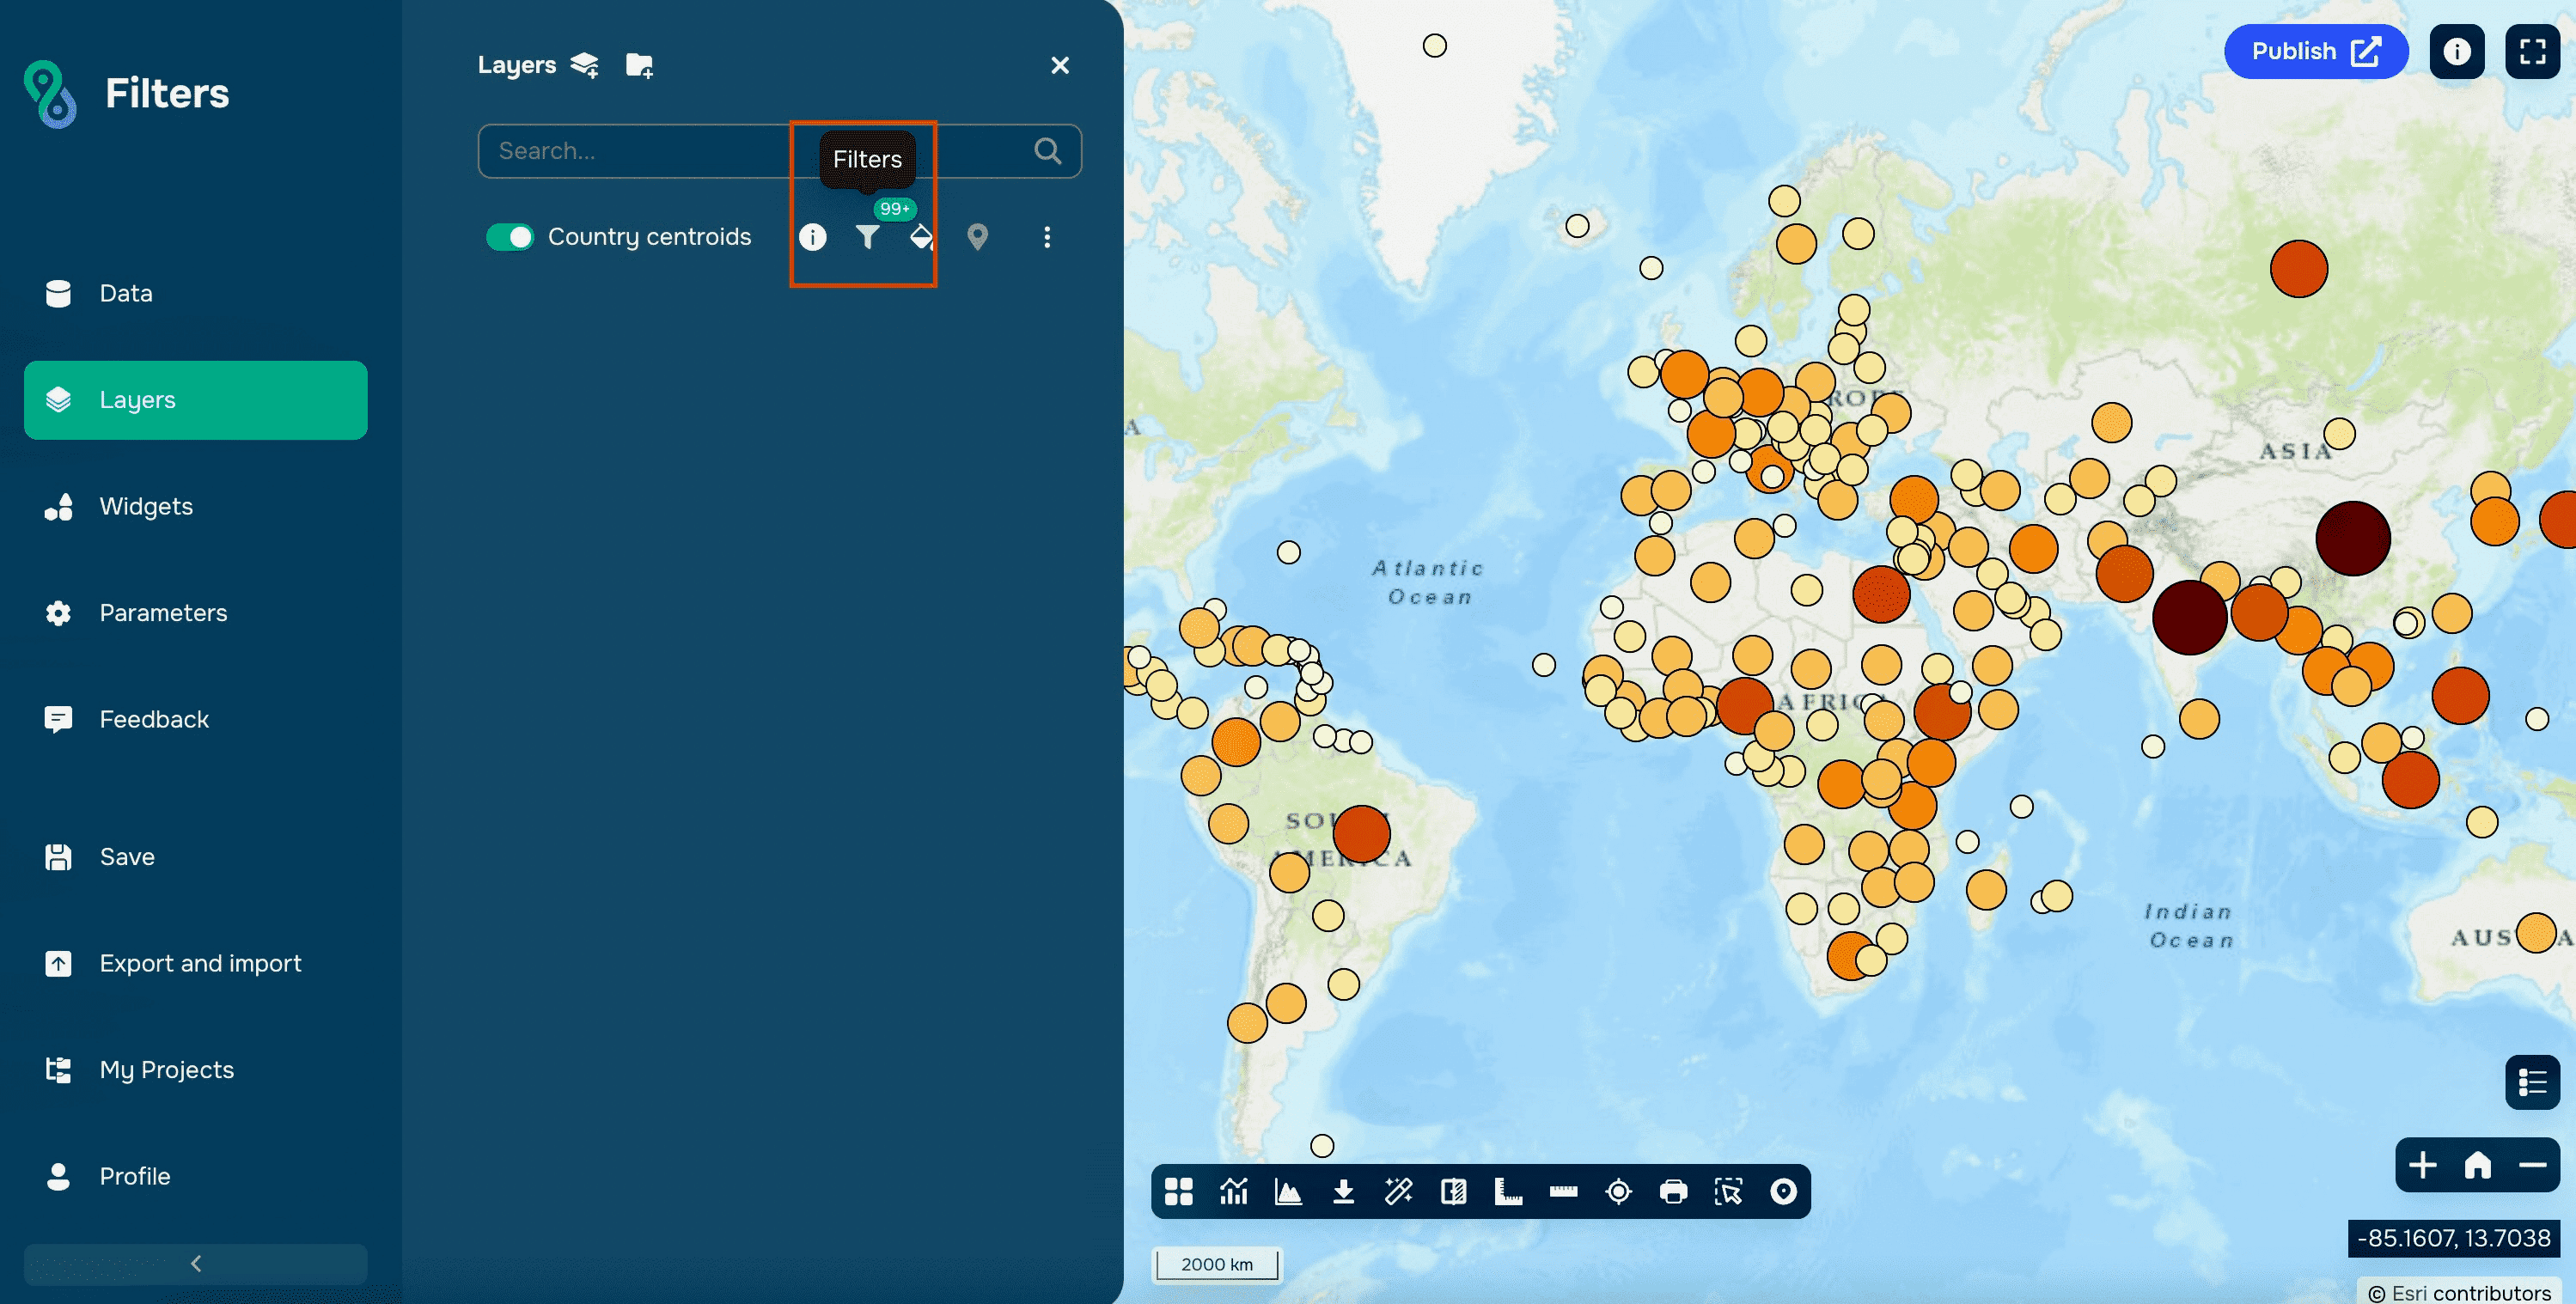
Just click on it to open filters
Pro Tips for Effective Filtering
Combine Filters: Use multiple filters to refine your data further.
Dynamic Visuals: Highlight filtered data with custom styles for better map clarity.
Save Time: Use pre-configured filters for recurring tasks.
Why Use Filtering in GISCARTA?
User-Friendly Interface: Easily create and manage filters without technical expertise.
Enhanced Analysis: Focus on the data that matters most for your project.
Improved Maps: Create cleaner, more impactful visualizations by filtering out unnecessary information.
Conclusion
GIS filtering is a game-changer for anyone working with geospatial data. It simplifies complex datasets, enhances analysis, and improves map readability. With tools like GISCARTA, filtering becomes effortless, allowing you to focus on what truly matters—making informed decisions and telling compelling stories through your maps.


