
Los procesos ambientales no pueden considerarse de manera espacial. El cambio climático, la contaminación del aire y del agua, la degradación del suelo y la pérdida de biodiversidad ocurren de forma desigual y dependen de diversos factores, desde la topografía hasta la actividad humana. Los sistemas de información geográfica (SIG) permiten combinar y analizar estos datos en un entorno unificado.
SIG se utiliza para trabajar con imágenes satelitales, indicadores climáticos, datos de observación y capas vectoriales, lo que lo convierte en una herramienta versátil para los problemas ambientales.
Tipos y fuentes de datos
Se utilizan diversas fuentes de datos para el análisis ambiental.
Datos satelitales:
Copernicus: datos sobre el estado de la superficie terrestre, la vegetación y los cuerpos de agua
Landsat: observaciones satelitales a largo plazo para el análisis de cambios
Datos climáticos:
ERA5 / Copernicus Climate Data Store: temperatura, precipitación, viento y otros parámetros climáticos
Fuentes adicionales:
Global Forest Watch: datos sobre bosques y deforestación
NASA EarthData: clima y procesos naturales
OpenStreetMap: carreteras, cuerpos de agua e infraestructura
World Bank Data: indicadores socioeconómicos relacionados con el medio ambiente
La calidad y la relevancia de los datos influyen directamente en la precisión del análisis.
Monitoreo ambiental
SIG se utiliza ampliamente para seguir los cambios a lo largo del tiempo. Los sistemas permiten analizar la deforestación, los cambios en los cuerpos de agua y el crecimiento urbano.
Por ejemplo, Global Forest Watch se utiliza para monitorear la pérdida de bosques, y los datos satelitales se usan para calcular índices de vegetación como NDVI.
Análisis de cambios y riesgos
Comparar datos de distintos períodos nos permite identificar cambios en el uso del suelo, la urbanización y la degradación del suelo.
SIG también se utiliza para evaluar riesgos naturales:
inundaciones
incendios
sequías
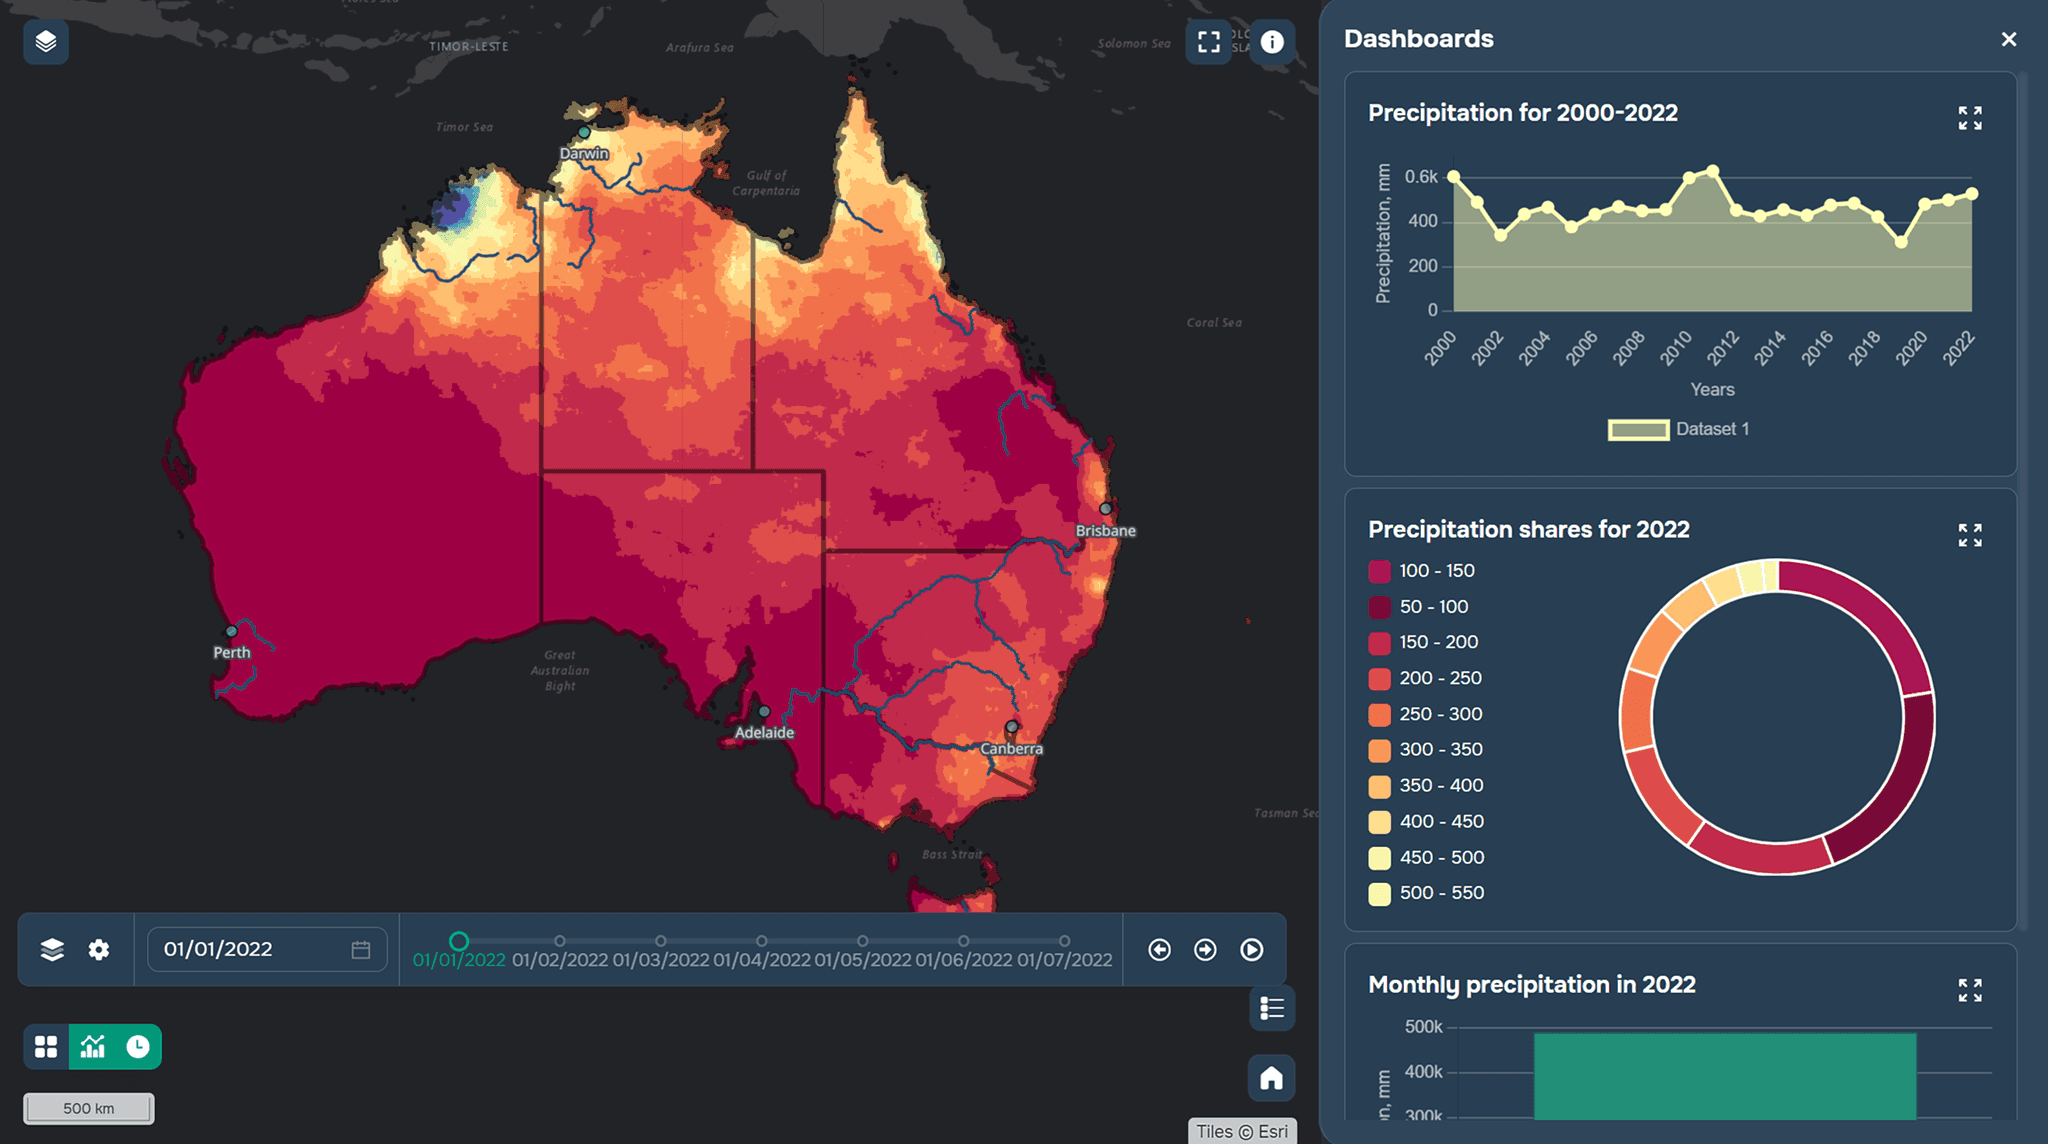
NASA EarthData permite analizar la precipitación, la temperatura y la humedad, evaluando la probabilidad de eventos extremos.
Modelado ambiental
SIG permite modelar la propagación de la contaminación, teniendo en cuenta el relieve y las condiciones climáticas.
Superposición espacial
interpolación
análisis de series temporales
Estos métodos ayudan a predecir cambios y evaluar impactos.
Aplicaciones en diversos campos
SIG se utiliza en diversos campos ambientales:
Recursos hídricos:
Análisis de cuencas hidrográficas
Evaluación de la calidad del agua
Ecología urbana:
Análisis de la contaminación del aire
Distribución de espacios verdes
Biodiversidad:
Determinación del rango de distribución de las especies
Planificación de áreas protegidas
Herramientas
Se utilizan diversas herramientas para trabajar con datos ambientales.
SIG de escritorio: QGIS, ArcGIS
SIG web: GISCARTA
Plataformas especializadas: Google Earth Engine
La elección de la herramienta depende de la tarea y del volumen de datos.
Preguntas frecuentes
¿Qué datos se utilizan en el SIG ambiental?
Imágenes satelitales, datos climáticos, observaciones y geodatos vectoriales.
¿Se pueden usar datos abiertos?
Sí, Copernicus, NASA y OpenStreetMap se utilizan ampliamente en proyectos ambientales.
¿Qué herramientas son mejores para el análisis?
QGIS es adecuado para análisis complejos, mientras que las plataformas web son adecuadas para una visualización rápida.
Puntos clave
SIG permite analizar los procesos ambientales mediante datos espaciales y cambios temporales.
La calidad de los datos de origen influye directamente en la precisión de los resultados.
Las tecnologías modernas hacen que el análisis ambiental sea más accesible y escalable.


