
El marketing moderno depende cada vez menos de indicadores promedio y más de ubicaciones específicas. En un entorno altamente competitivo, es importante entender no solo quién es su cliente, sino también dónde se encuentra. Aquí es donde entra el geomarketing: un enfoque que combina analítica de marketing y datos espaciales.
Los sistemas de información geográfica (SIG) ayudan a transformar datos dispersos en una imagen clara: dónde se concentra la demanda, cómo se distribuyen los clientes y qué áreas tienen mayor potencial.
Geografía de la demanda
Incluso dentro de una misma ciudad, la demanda se distribuye de forma desigual. Algunas áreas tienen una alta densidad de clientes, mientras que otras presentan una actividad mínima. Las tablas simples no revelan esta diferencia, pero un mapa la hace inmediatamente evidente.
Los SIG ayudan a visualizar estos patrones y a descubrir patrones ocultos en los datos.
Selección de la ubicación
Una de las tareas clave del geomarketing es elegir la ubicación de un negocio. Se tienen en cuenta los siguientes aspectos:
densidad de población
presencia de competidores
accesibilidad del transporte
infraestructura
Usando herramientas como QGIS o GISCARTA, puede superponer todos estos datos en un mapa y evaluar la viabilidad de una ubicación.
Análisis de accesibilidad
La distancia no siempre refleja la situación real. Lo que importa no es "cuántos kilómetros", sino "cuánto tiempo".
Las isócronas permiten determinar zonas de accesibilidad, por ejemplo, qué áreas están a 10 o 15 minutos de una tienda.
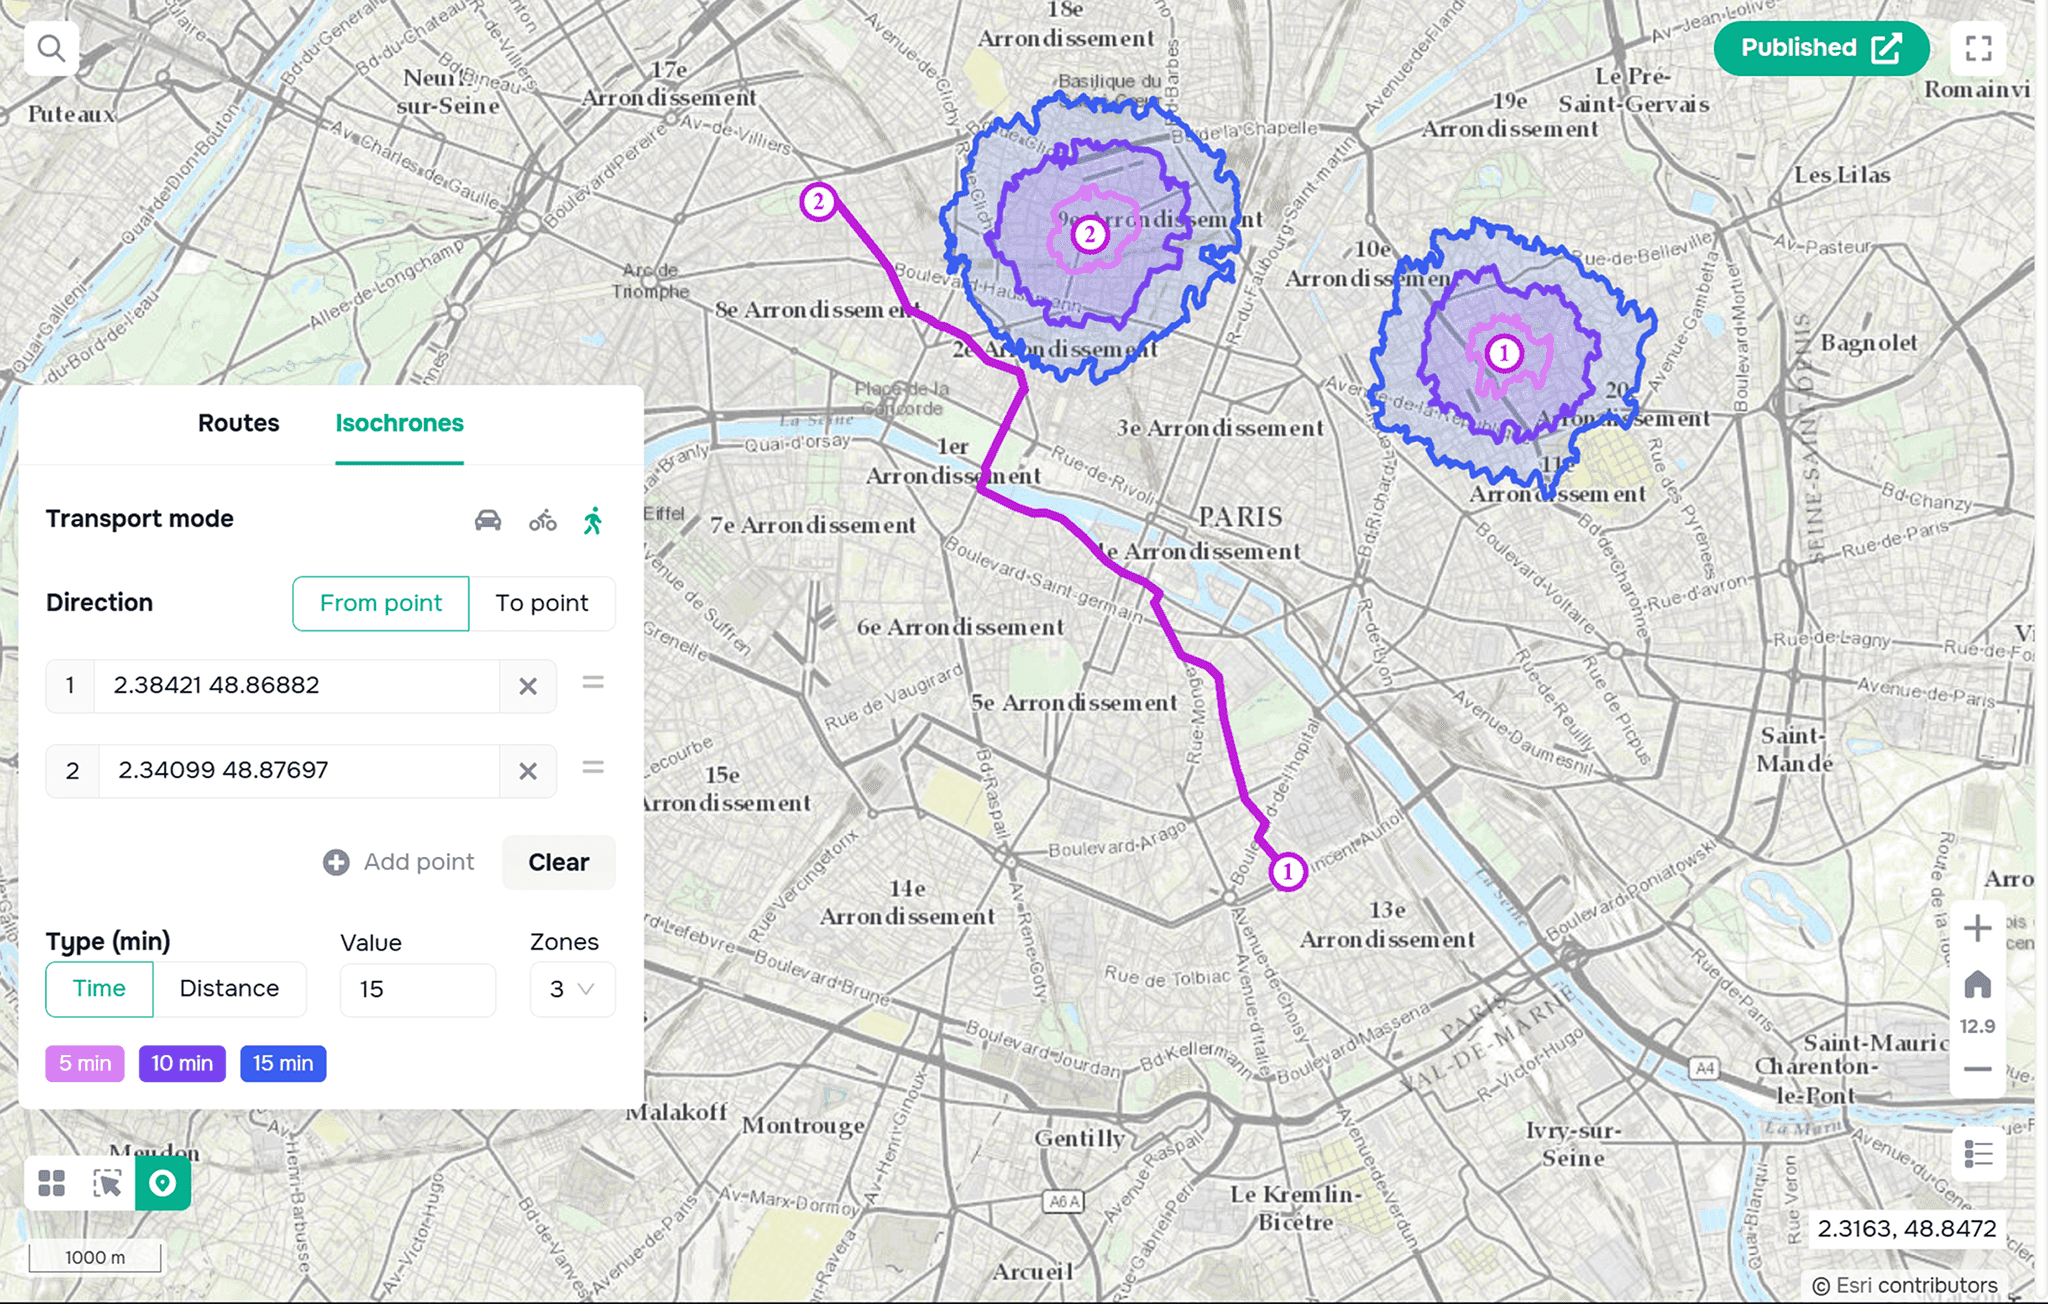
Puede obtener más información sobre el widget de Analítica de Transporte en GISCARTA aquí.
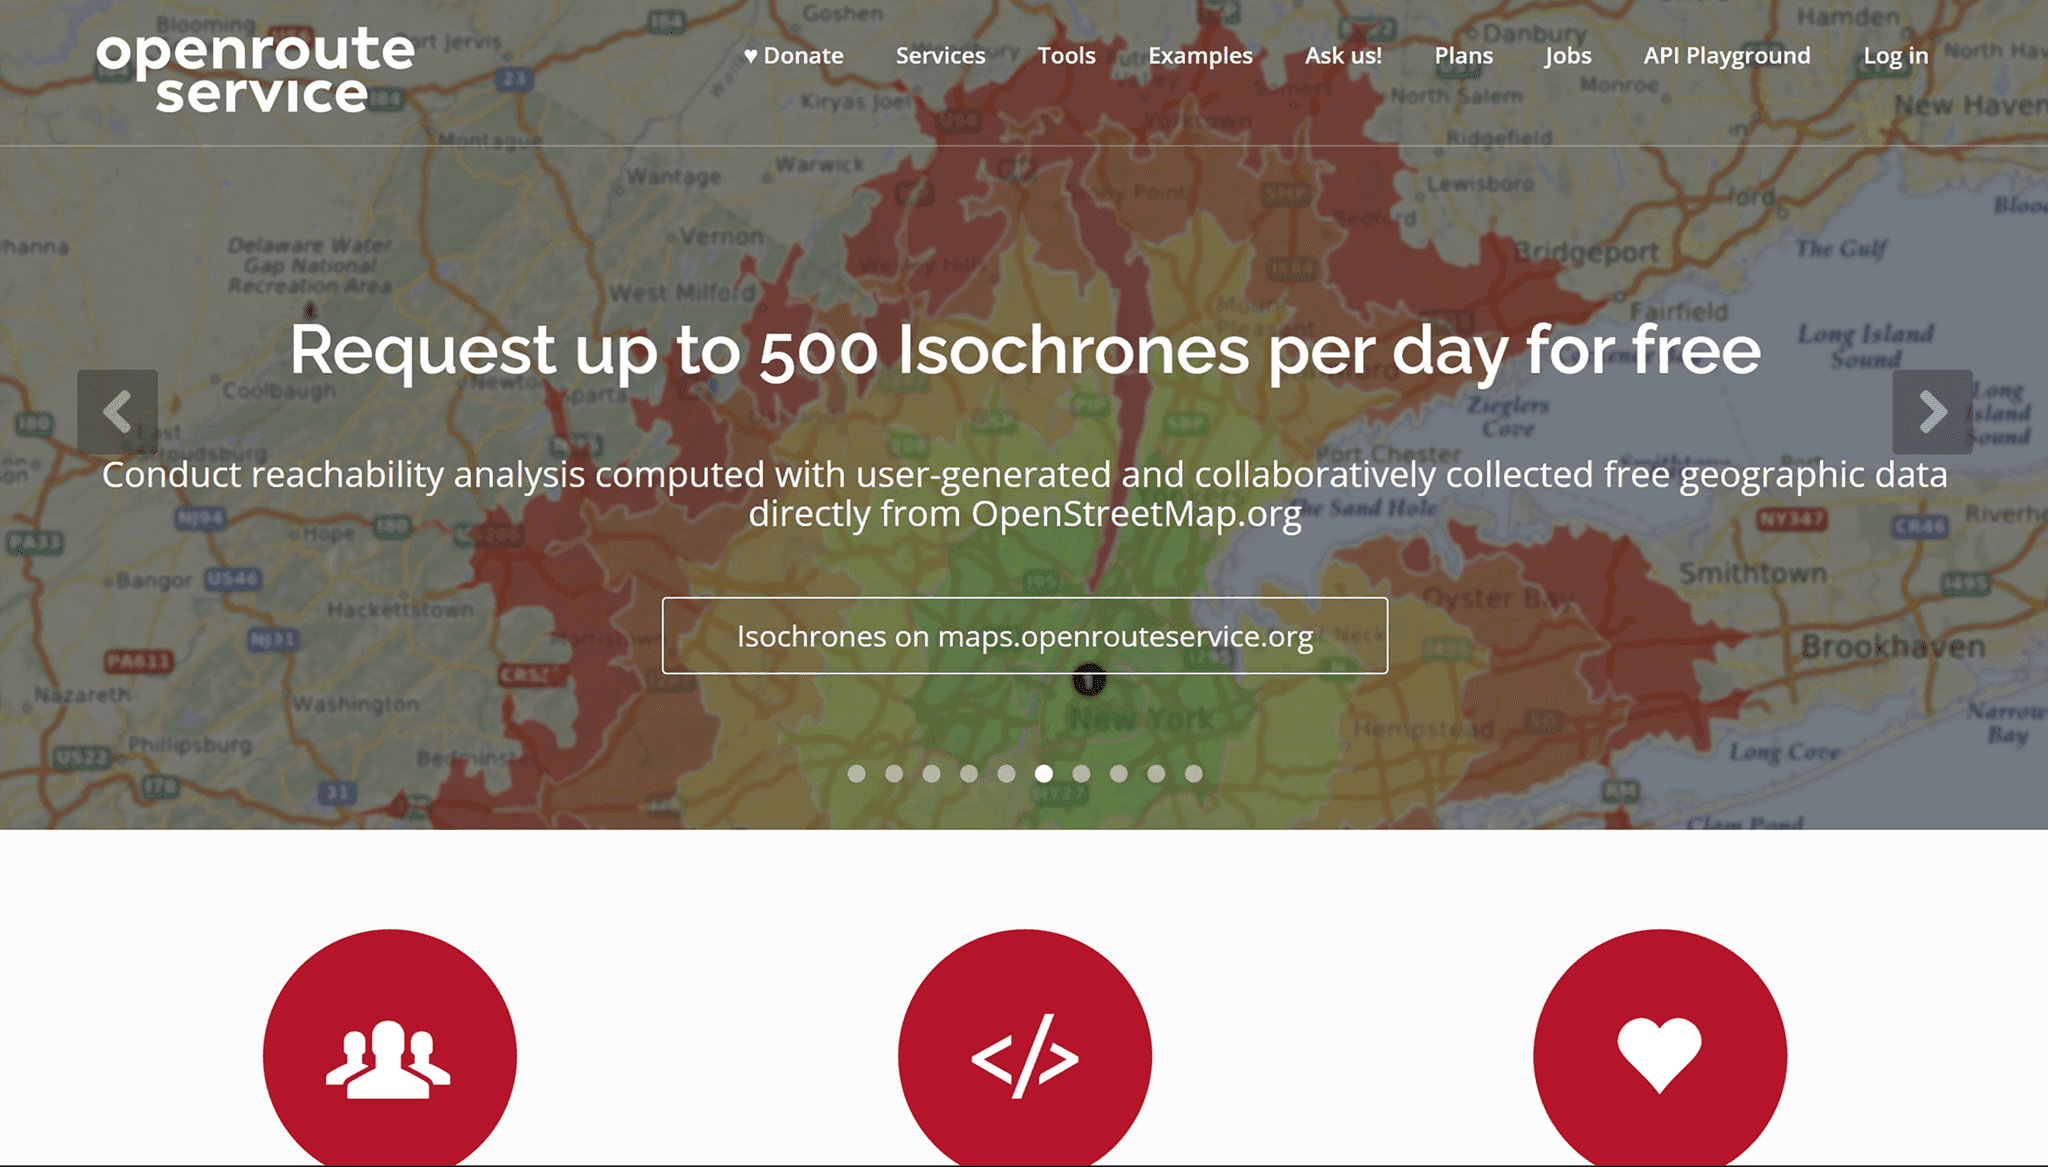
Estas herramientas están disponibles a través de OpenRouteService o Mapbox y se utilizan ampliamente en el comercio minorista y la logística.
Segmentación de audiencia
El geomarketing le permite analizar no solo el número de personas, sino también sus características:
nivel de ingresos
edad
densidad de población
Para ello se utilizan fuentes abiertas como World Bank y UN Data.
Análisis de la competencia
Al combinar estos datos con la geografía, puede comprender mejor a su audiencia. Análisis de la competencia
Es importante entender no solo dónde se encuentran los clientes, sino también dónde ya operan los competidores.
Usando datos de OpenStreetMap o Google Maps, puede:
determinar la densidad de competidores
identificar áreas saturadas
encontrar territorios no ocupados
Mapas de calor y densidad
Los mapas de calor le permiten ver rápidamente la concentración de actividad: clientes, pedidos o tráfico.
Esta es una de las herramientas más visuales y que a menudo se utiliza para el análisis inicial.
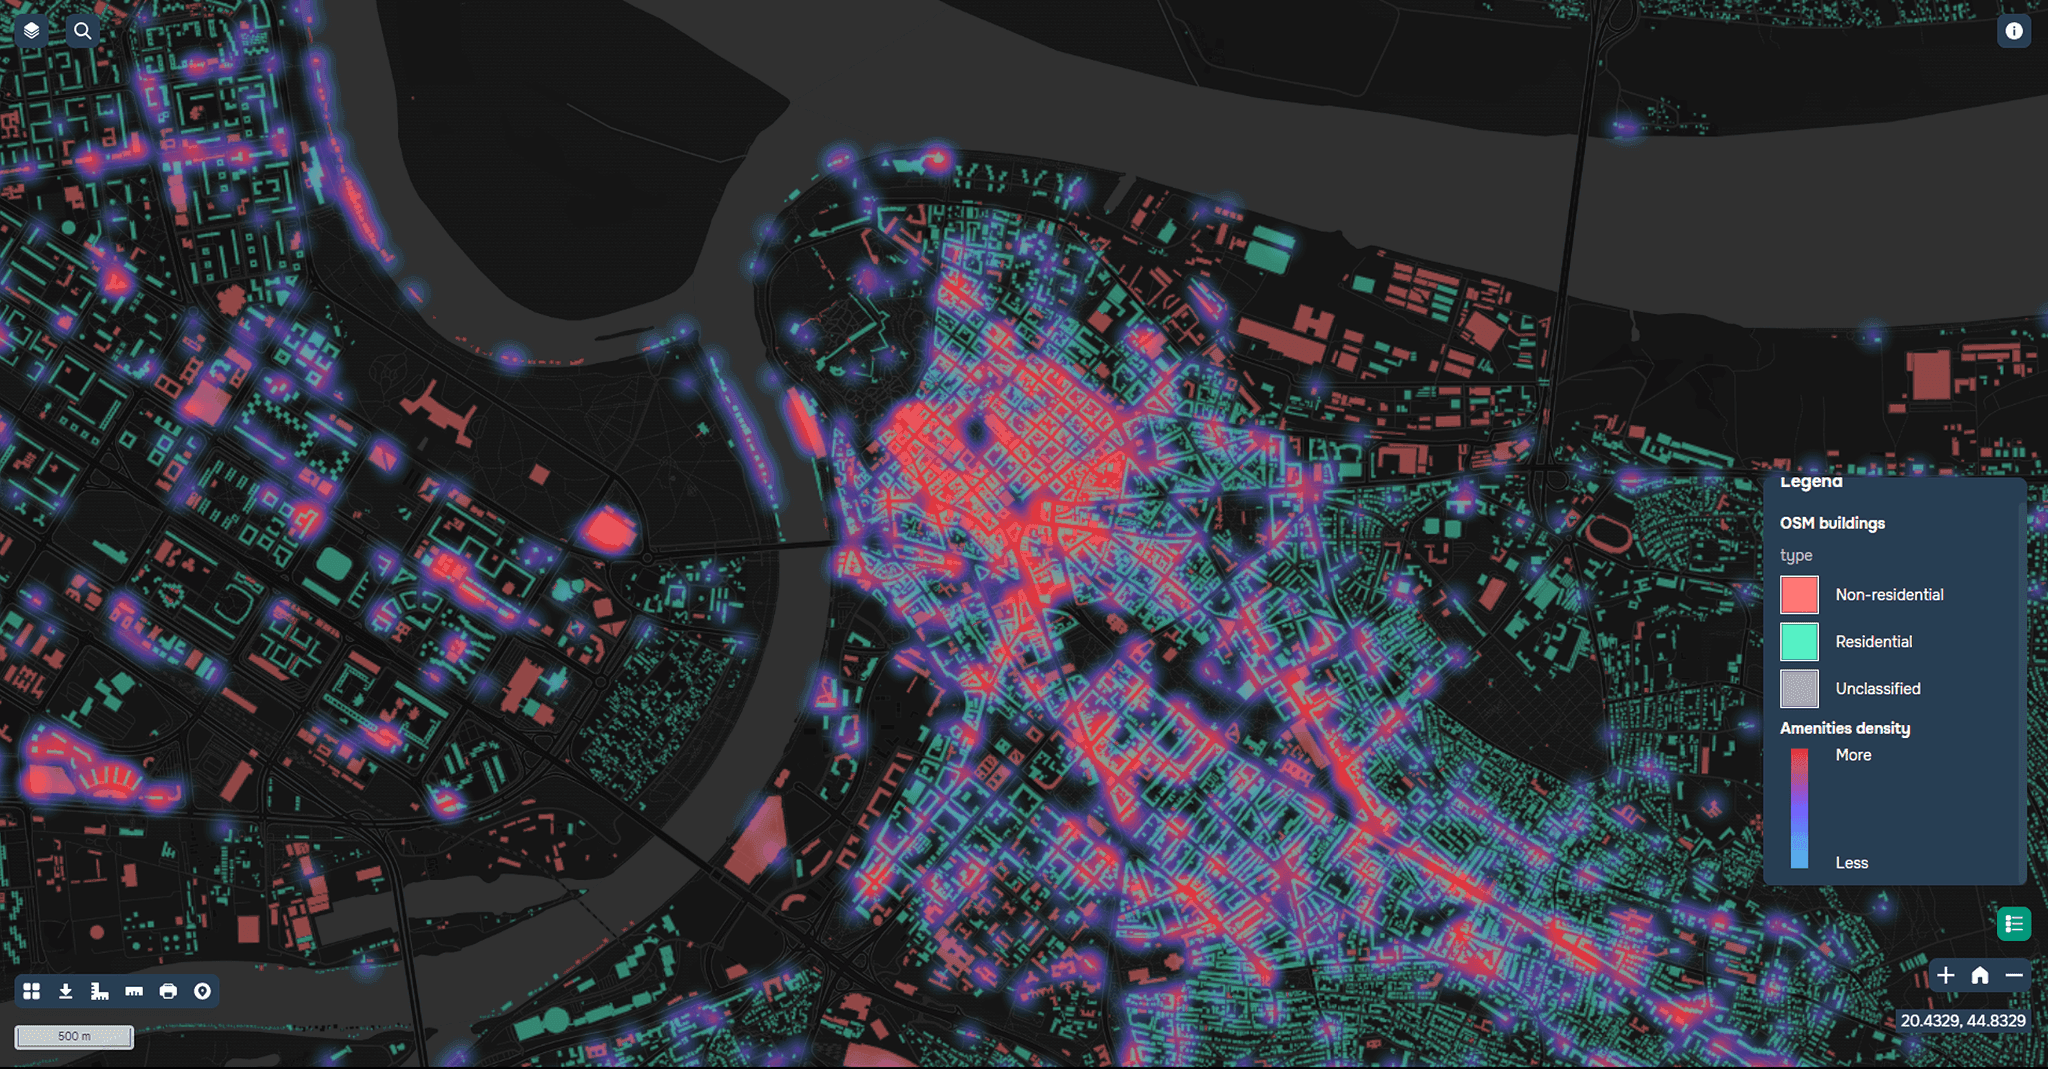
Puede obtener más información sobre el HeatMap en GISCARTA aquí.
Herramientas y paneles
Los sistemas GIS modernos le permiten no solo crear mapas, sino también combinarlos con analítica.
QGIS: para análisis complejos
GISCARTA: para visualización rápida, trabajo en el navegador y paneles
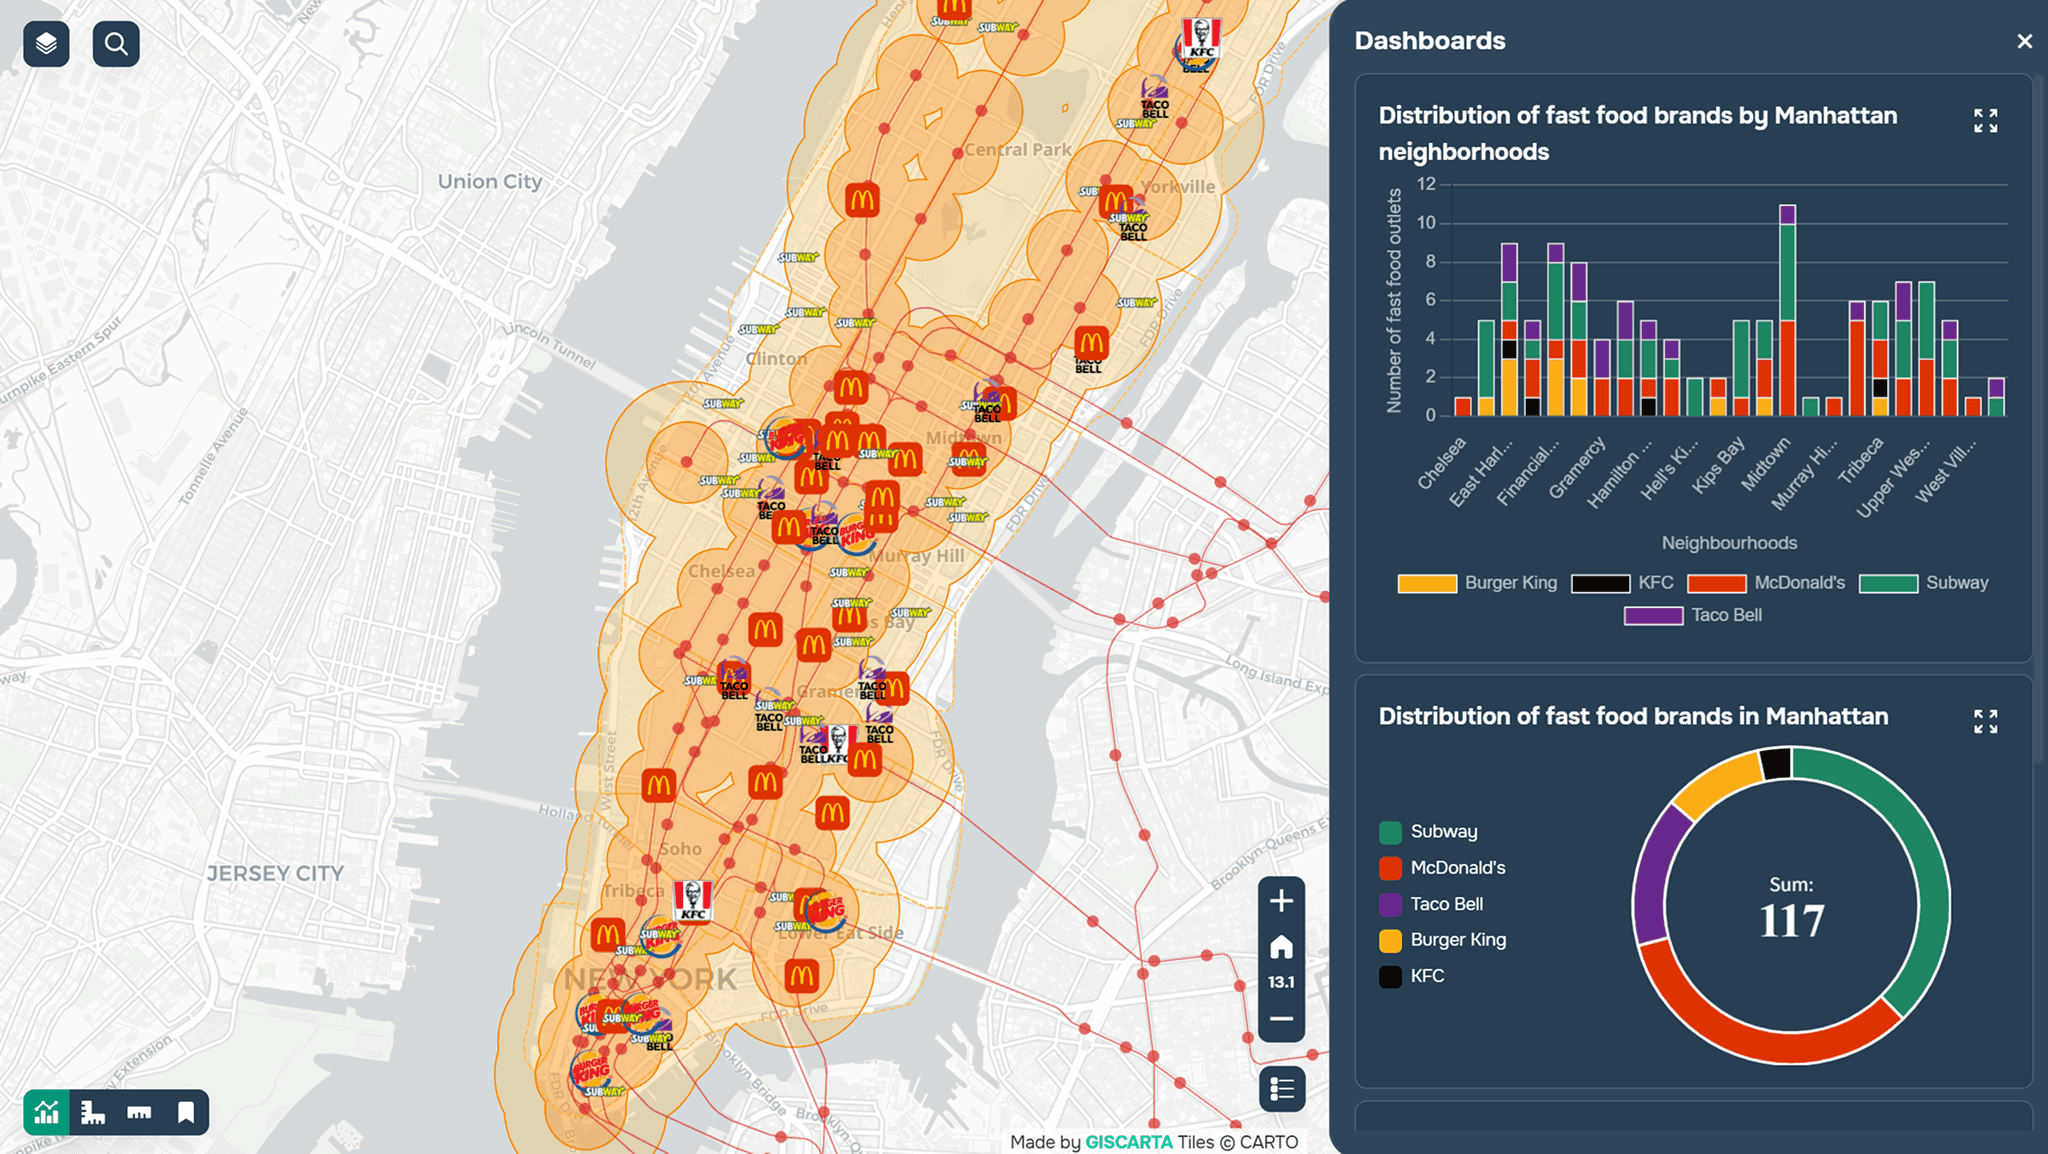
Puede obtener más información sobre los paneles en GISCARTA aquí.
Esta combinación le permite pasar de un mapa a una analítica completa.
Limitaciones
A pesar de las capacidades, es importante considerar las limitaciones:
los datos pueden estar desactualizados
no siempre reflejan el comportamiento humano real
un mapa muestra una correlación, pero no siempre la causa
Por lo tanto, los resultados del análisis requieren una interpretación adicional.
Preguntas frecuentes
¿Qué es el geomarketing?
Es el uso de datos geográficos para analizar el mercado, los clientes y la ubicación del negocio.
¿Qué datos se necesitan para este análisis?
Demografía, redes viales, datos sobre competidores y comportamiento de los usuarios.
¿Se pueden usar datos abiertos?
Sí, OpenStreetMap y las bases de datos estadísticas internacionales se utilizan ampliamente.
Conclusiones clave
Los SIG le permiten analizar el mercado a través de datos espaciales e identificar patrones que no se pueden ver en tablas.
La ubicación desempeña un papel fundamental en el éxito empresarial, ya que influye en la demanda, la accesibilidad y la competencia.
Combinar múltiples capas de datos (demografía, infraestructura, competidores) conduce a decisiones más informadas y precisas.


