
En proyectos relacionados con el desarrollo urbano, la analítica empresarial y los SIG, surge una y otra vez la misma pregunta: ¿qué tan accesible es un área en la vida real, y no solo en un mapa? Las isocronas ofrecen una de las respuestas más visuales. Nos permiten evaluar el espacio utilizando el tiempo de viaje en lugar de distancias abstractas.
¿Qué son las isocronas y por qué se necesitan?
Las isocronas son líneas en un mapa que conectan puntos a los que se puede llegar en la misma cantidad de tiempo desde un punto de partida determinado. Se utilizan para visualizar la accesibilidad del transporte y estimar los tiempos de viaje.
Tipos de isocronas:
Isocronas peatonales – muestran cuánto tiempo se tarda en caminar.
Isocronas para automóviles – tienen en cuenta las condiciones de la vía, los límites de velocidad y los atascos.
Isocronas de transporte público – modelan los tiempos de viaje según los horarios del transporte.
Isocronas para bicicletas – tienen en cuenta el terreno y las ciclovías disponibles.
A diferencia de los búferes convencionales, las isocronas tienen en cuenta la red de transporte real: carreteras, rutas, restricciones y velocidades de desplazamiento. Por eso se utilizan ampliamente en desarrollo urbano, planificación del transporte y comercio minorista.
De los primeros mapas isócronos a los SIG modernos
El concepto de isocronas surgió mucho antes de la aparición de la cartografía digital. Los primeros mapas isócronos aparecieron en el siglo XIX y se crearon completamente en formato analógico. Se dibujaban a mano sobre mapas en papel, mostrando áreas accesibles a pie, a caballo o por ferrocarril en un tiempo determinado.
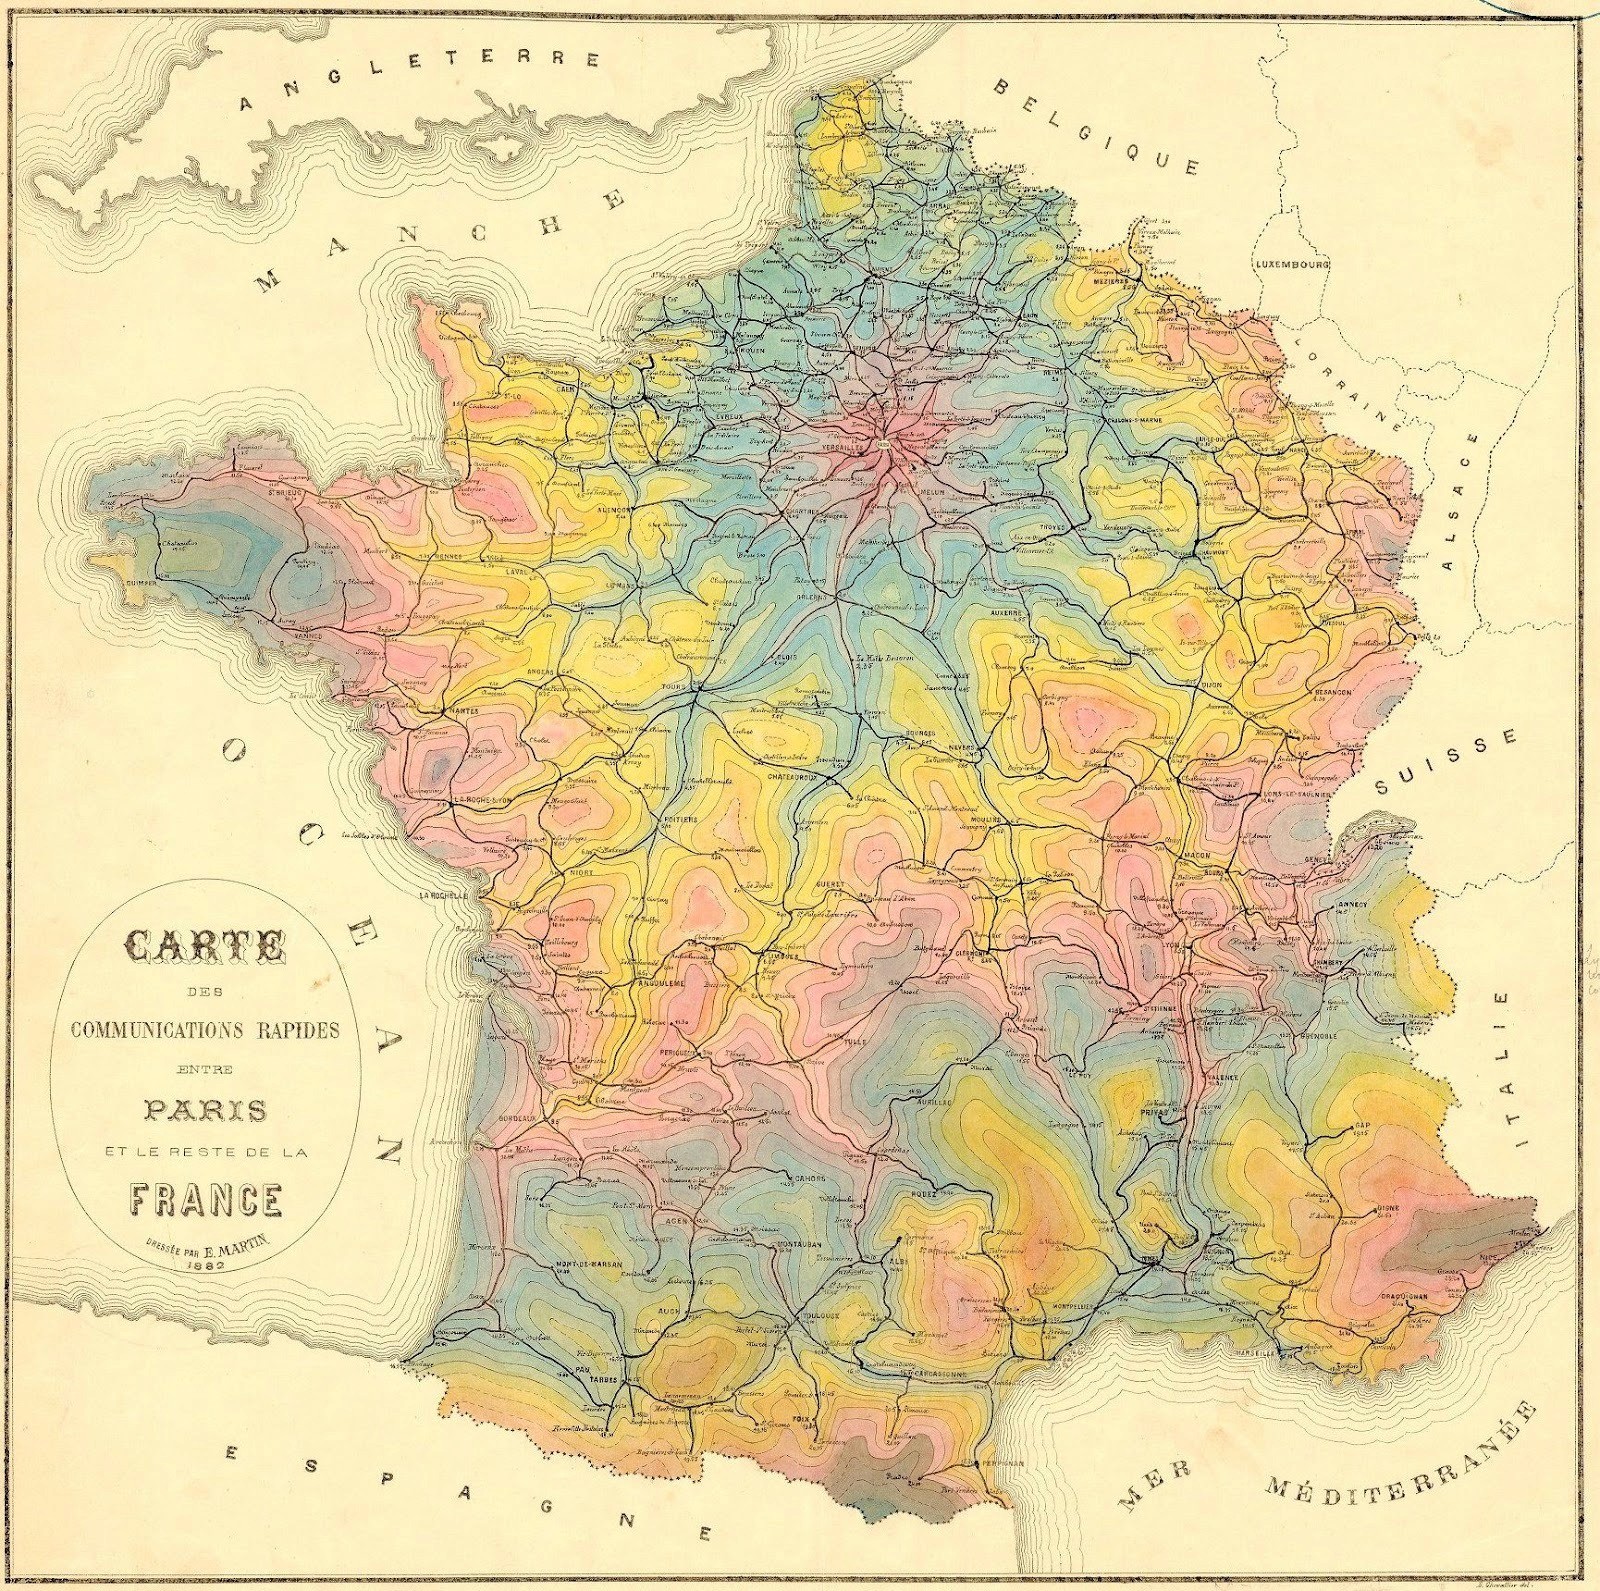
Mapa isócrono de París, 1882
Los cálculos se basaban en velocidades promedio y supuestos simplificados sobre rutas y relieve. A pesar de su baja precisión según los estándares modernos, se utilizaron ampliamente en la planificación militar, la logística postal y los primeros estudios urbanos.
Con el desarrollo de la tecnología informática y los SIG, las isocronas pasaron de mapas estáticos en papel a formatos vectoriales digitales. Los contornos dibujados a mano dieron paso a líneas y polígonos, y el análisis de redes permitió tener en cuenta la infraestructura de transporte del mundo real. Hoy en día, las isocronas existen como capas vectoriales dinámicas que se calculan y visualizan de forma interactiva en SIG de escritorio y web.
¿Cómo se construyen las isocronas en SIG?
La construcción de isocronas se basa en el análisis de redes. La red de transporte se representa como un grafo, donde a cada segmento se le asigna un valor—tiempo o distancia. Los algoritmos de enrutamiento determinan qué partes de la red son alcanzables dentro de un umbral dado, tras lo cual los resultados se visualizan como zonas de disponibilidad.
En la mayoría de los casos, OpenStreetMap se utiliza como red subyacente. Dependiendo de la herramienta, pueden tenerse en cuenta diferentes tipos de transporte, perfiles de velocidad y restricciones de tráfico.
¿Cómo se construyen las isocronas en QGIS?
Los SIG de escritorio, como QGIS, ofrecen varias formas de construir isocronas usando herramientas de análisis de redes y diversos complementos. Una de las soluciones más populares es QNEAT3 (QGIS Network Analysis Toolbox). Este complemento permite construir isocronas basadas en una red vial según tiempo o distancia. QNEAT3 utiliza algoritmos de grafos y es adecuado para un análisis espacial detallado, pero requiere una red correctamente preparada y atributos de velocidad o peso.
Otra opción popular es ORS Tools, que conecta QGIS con la API de OpenRouteService. Permite una construcción rápida de isocronas sin preparación manual de la red, pero depende del servicio externo, de los límites de la API y de los perfiles de enrutamiento disponibles.
QGIS también ofrece herramientas integradas de análisis de redes para calcular áreas de servicio y alcanzabilidad. Estas herramientas son potentes, pero menos intuitivas y a menudo requieren múltiples pasos de procesamiento.
Isocronas en GISCARTA: Widget de accesibilidad del transporte
En la plataforma GISCARTA, hemos implementado el cálculo de isocronas en forma de un widget de accesibilidad del transporte.
En nuestra plataforma GIS, el análisis de accesibilidad se implementa mediante un widget de accesibilidad del transporte dedicado, diseñado para tareas analíticas y de presentación cotidianas.
Cálculo de la ruta más corta
Los usuarios pueden construir la ruta más corta entre dos o más puntos directamente en el mapa. La ruta se calcula a lo largo de la red de transporte y se adapta al modo de desplazamiento seleccionado, lo que permite comparar rápidamente opciones y distancias de viaje.
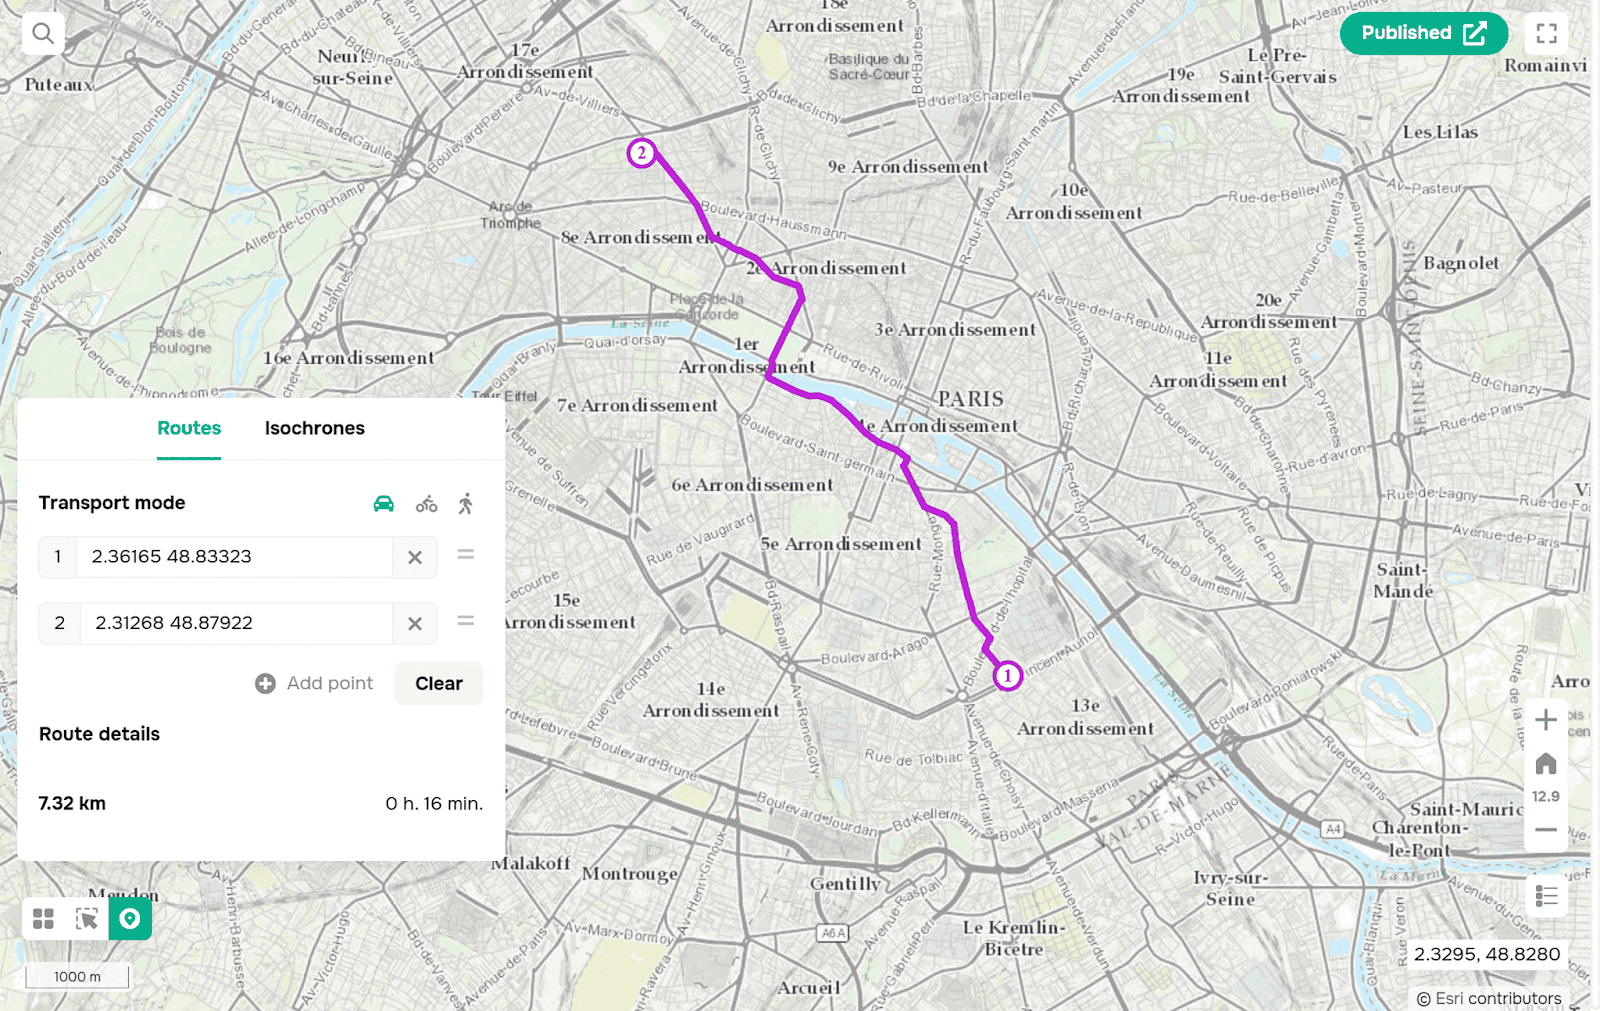
Construya la ruta más corta en la plataforma GISCARTA usando el widget de Accesibilidad del Transporte.
Isocronas desde una o múltiples ubicaciones
El widget permite construir isocronas desde un solo punto o desde múltiples puntos de partida a la vez. Esto permite comparar la accesibilidad desde diferentes ubicaciones y evaluar visualmente áreas de servicio superpuestas o en competencia.
Tanto para rutas como para isocronas, los usuarios pueden elegir el modo de transporte:
– acceso peatonal;
– enrutamiento en bicicleta;
– viaje en automóvil.
Dependiendo del modo seleccionado, el widget aplica automáticamente diferentes perfiles de enrutamiento y supuestos de desplazamiento. Las isocronas se generan para intervalos de tiempo seleccionados y se muestran como zonas claras y superpuestas en el mapa.
Este enfoque facilita responder preguntas prácticas como:
– qué áreas son alcanzables dentro de un tiempo determinado;
– cómo cambia la accesibilidad entre modos de transporte;
– dónde las áreas de servicio se intersectan o difieren.
El widget está diseñado para funcionar sin preparación de datos ni configuración de SIG. Todos los cálculos se realizan en segundo plano, lo que permite a los usuarios centrarse en la interpretación en lugar de la configuración técnica.
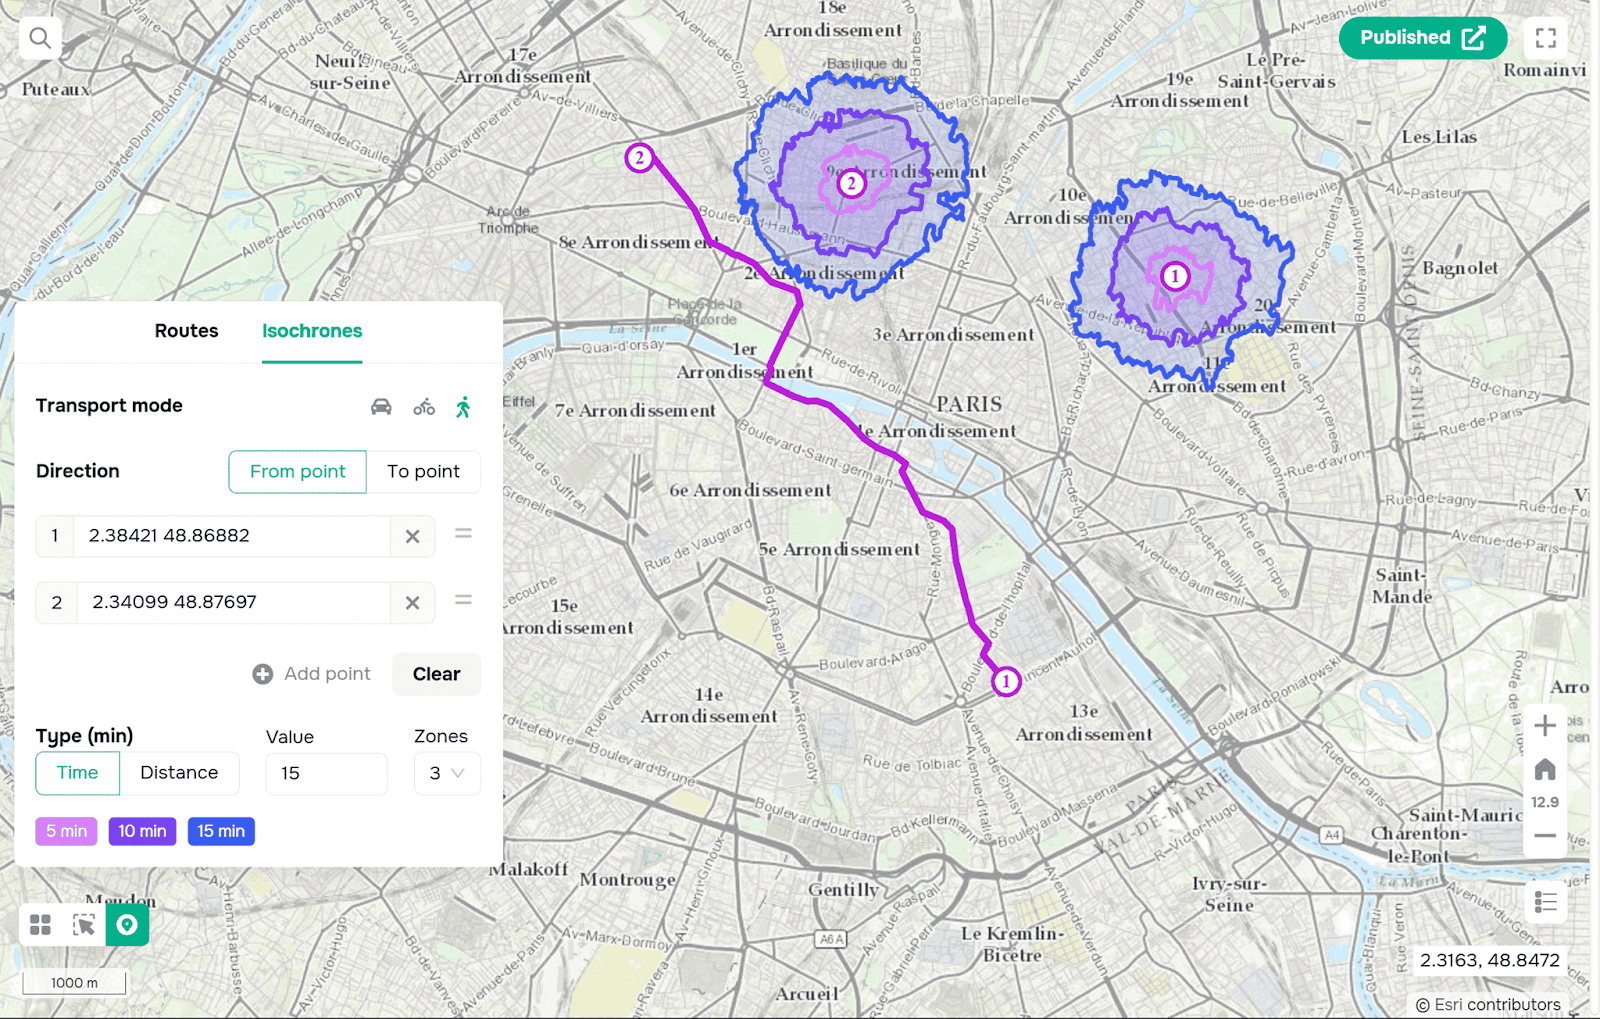
Construcción de isocronas en la plataforma GISCARTA usando el widget de Accesibilidad del Transporte.
Conclusiones clave
Las isocronas trasladan el análisis espacial de la distancia abstracta al tiempo de viaje real, haciendo que la accesibilidad sea más fácil de interpretar y comunicar.
La precisión de las isocronas depende en gran medida de la calidad de la red de transporte subyacente y de los supuestos de enrutamiento.
Las herramientas SIG de escritorio como QGIS proporcionan flujos de trabajo de isocronas potentes y flexibles, pero requieren preparación de datos y experiencia técnica.
Las isocronas basadas en web priorizan la velocidad, la interactividad y la claridad, lo que las hace especialmente eficaces para el análisis exploratorio y la toma de decisiones.
Preguntas frecuentes
¿Para qué se utilizan principalmente las isocronas?
Las isocronas se utilizan para analizar la accesibilidad del transporte en la planificación urbana, el análisis de ubicación de negocios, la logística y los estudios de infraestructura social.
¿En qué se diferencian las isocronas de los búferes?
Los búferes se basan en la distancia en línea recta, mientras que las isocronas se apoyan en redes de transporte y tiempo de viaje, produciendo resultados más realistas.
¿Se pueden construir isocronas usando datos abiertos?
Sí. La mayoría de las herramientas modernas de isocronas usan datos abiertos de transporte, principalmente OpenStreetMap, combinados con algoritmos de enrutamiento.
¿Cuándo se debe usar QGIS en lugar de herramientas web?
QGIS es preferible para análisis avanzados, flujos de trabajo personalizados y tareas de investigación que requieren control total sobre los datos y los parámetros.


