
El análisis visual desempeña un papel clave en los sistemas de información geográfica (SIG), especialmente al trabajar con datos espaciales multitemporales y heterogéneos. Muchas tareas prácticas requieren no solo mostrar múltiples capas, sino también compararlas visualmente para identificar diferencias, tendencias y cambios. El método tradicional de activar y desactivar capas una por una suele resultar incómodo e incompleto.
Cómo funciona el widget de comparación de capas
El widget está diseñado para comparar visualmente dos capas de mapa dividiendo el mapa mostrado. El usuario puede cambiar de forma interactiva el límite de visualización de las capas, observando las diferencias en tiempo real.
El modo más común es el modo Swipe: el mapa se divide mediante una línea vertical u horizontal que el usuario arrastra, revelando una capa sobre la otra.
El widget puede aplicarse tanto a datos ráster (imágenes satelitales, modelos digitales de elevación, mapas de propiedades del suelo) como a capas vectoriales (contornos de parcelas, polígonos de suelo, límites administrativos).
A diferencia de las herramientas analíticas que generan indicadores cuantitativos, este widget se centra principalmente en la interpretación visual. Su principal ventaja es la identificación rápida y clara de diferencias espaciales sin procedimientos computacionales complejos.
Aplicación
El widget de comparación de capas se utiliza ampliamente en diversos campos del análisis espacial.
Una de las aplicaciones más comunes es el monitoreo de cambios en el uso y la cobertura del suelo, donde se comparan imágenes satelitales de distintos períodos para identificar urbanización, deforestación o transformación de tierras agrícolas.
En estudios de suelos y medioambientales, la herramienta permite comparar modelos de propiedades del suelo, evaluar diferencias entre conjuntos de datos y verificar visualmente resultados de cartografía digital de suelos.
Para tareas de "antes-después", el widget se utiliza para evaluar el impacto de desastres naturales, implementar proyectos de infraestructura y realizar actividades de recuperación o restauración de tierras.
En desarrollo urbano y planificación territorial, se utiliza para analizar mapas históricos y modernos, evaluar el desarrollo espacial y evaluar cambios en la zonificación funcional.
Además, la naturaleza interactiva de la herramienta la convierte en un medio eficaz de presentación y comunicación, especialmente en SIG web y servicios públicos de cartografía.
La plataforma GISCARTA también implementa un widget de comparación de capas, que se describirá a continuación.
Trabajo con el widget en la plataforma GISCARTA
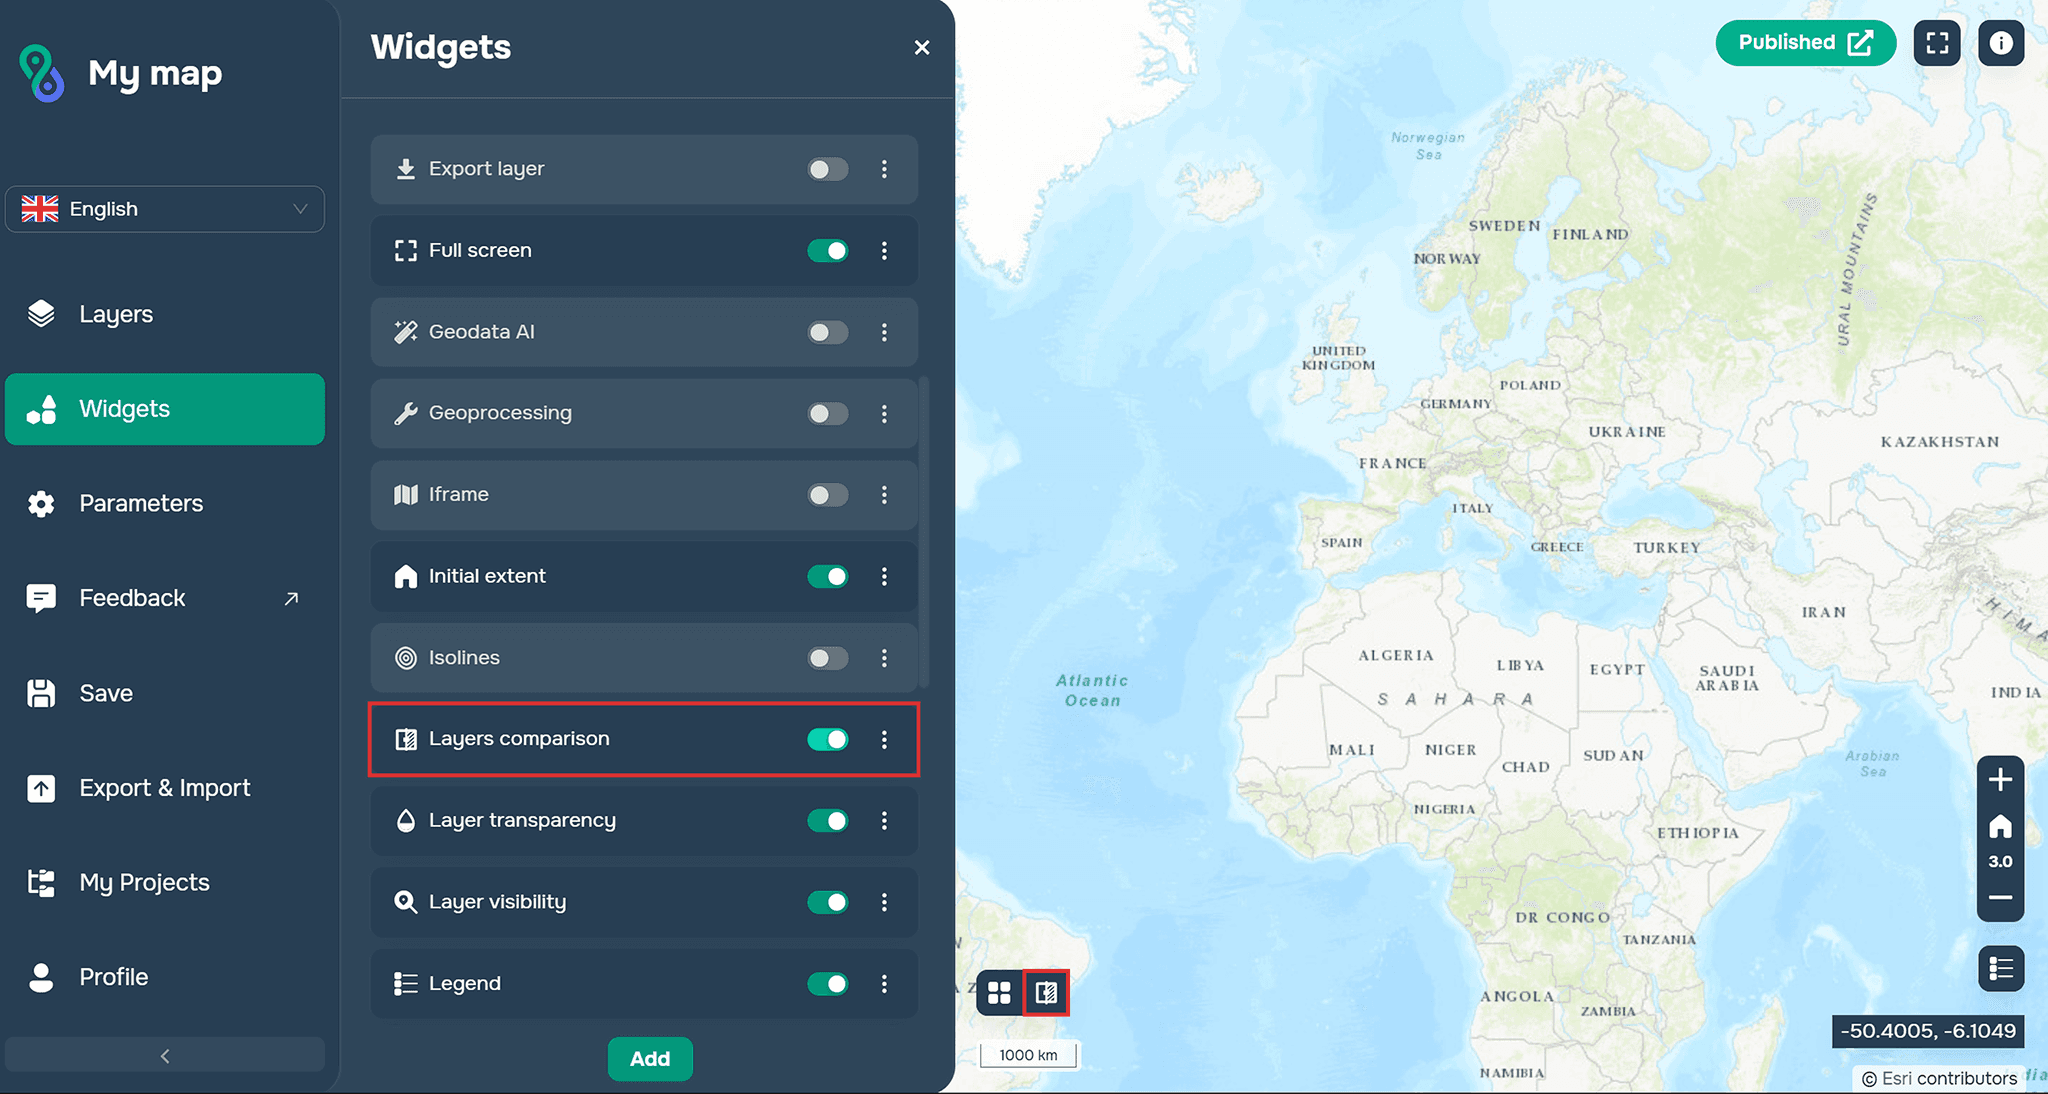
Paso 1. Para comenzar a trabajar con el widget, debe habilitar su disponibilidad en la barra de herramientas.
Paso 2. Ahora debe configurar el widget en su ventana de trabajo.
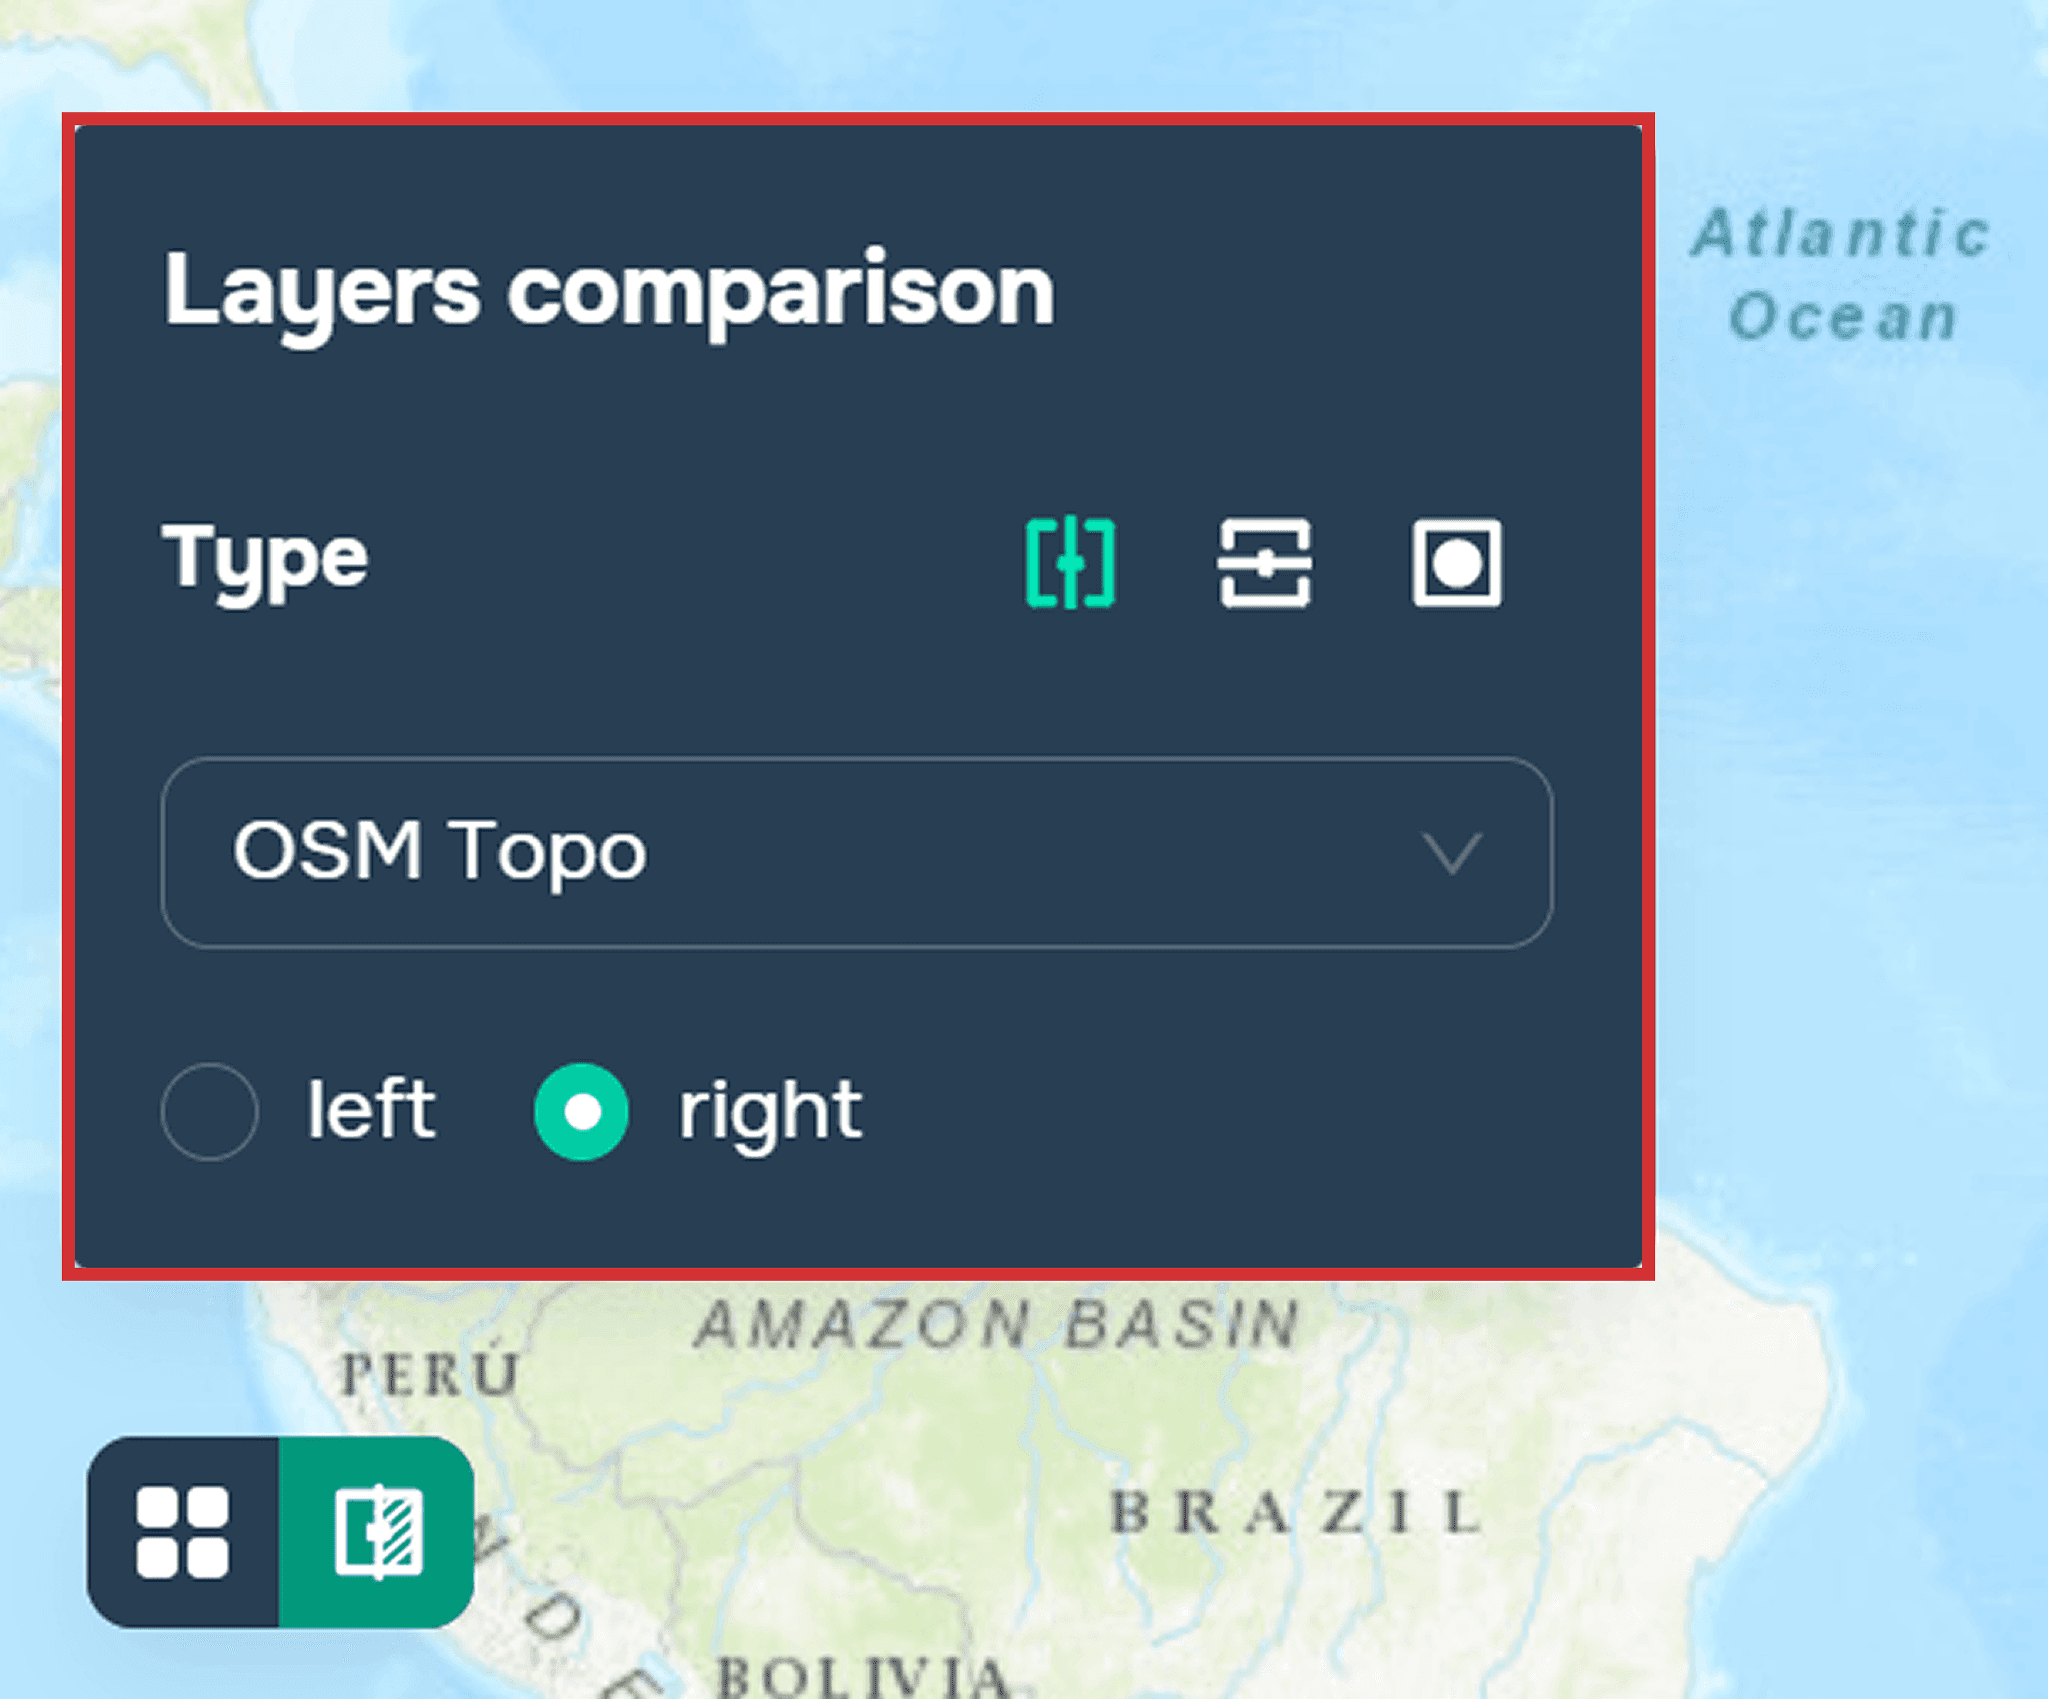
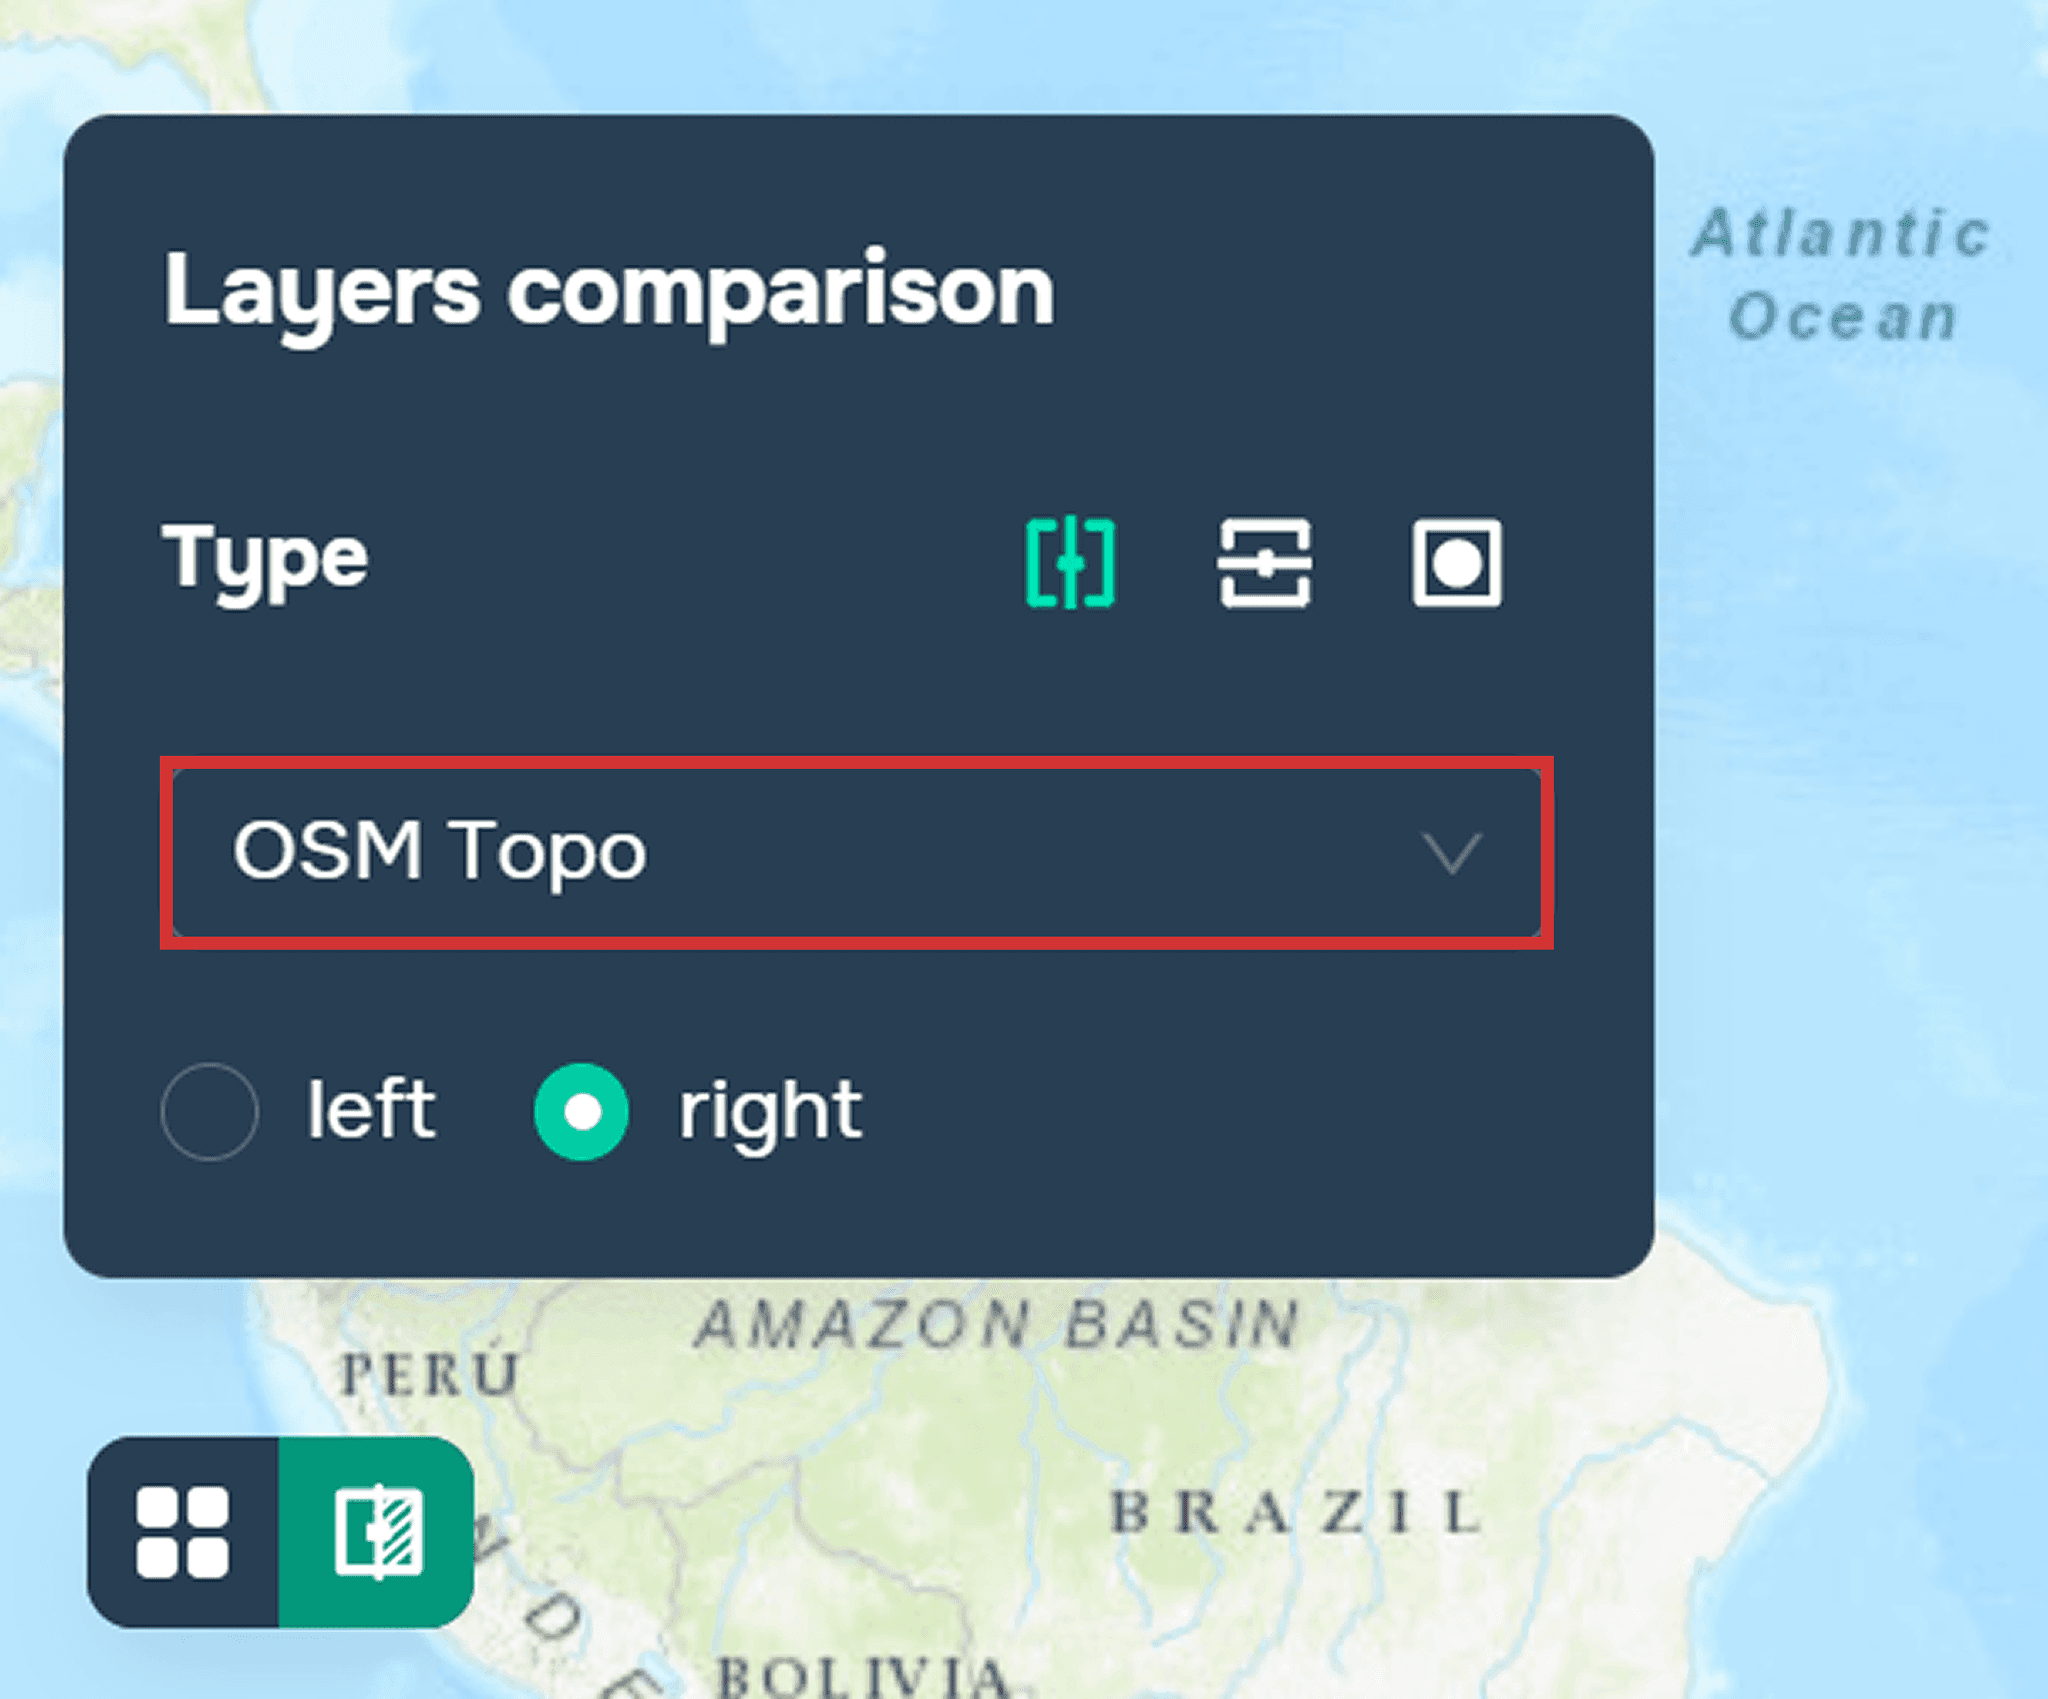
Debe seleccionar las capas que se compararán con el proyecto original.
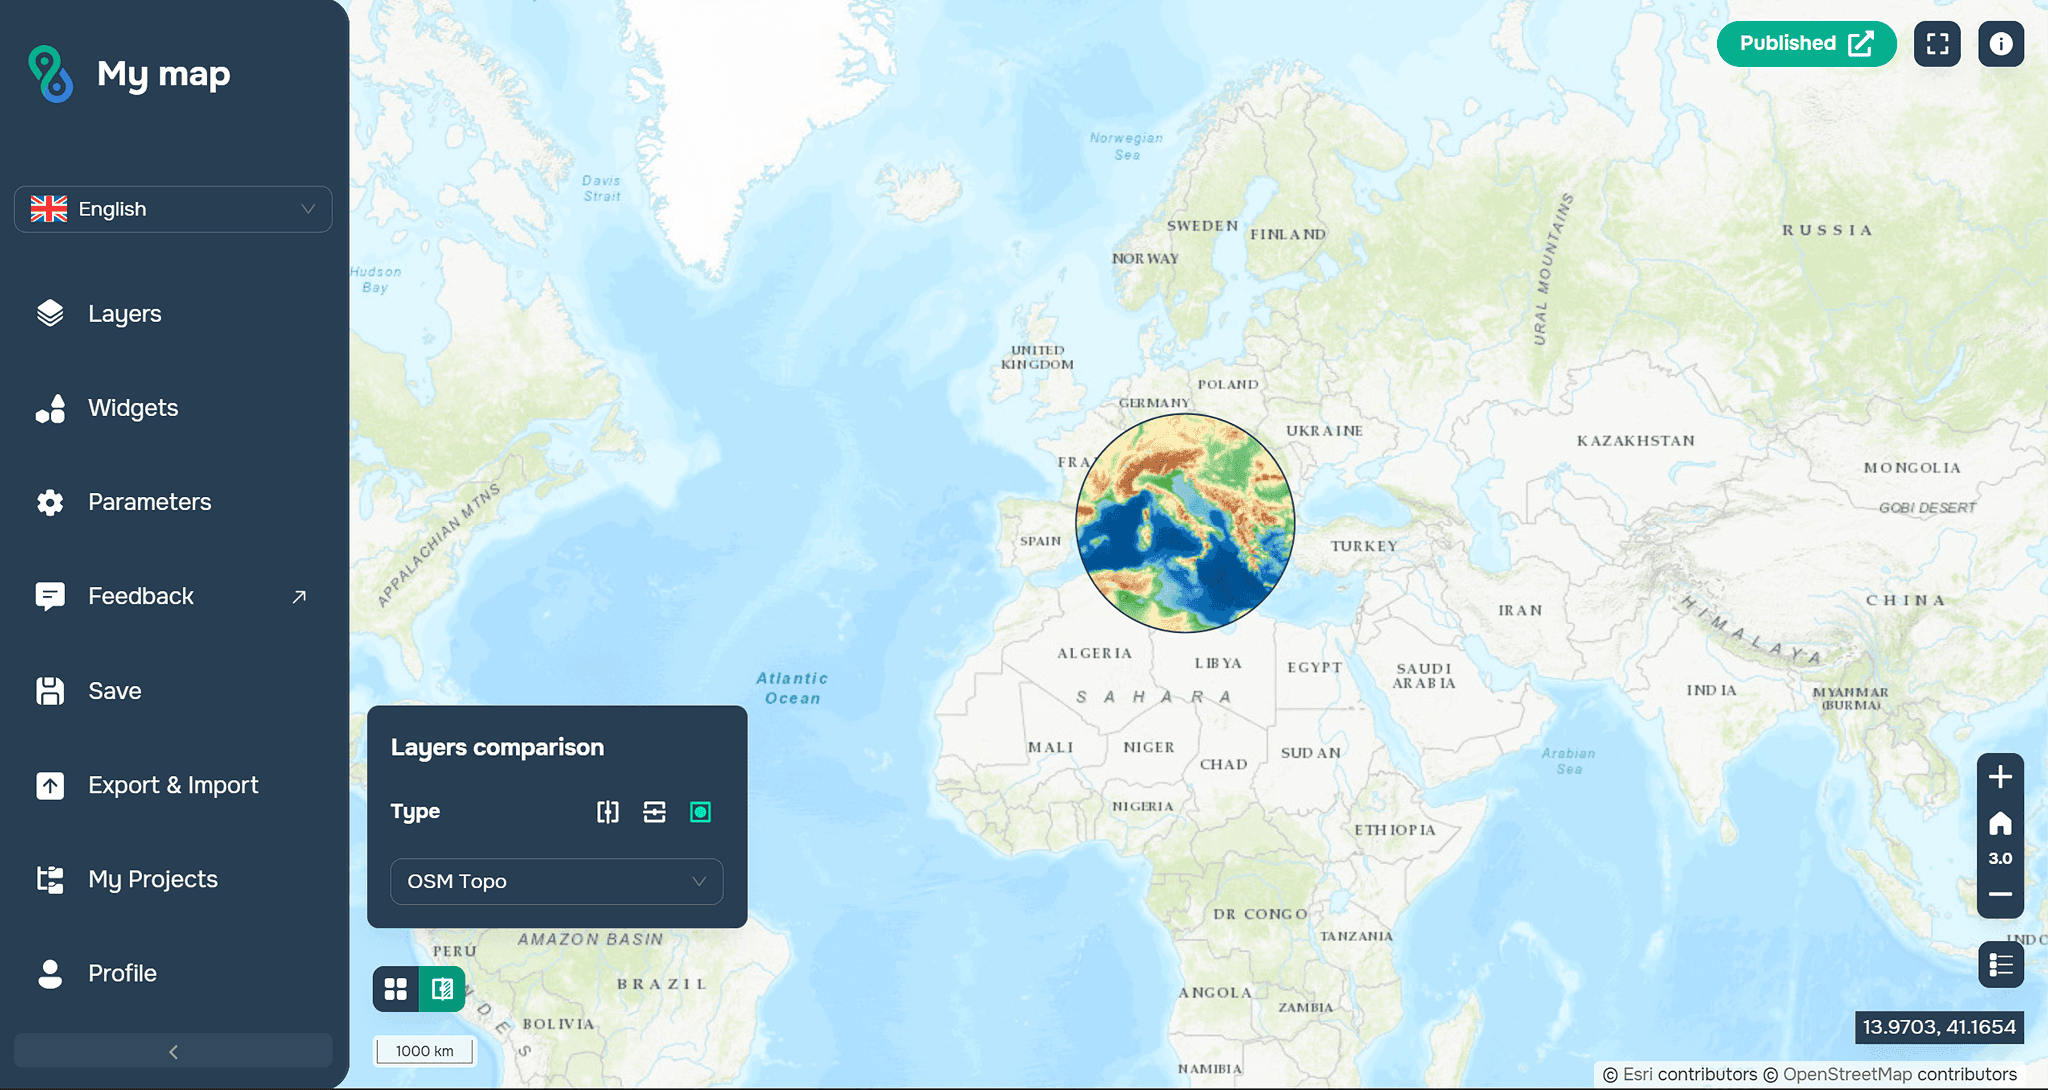
También puede personalizar la visualización de la comparación:
– izquierda/derecha, abajo/arriba.
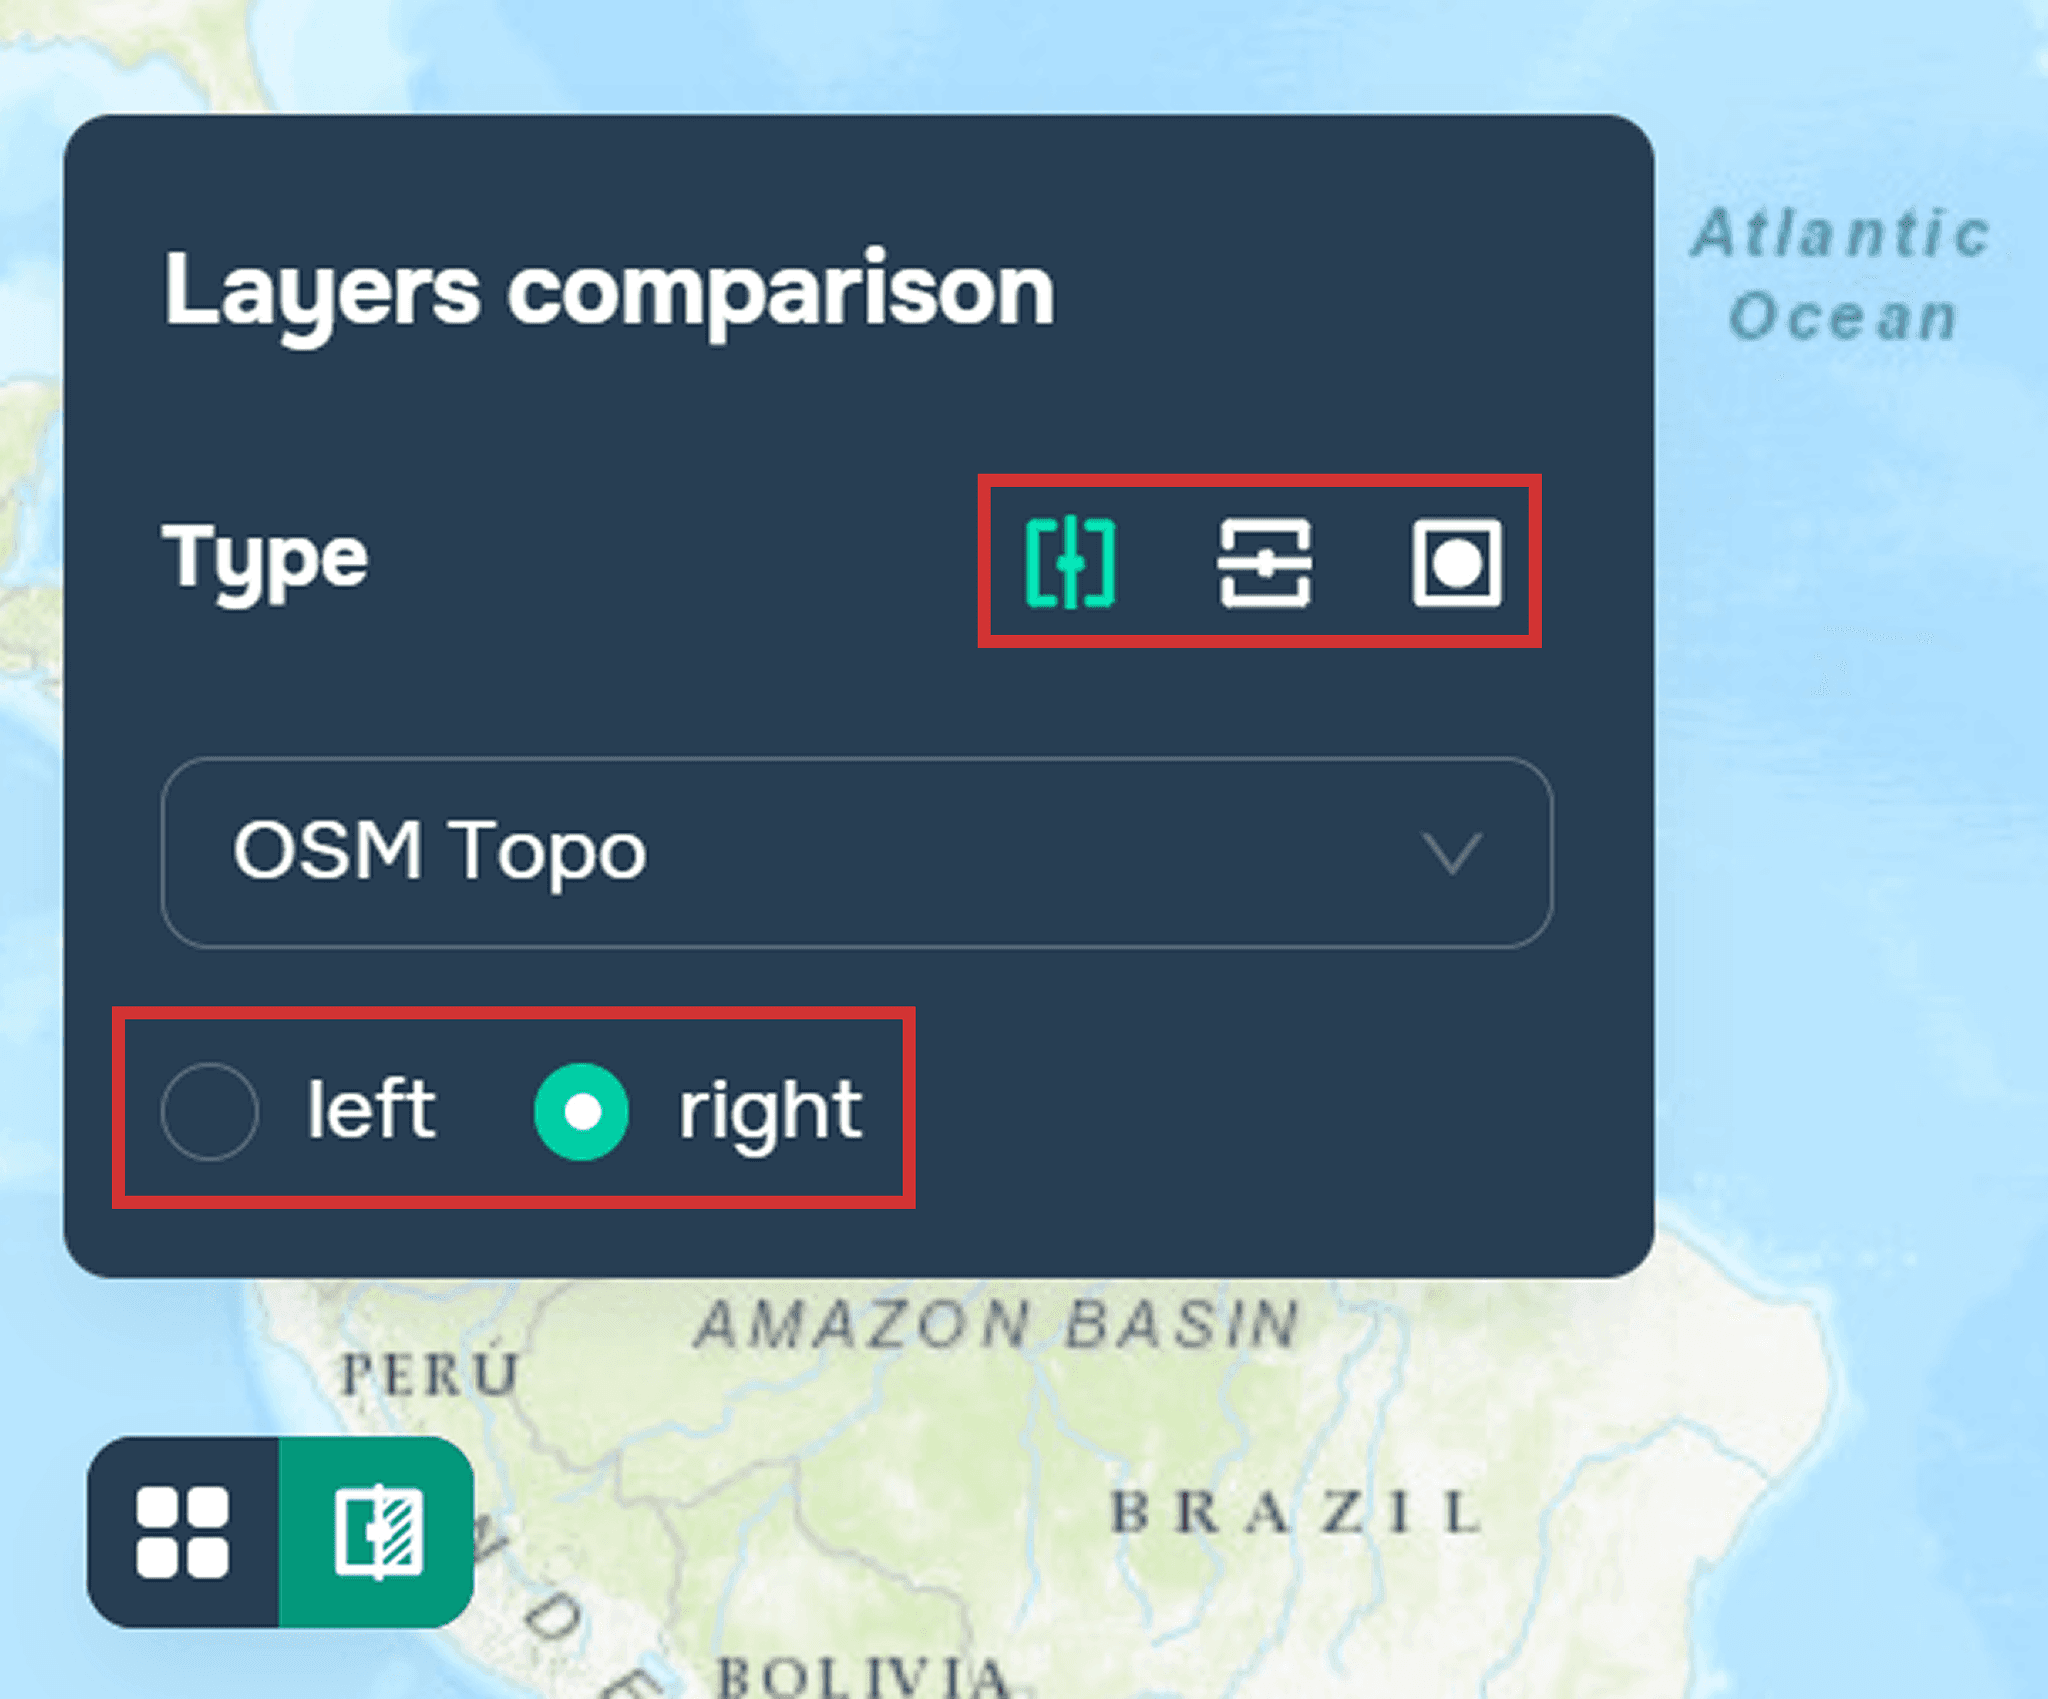
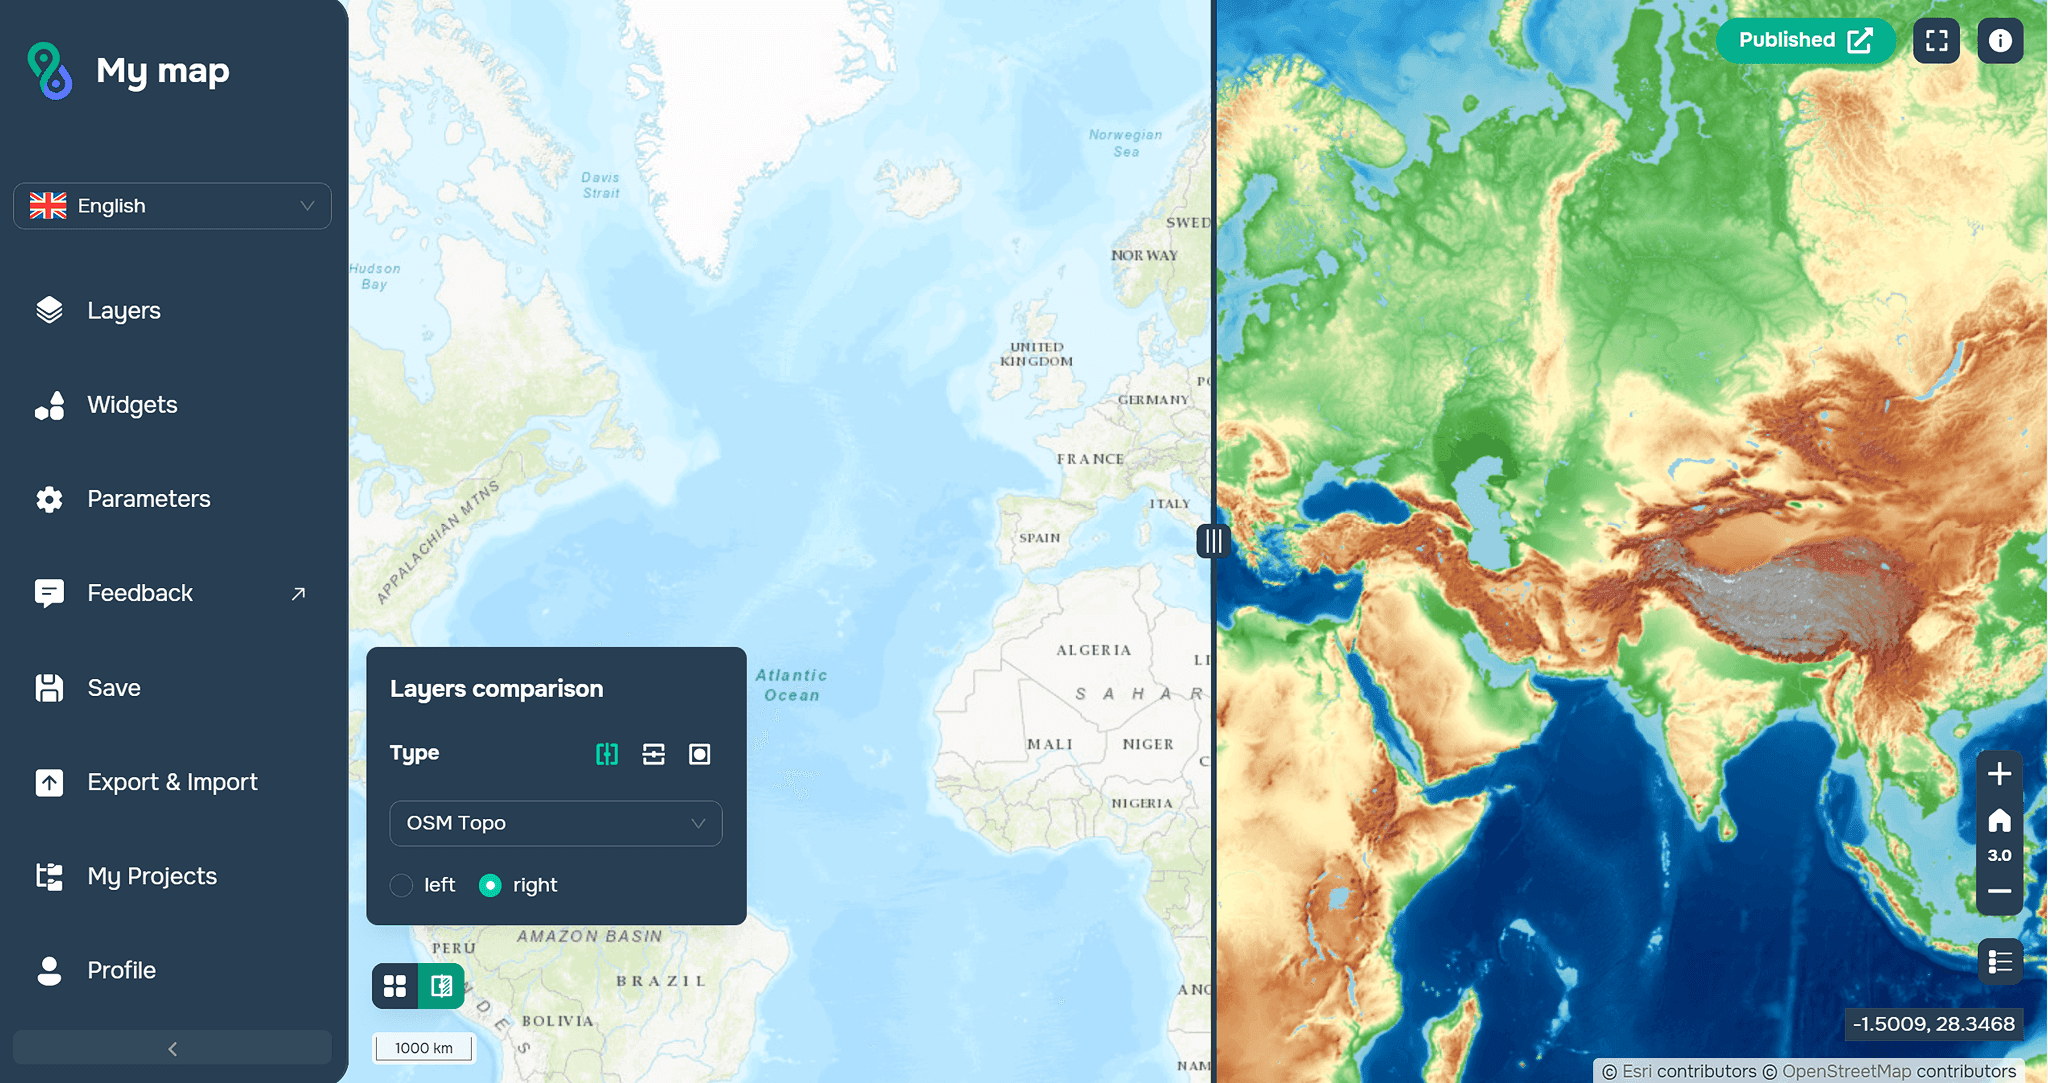
– verticalmente/horizontalmente/a través de una lupa
Preguntas frecuentes
¿Para qué se utiliza el widget de comparación de capas?
Está diseñado para la comparación visual simultánea de dos capas de mapa para identificar cambios y diferencias.
¿Qué tipos de datos se admiten?
El widget funciona tanto con capas ráster (imágenes, modelos, mapas temáticos) como con capas vectoriales (polígonos, límites, contornos).
¿Qué modos de comparación están disponibles en GISCARTA?
Puede personalizar la dirección (izquierda/derecha, arriba/abajo) y el formato de visualización (vertical, horizontal o mediante una lupa).
Conclusiones clave
El widget de comparación de capas proporciona una forma visual y rápida de identificar diferencias espaciales entre capas.
Esta herramienta se utiliza ampliamente en el monitoreo de cambios territoriales, el análisis ambiental y la planificación urbana.
La configuración flexible de visualización en GISCARTA le permite adaptar el modo de comparación a tareas analíticas específicas.


