
En las últimas décadas, el cambio climático se ha convertido en un tema global clave. El aumento de las temperaturas medias, la mayor frecuencia de fenómenos meteorológicos extremos y la transformación de los ecosistemas naturales requieren el análisis sistemático de grandes conjuntos de datos. En el núcleo de este análisis están los datos climáticos: observaciones estandarizadas y de largo plazo de la atmósfera, los océanos y la tierra.
El desarrollo de programas internacionales de monitoreo y de plataformas científicas abiertas ha hecho que la información climática sea accesible para investigadores, agencias gubernamentales y empresas de todo el mundo.
¿Qué son los datos climáticos?
Los datos climáticos son observaciones sistemáticas y de largo plazo de los procesos atmosféricos e hidrológicos. A diferencia de los datos meteorológicos, que describen el estado actual de la atmósfera, el clima describe parámetros estadísticos estables durante un largo período (normalmente al menos 30 años). Este estándar está establecido por la Organización Meteorológica Mundial. Las variables climáticas clave incluyen:
temperatura del aire
precipitación
presión atmosférica
humedad
velocidad y dirección del viento
radiación solar
concentraciones de gases de efecto invernadero
Estos indicadores se utilizan para calcular normales climáticas, evaluar tendencias y construir modelos climáticos.
Tipos de datos climáticos
Fuentes globales
Los conjuntos de datos globales cubren toda la Tierra y se utilizan para analizar procesos climáticos planetarios, realizar comparaciones intercontinentales y construir escenarios de cambio climático.
ERA5 (Servicio de Cambio Climático de Copernicus)
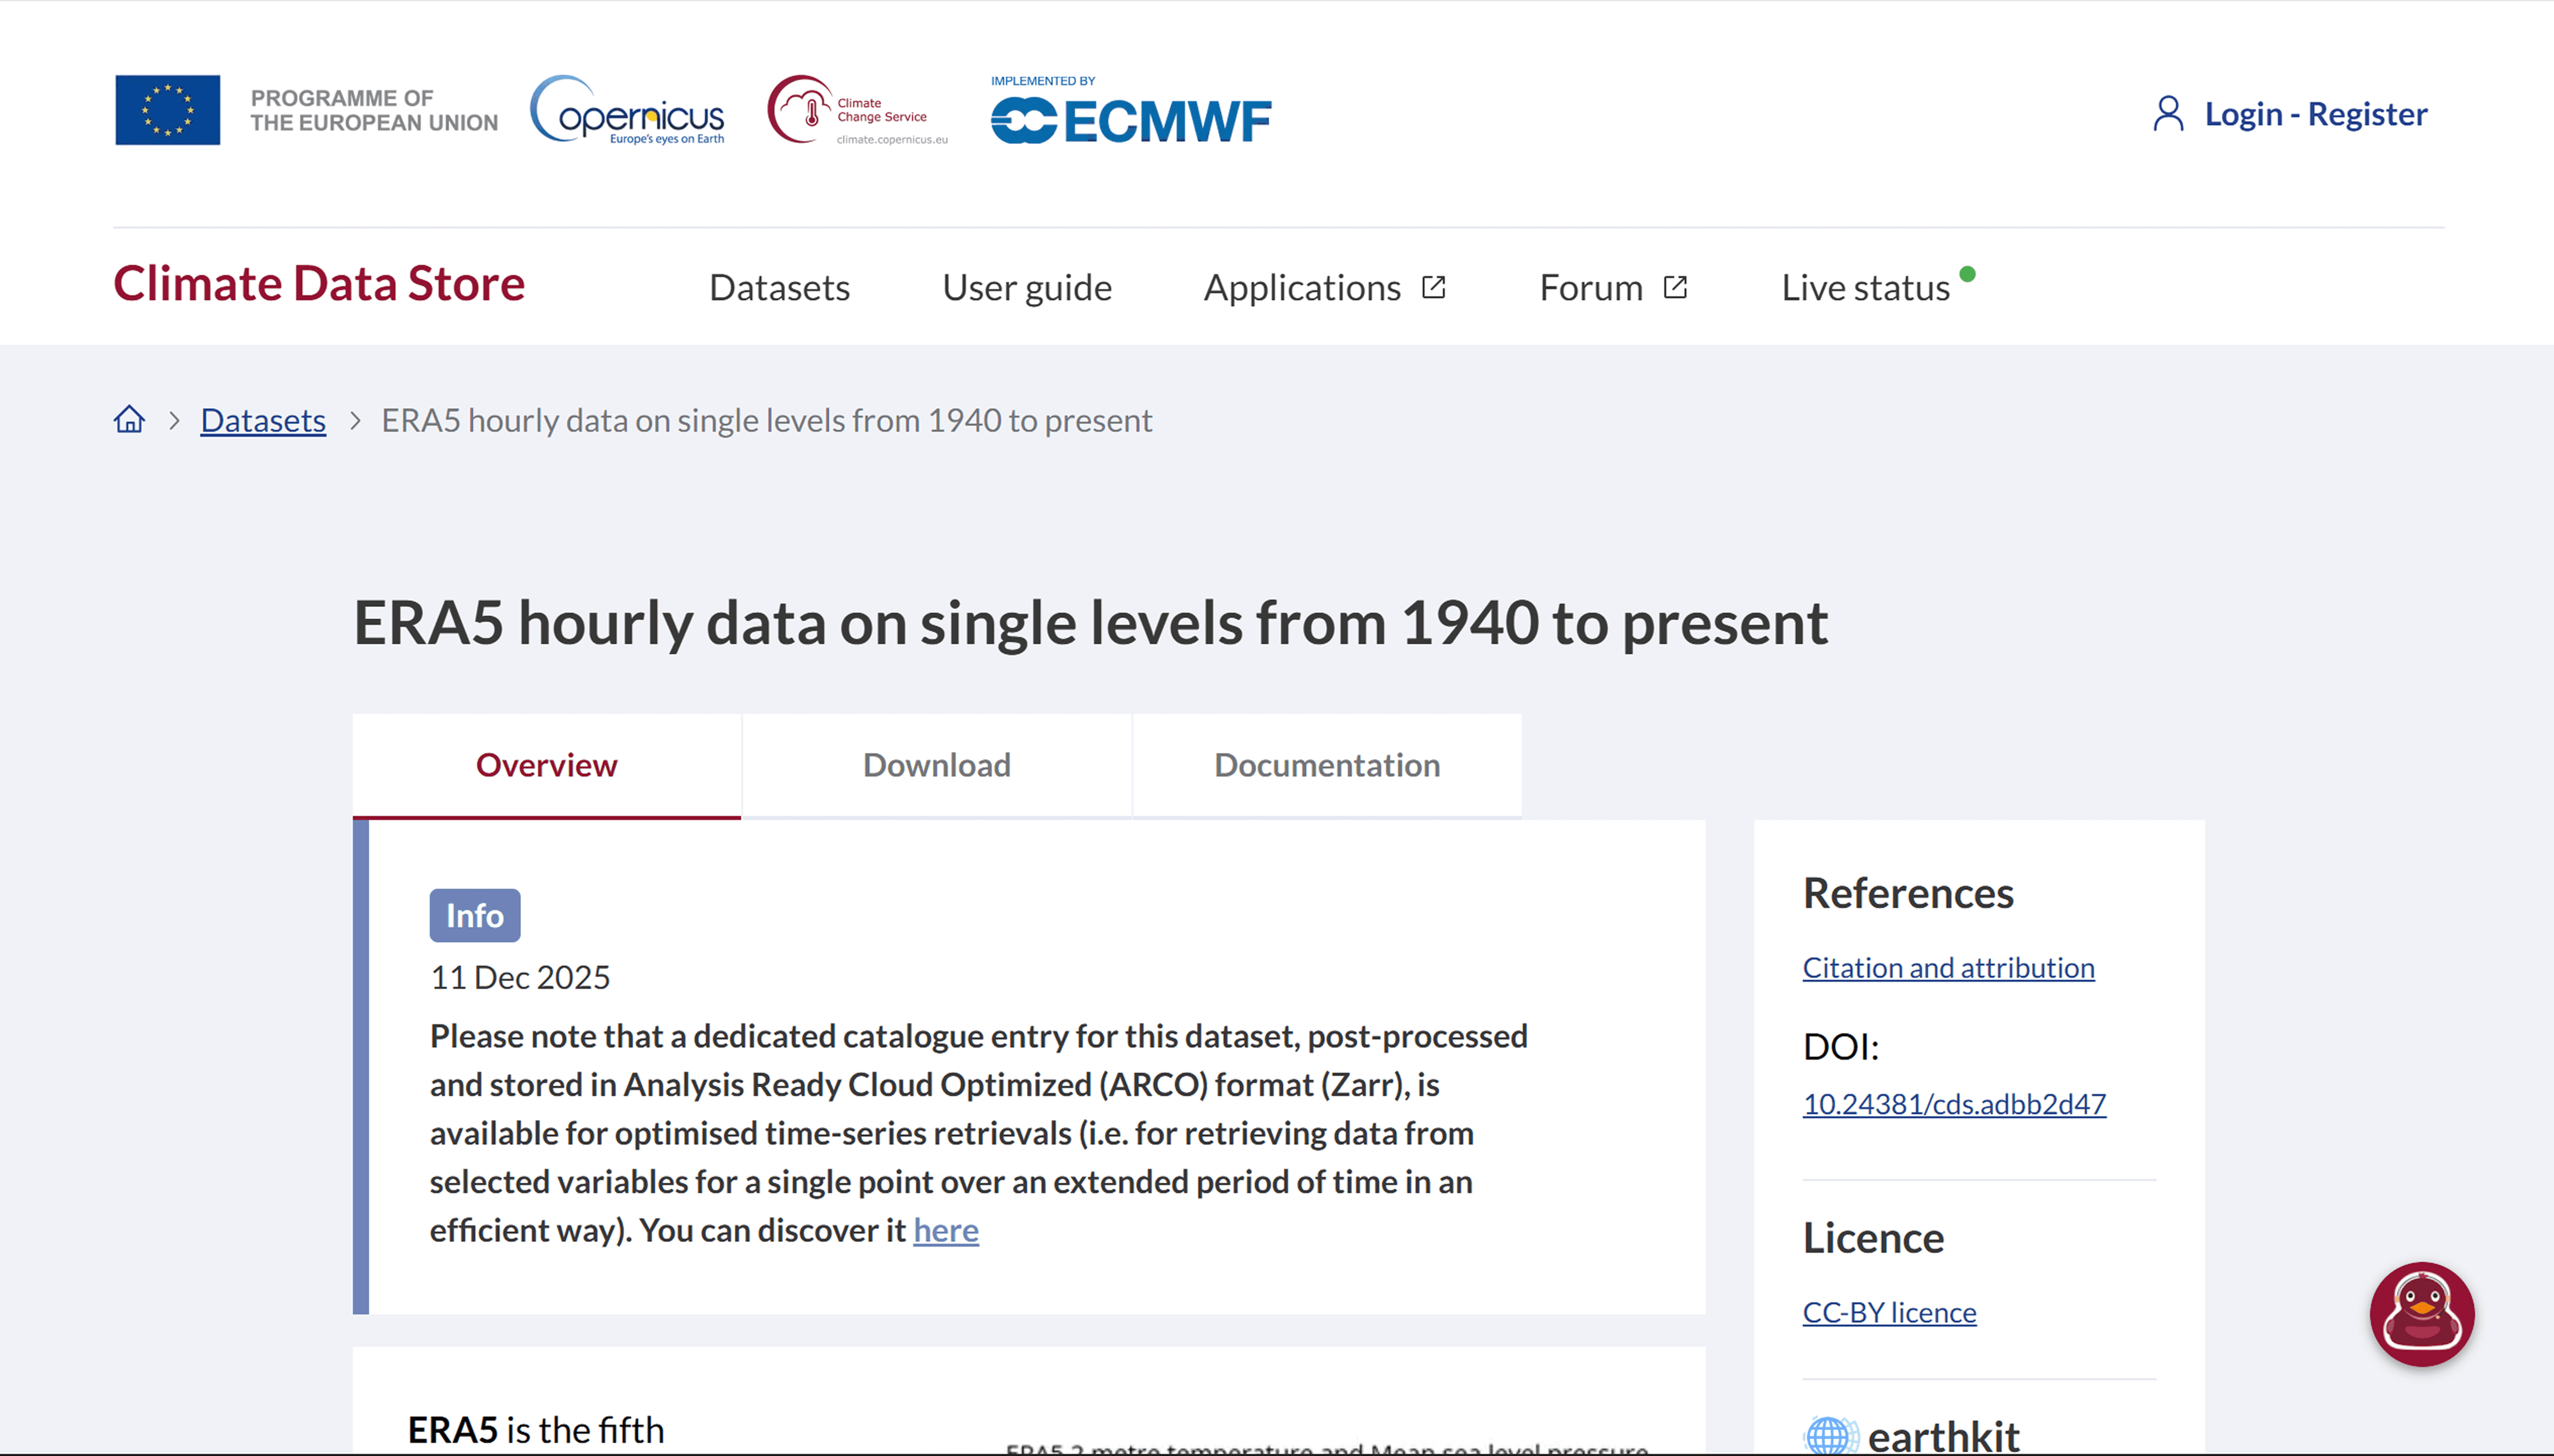
Página de descripción general del conjunto de datos ERA5 que muestra las variables atmosféricas disponibles, la cobertura temporal y las herramientas para acceder a datos globales de reanálisis.
Reanálisis atmosférico global con una resolución de hasta 0.1° (~10 km). Proporciona series temporales continuas desde mediados del siglo XX. Se utiliza para:
– analizar tendencias globales de temperatura y precipitación;
– evaluar eventos extremos;
– modelización climática;
– cálculos sectoriales (energía, transporte, agricultura).
Global Historical Climatology Network (Administración Nacional Oceánica y Atmosférica)
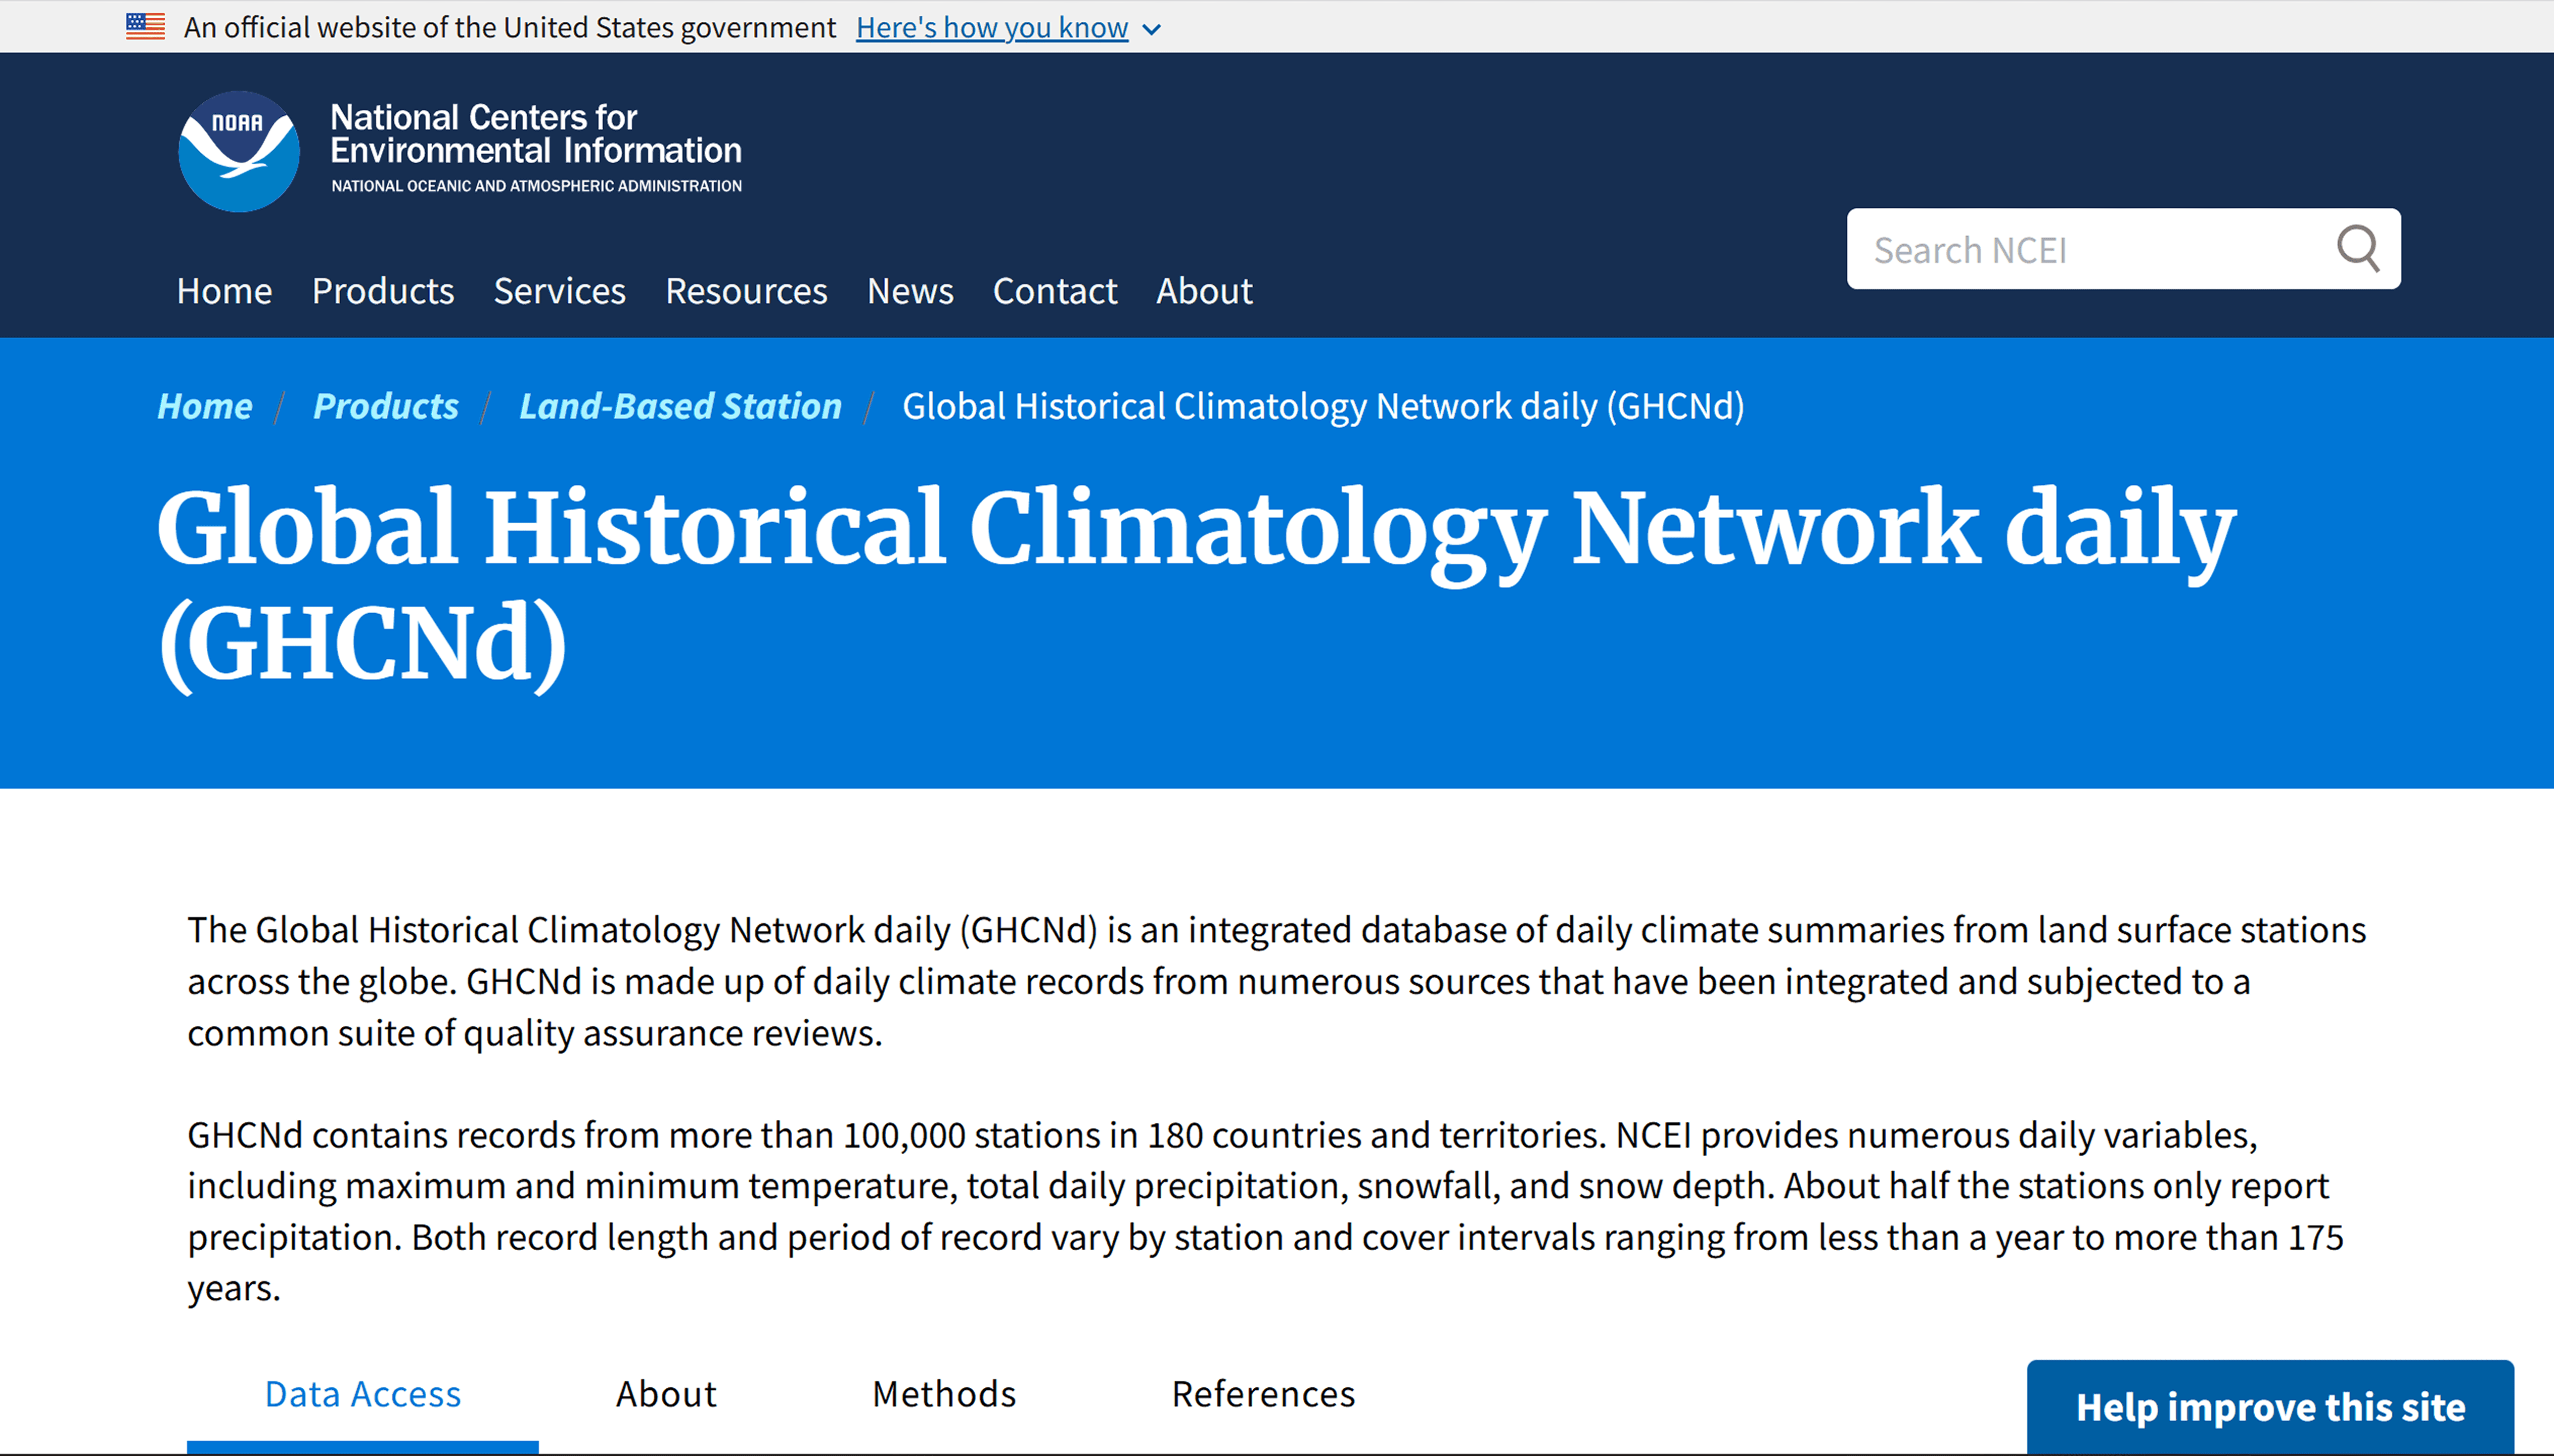
Página de acceso a datos para observaciones diarias globales de estaciones, incluida la descripción del conjunto de datos, formatos y opciones de descarga.
Una red global de estaciones meteorológicas terrestres con observaciones históricas y actuales. Se utiliza para análisis de series temporales, cálculo de normas climáticas y estimación de la frecuencia de eventos extremos.
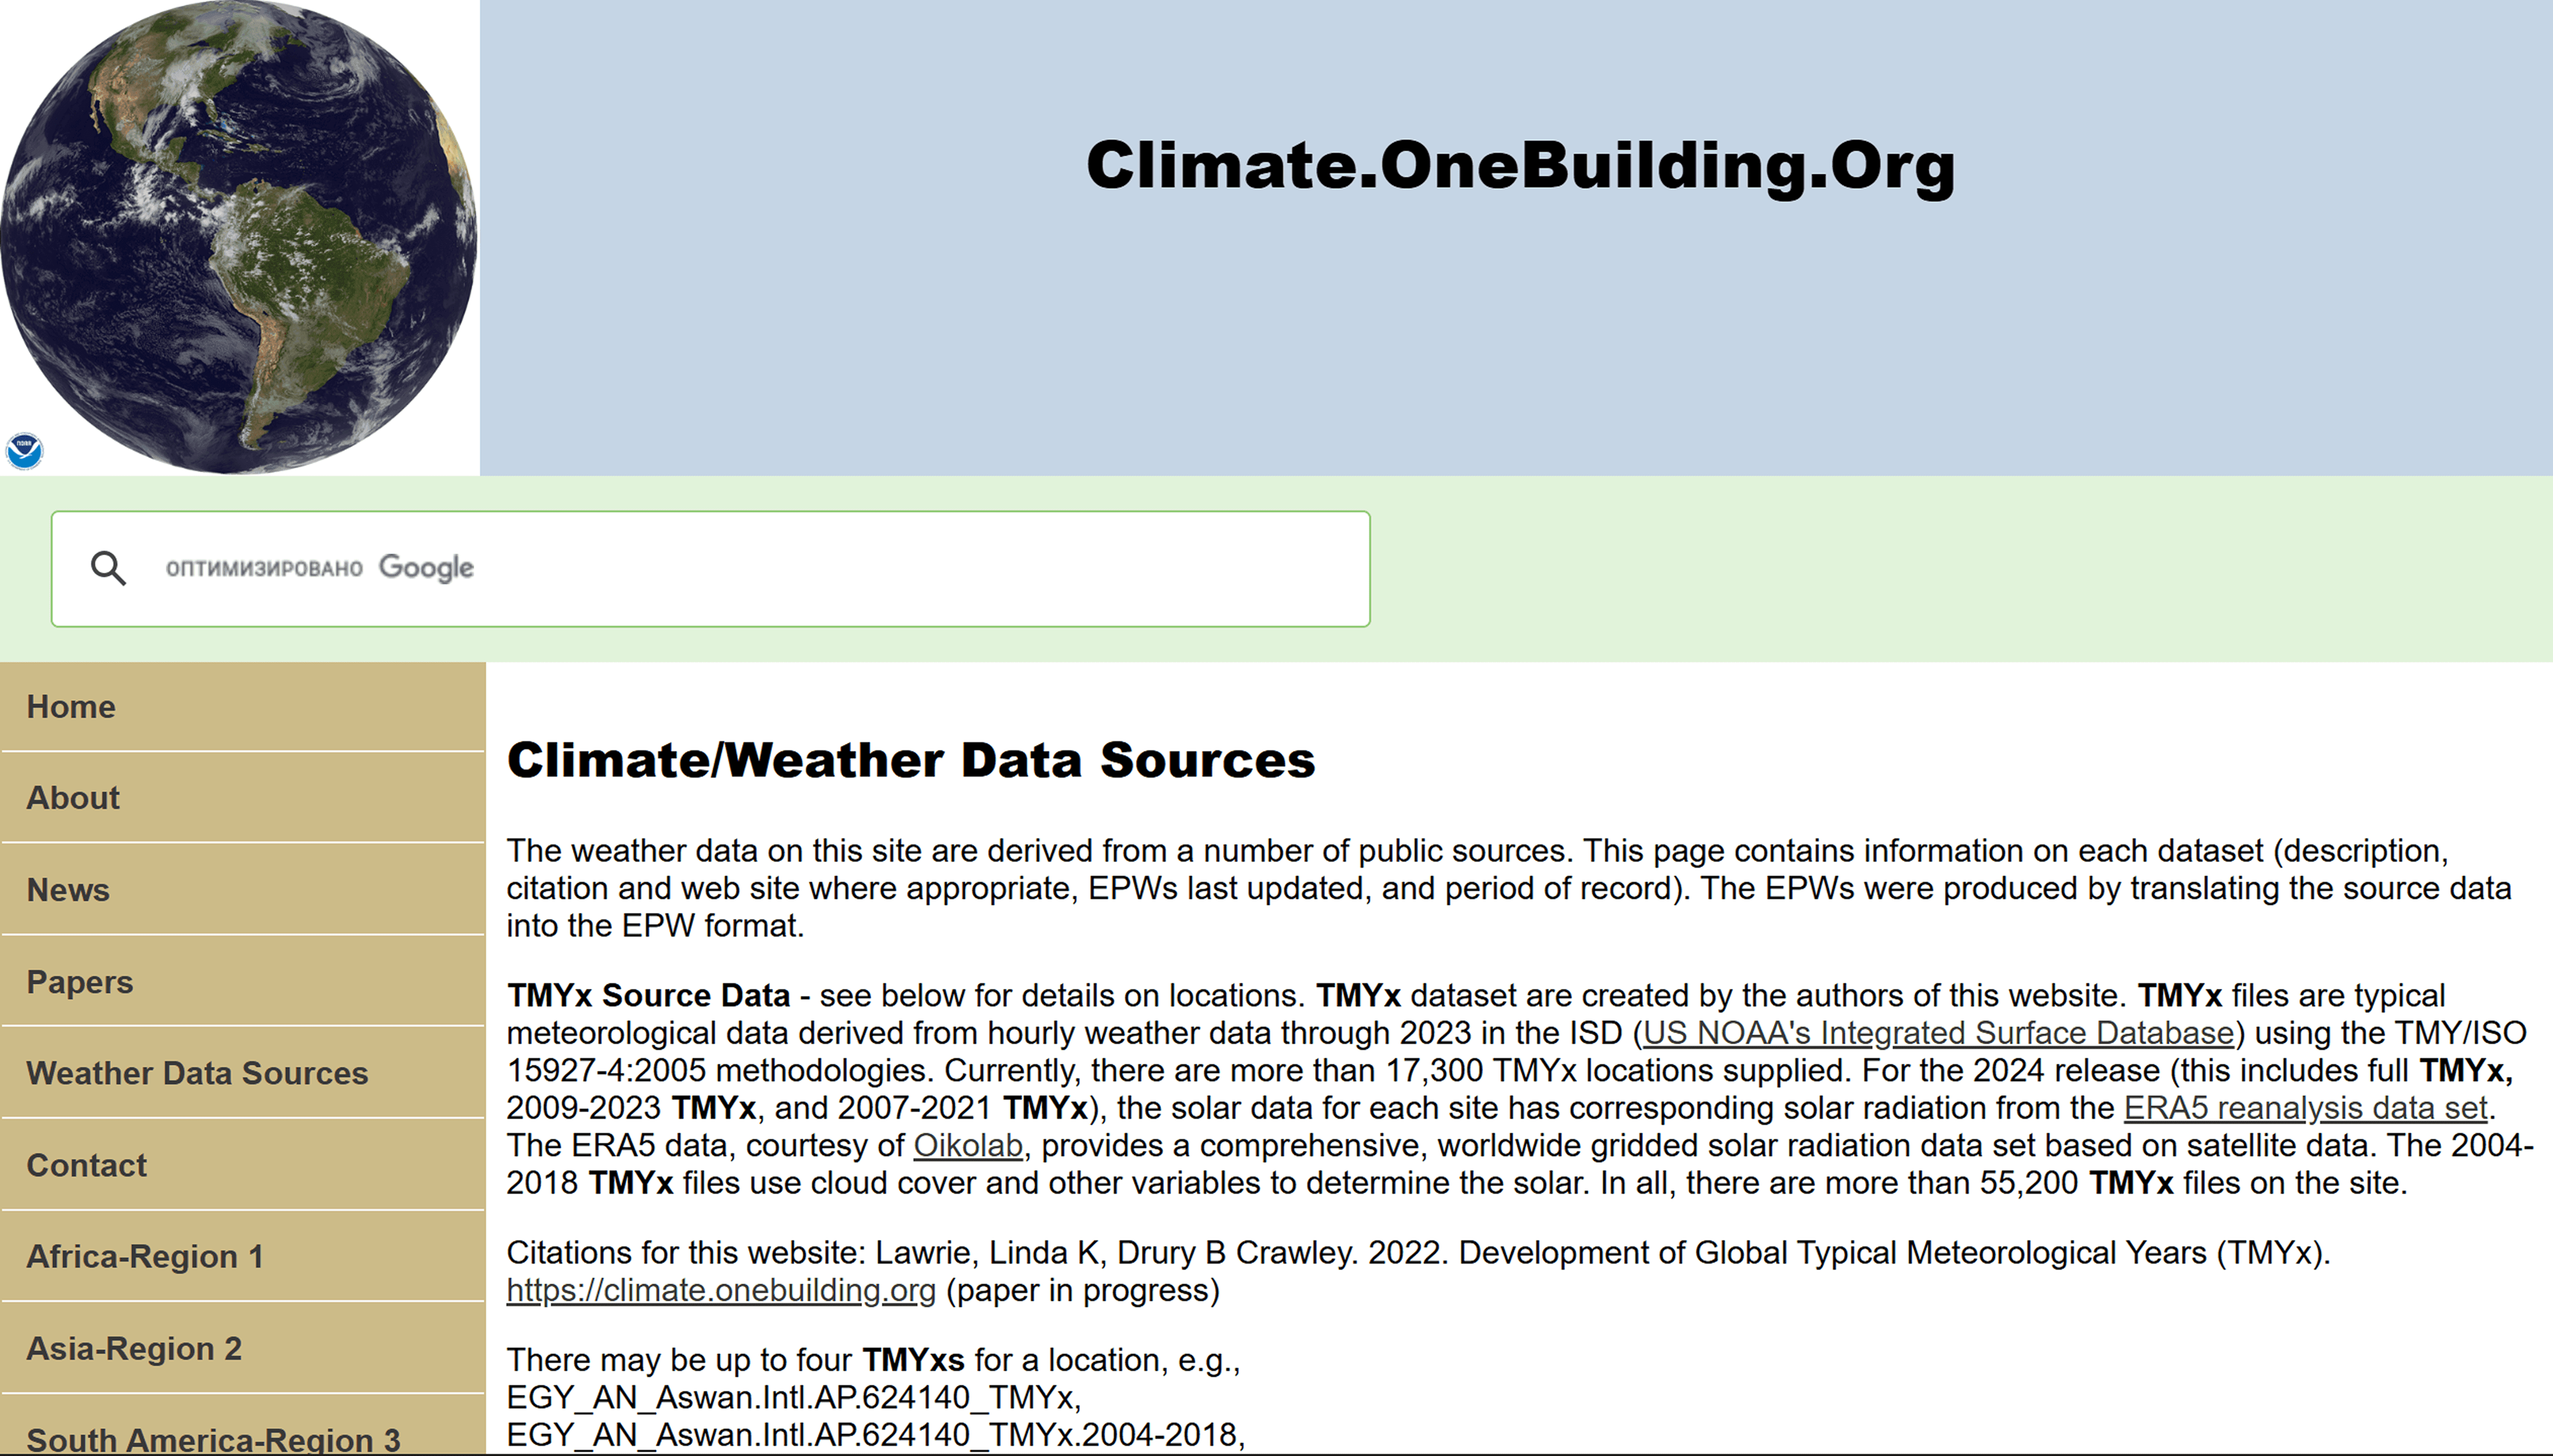
Interfaz del repositorio que lista archivos meteorológicos TMYx y datos climáticos descargables para miles de ubicaciones en todo el mundo.
El Repositorio Internacional de Datos del Año Meteorológico Típico (TMYx) cubre más de 17,000 ubicaciones en todo el mundo. Se utiliza en modelización energética y diseño de edificios.
Las fuentes globales garantizan la comparabilidad de los datos entre países y permiten el análisis de procesos climáticos a escala global.
Conjuntos de datos regionales y de alta precisión
Los conjuntos de datos regionales se utilizan para un análisis más detallado a nivel nacional, regional o local. Tienen una mayor resolución espacial y son adecuados para tareas aplicadas.
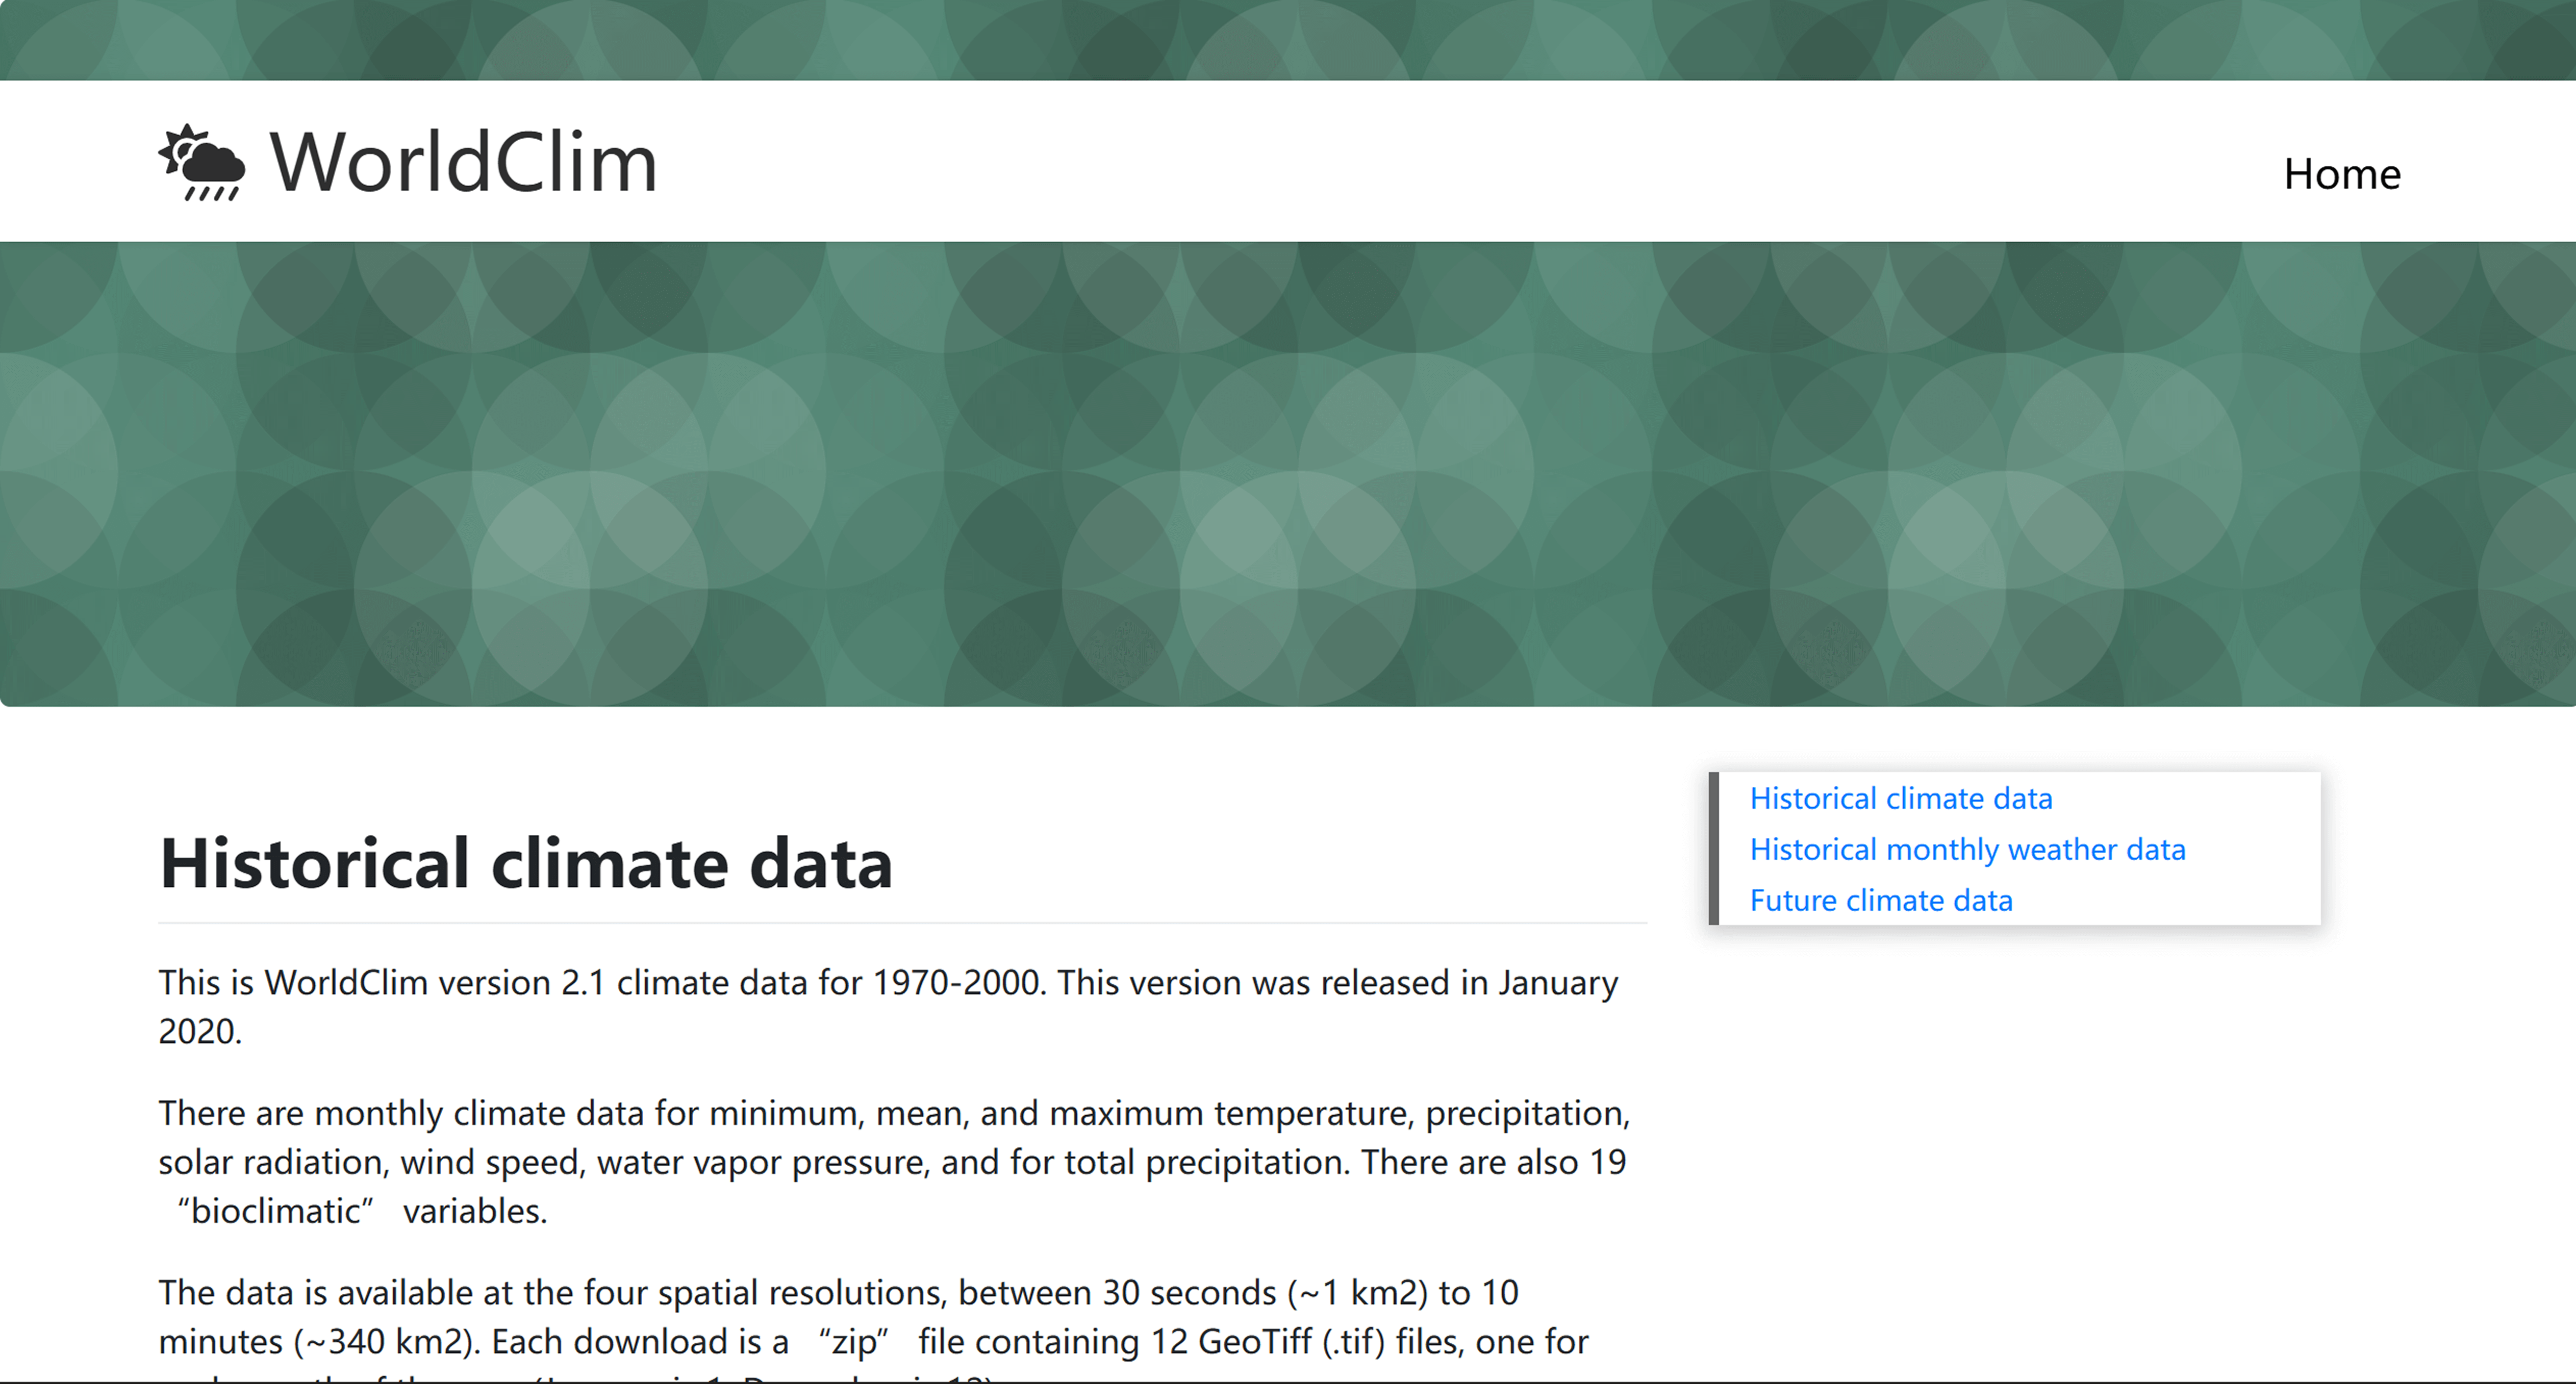
Página de descarga de variables climáticas mensuales globales e índices bioclimáticos con múltiples opciones de resolución espacial.
Un conjunto de variables climáticas medias mensuales para 1970–2000 con una resolución de hasta 30 segundos (~1 km), incluidos índices bioclimáticos (BioClim). Se utiliza en ecología, zonificación agroclimática y modelización de distribución de especies.
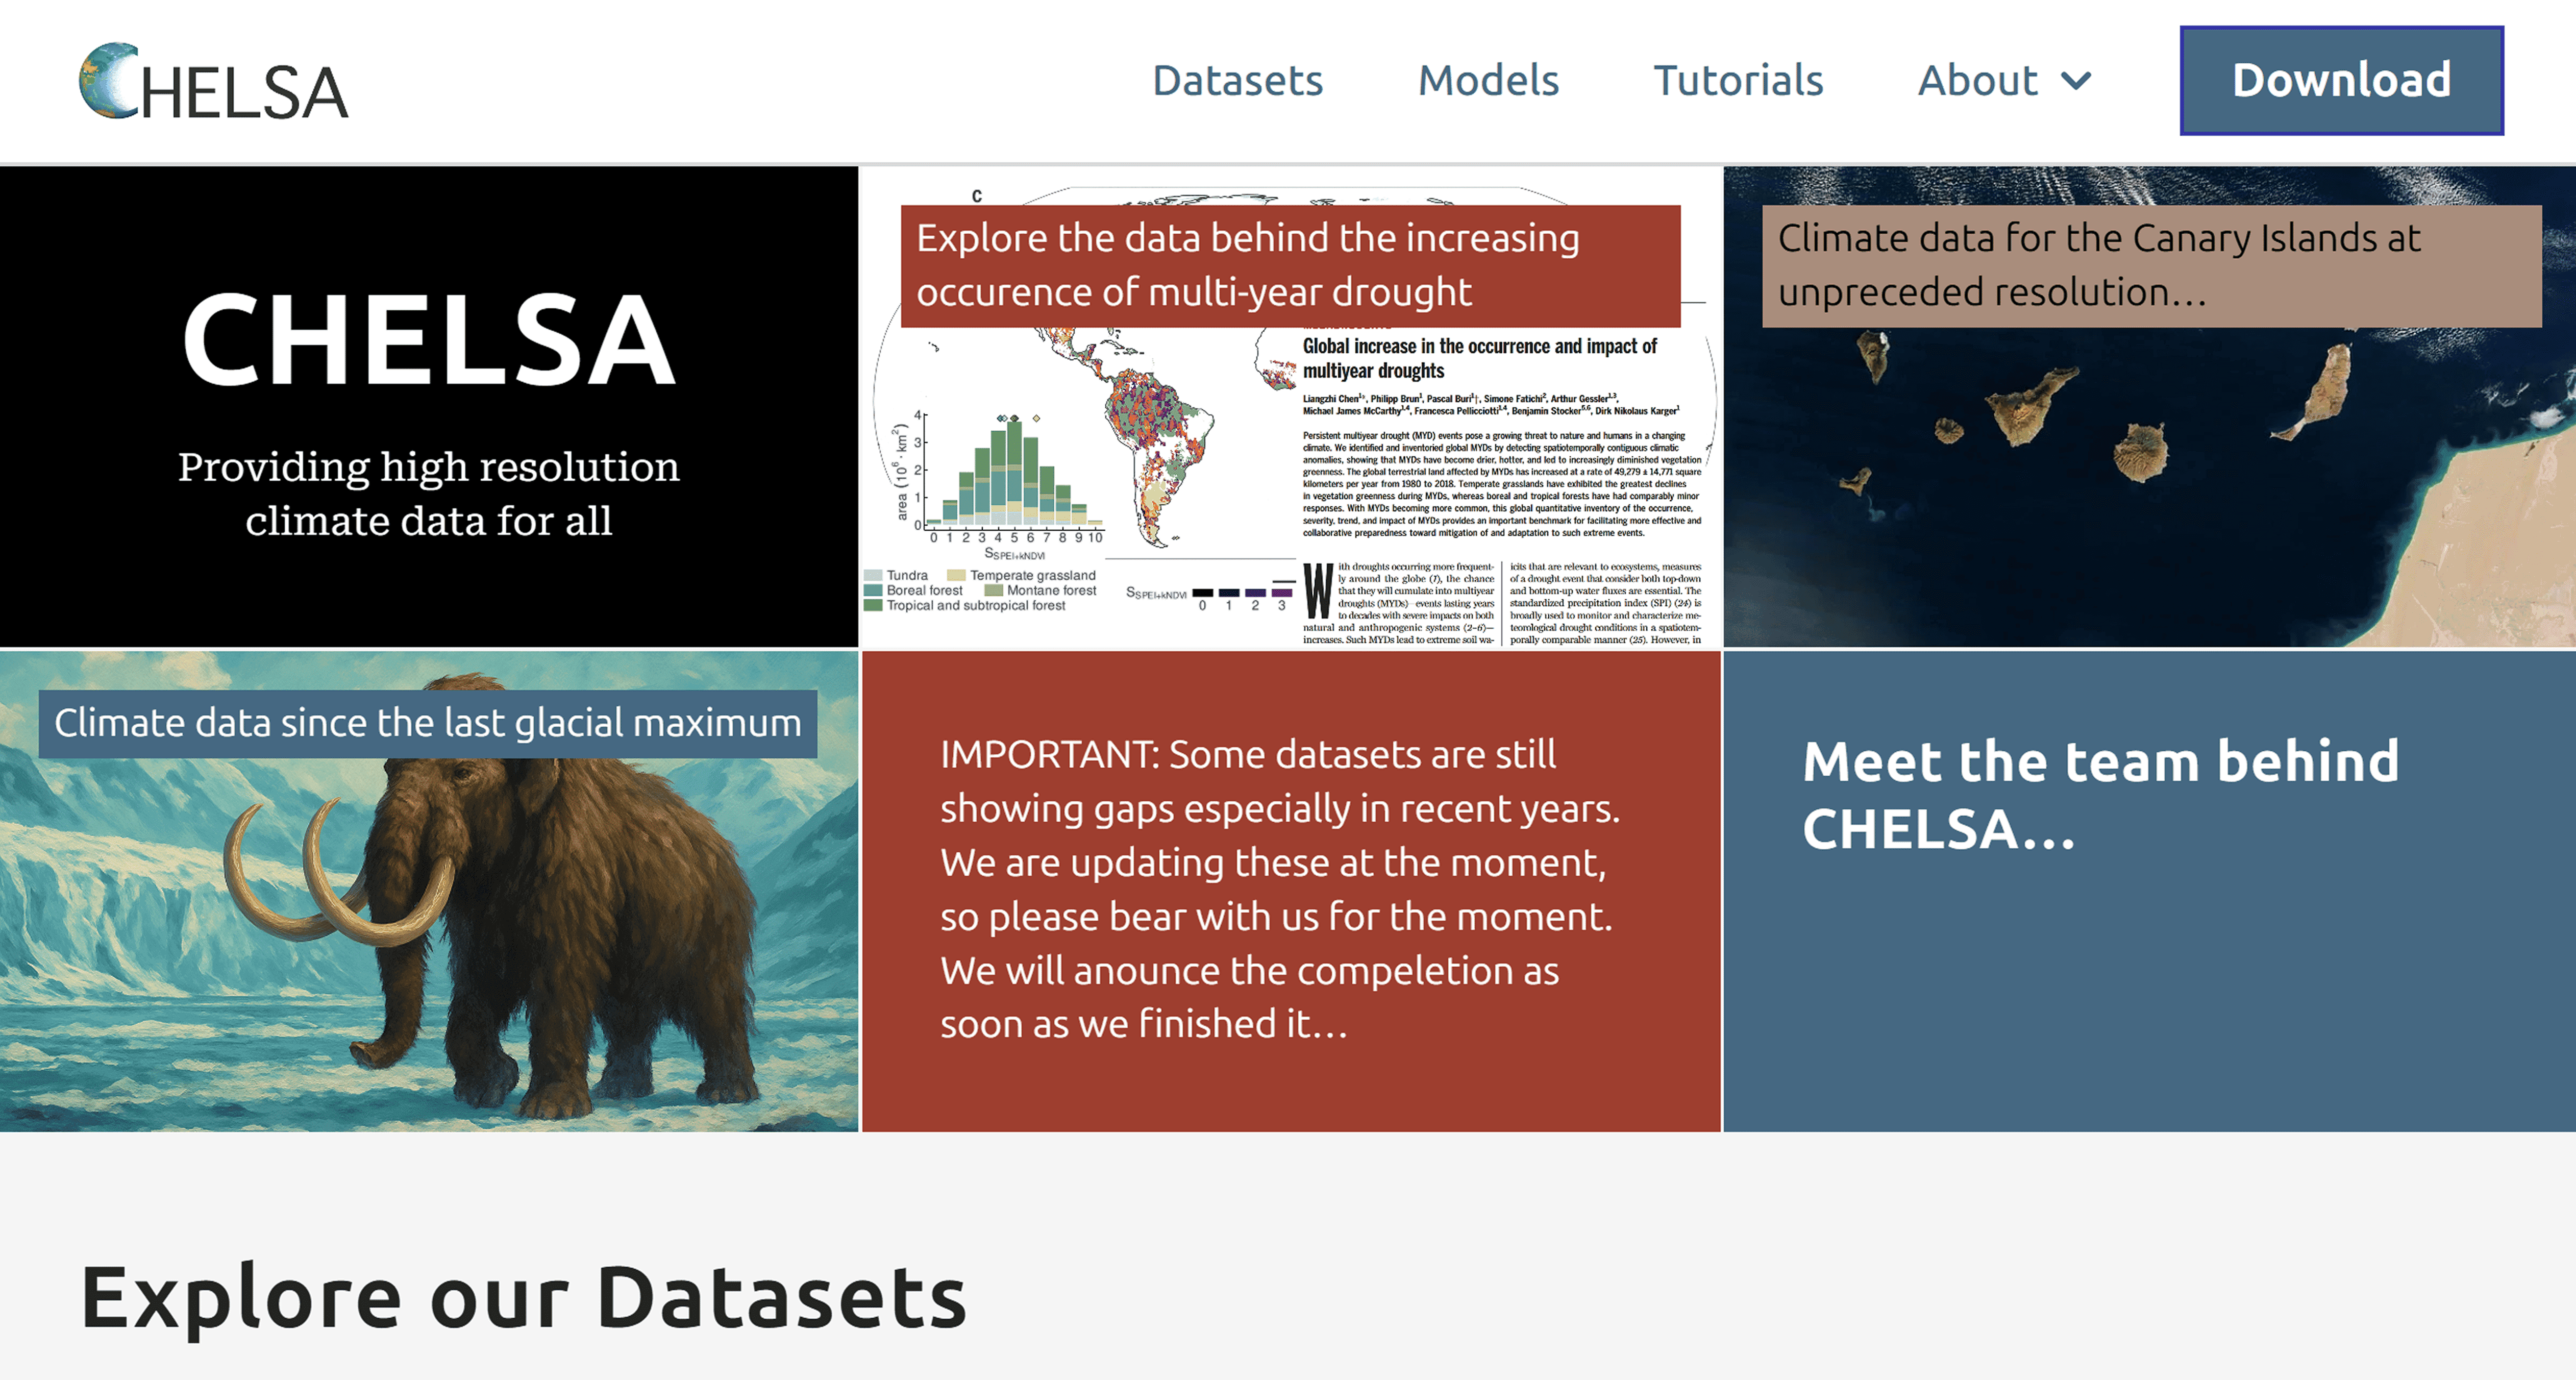
Página de acceso a capas climáticas de alta resolución y variables bioclimáticas derivadas, incluida la documentación del conjunto de datos y detalles de cobertura.
Datos climáticos para 1979–2013 con una resolución de 30 segundos (~1 km). Proporciona una representación más precisa de la distribución de la precipitación, especialmente en regiones montañosas. Se utiliza para la evaluación del riesgo climático, el análisis de biodiversidad y la planificación territorial.
Las fuentes regionales también incluyen catálogos de estaciones meteorológicas y estaciones hidrológicas de aforo, presentados como datos vectoriales con información de atributos (coordenadas, períodos de operación, características).
Formatos de datos climáticos
La información climática puede existir en varios formatos:
– Rásteres (GeoTIFF, NetCDF, GRIB): para modelos espaciales
– Datos vectoriales (catálogos de estaciones y puntos de observación)
– Formatos tabulares (CSV, TXT): para series temporales
– Formatos energéticos especializados (EPW, TMY)
La elección del formato depende de la tarea: análisis científico, cartografía o modelización de ingeniería.
Tabla comparativa de fuentes de datos climáticos
Fuente | Tipo de datos | Resolución espacial | Cobertura temporal | Formato | Aplicación principal |
ERA5 (C3S) | Reanálisis climático global | hasta 0.1° (~10 km) | 1940 – presente | NetCDF, GRIB (rásteres) | Modelización climática, análisis de tendencias, evaluaciones sectoriales |
WorldClim | Reanálisis de downscaling + BioClim | hasta 30″ (~1 km) | 1970–2000 | GeoTIFF (rásteres) | Ecología, modelización de distribución de especies, análisis agroclimático |
CHELSA | Reanálisis de downscaling + BioClim | 30″ (~1 km) | 1979–2013 | GeoTIFF (rásteres) | Regiones montañosas, precipitación, biogeografía |
Global Historical Climatology Network | Observaciones de estaciones meteorológicas | Datos puntuales | siglo XIX – presente (según la estación) | Tablas (CSV) | Análisis de series temporales, eventos extremos |
Climate OneBuilding | Año meteorológico típico (TMYx) | Datos puntuales | Año típico (muestra estadística) | EPW, CSV | Modelización energética, diseño de edificios |
Preguntas frecuentes
¿Cuál es la diferencia entre clima y tiempo?
El tiempo describe condiciones de corto plazo, mientras que el clima describe características estadísticas durante un largo período (normalmente ≥30 años según la Organización Meteorológica Mundial).
¿Qué datos debo elegir: globales o regionales?
Los reanálisis globales, como ERA5, son adecuados para analizar tendencias globales. Los conjuntos de datos de alta resolución como WorldClim y CHELSA son adecuados para estudios locales.
¿Se pueden usar los datos en proyectos comerciales?
La mayoría de las bases de datos climáticas internacionales están abiertas para uso científico y aplicado, sujetas a licencias y citación adecuada.
Conclusiones clave
Los datos climáticos son la base del análisis científico y la planificación estratégica.
Las fuentes varían en escala: las globales son para tendencias generales, mientras que las regionales son para tareas detalladas.
Las bases de datos internacionales abiertas garantizan la accesibilidad y comparabilidad de la información climática.


