
El papel del geoprocesamiento en el análisis espacial
El geoprocesamiento es un elemento clave para trabajar con datos espaciales en SIG. El geoprocesamiento se refiere a un conjunto de operaciones destinadas a transformar, analizar y combinar entidades geográficas para generar nueva información.
Las herramientas de geoprocesamiento se utilizan cuando es necesario preparar datos para el análisis, identificar áreas de interés, comparar múltiples fuentes de información o identificar patrones espaciales.
Herramientas básicas de geoprocesamiento para trabajar con geometría
Las herramientas básicas de geoprocesamiento incluyen operaciones que modifican o combinan la geometría de las entidades. La herramienta Recortar (Clip) se utiliza para recortar una capa según los límites de otra y se emplea ampliamente para seleccionar datos dentro de un área específica. Restar (Borrar) permite excluir de una capa las áreas que se superponen con otras entidades, lo que resulta útil al analizar zonas de restricción o exclusión.
La herramienta Intersección (Intersect) crea una nueva capa que contiene solo las partes comunes de las entidades que se intersectan, lo que la hace indispensable al analizar coincidencias y superposiciones entre diferentes capas geológicas o temáticas. Fusionar (Merge) se utiliza para combinar múltiples capas del mismo tipo en un único conjunto de datos y es útil cuando se trabaja con fuentes de información dispares.
Para analizar límites y entidades lineales, la herramienta Polígono a línea convierte entidades poligonales en entidades lineales conservando sus límites. Esto es especialmente útil cuando se analizan fallas, contornos de cuerpos geológicos y límites administrativos.
Herramientas de análisis espacial
Un grupo independiente de herramientas analíticas está compuesto por herramientas destinadas a estudiar las relaciones espaciales. La de Área de influencia (Buffer) se utiliza para construir zonas de influencia alrededor de objetos a una distancia determinada y se emplea, por ejemplo, para evaluar la influencia de fallas geológicas, masas de agua o pozos.
Las herramientas de Análisis espacial permiten realizar operaciones más complejas, como analizar la densidad, la intersección, las distancias y las dependencias espaciales entre objetos.
Los Polígonos de Thiessen (polígonos de Voronoi), que se construyen a partir de objetos puntuales y muestran las zonas de influencia inmediata de cada punto, ocupan un lugar especial. En geología, se utilizan para interpolar datos de pozos, analizar la distribución de muestras y evaluar la cobertura espacial de las observaciones.
¿Cómo utilizar el widget de Geoprocesamiento en GISCARTA?
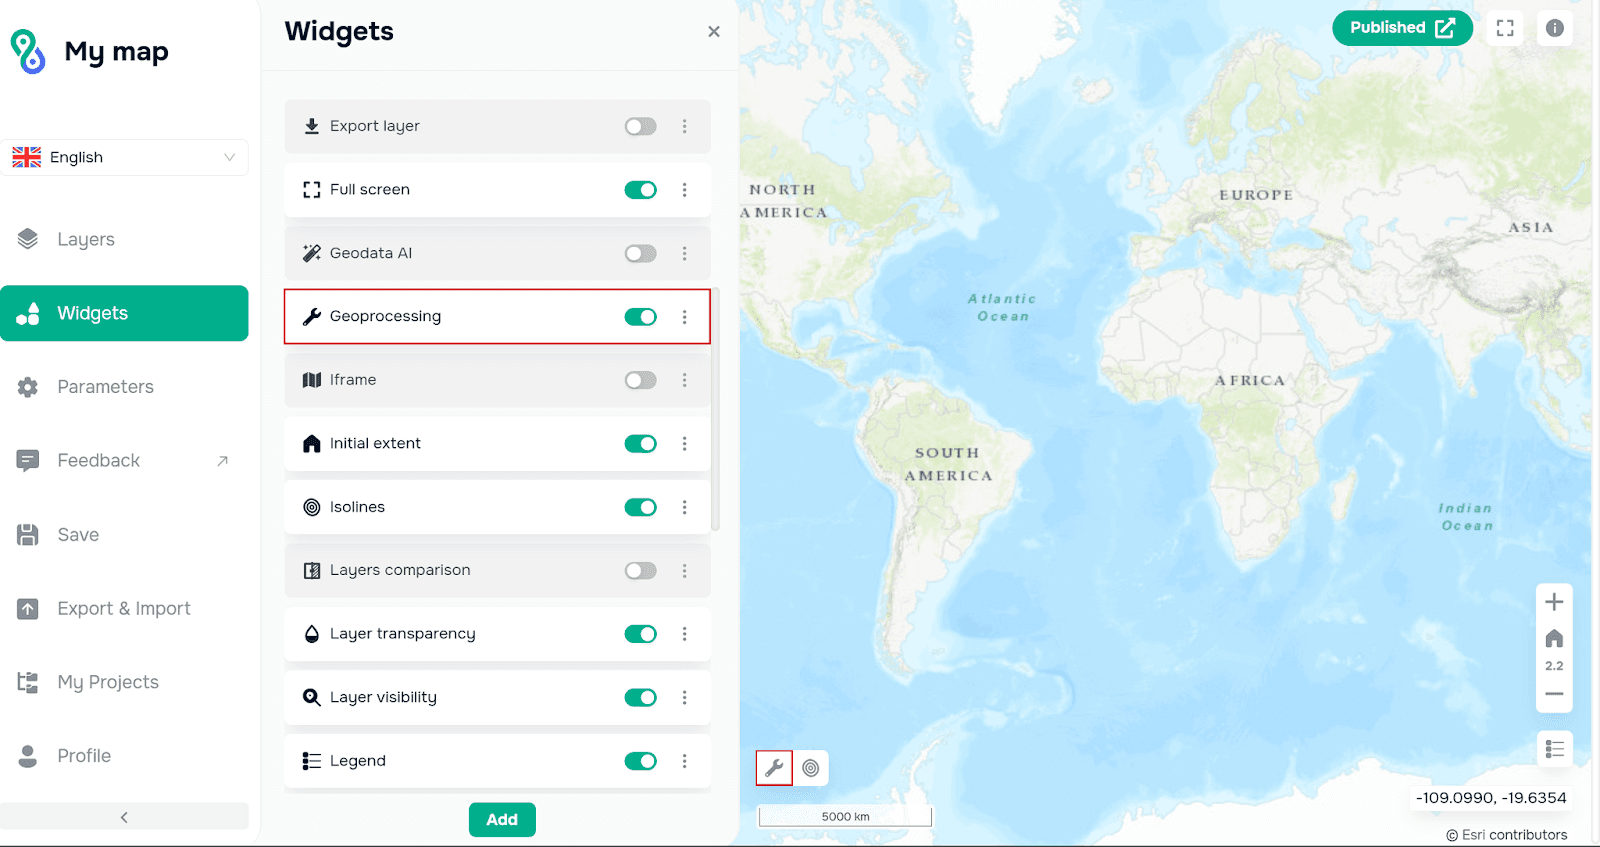
Paso 1. Para comenzar a usar el widget, debe asegurarse de que esté disponible en la barra de herramientas. Para ello, actívelo en la sección Widgets mediante el interruptor.
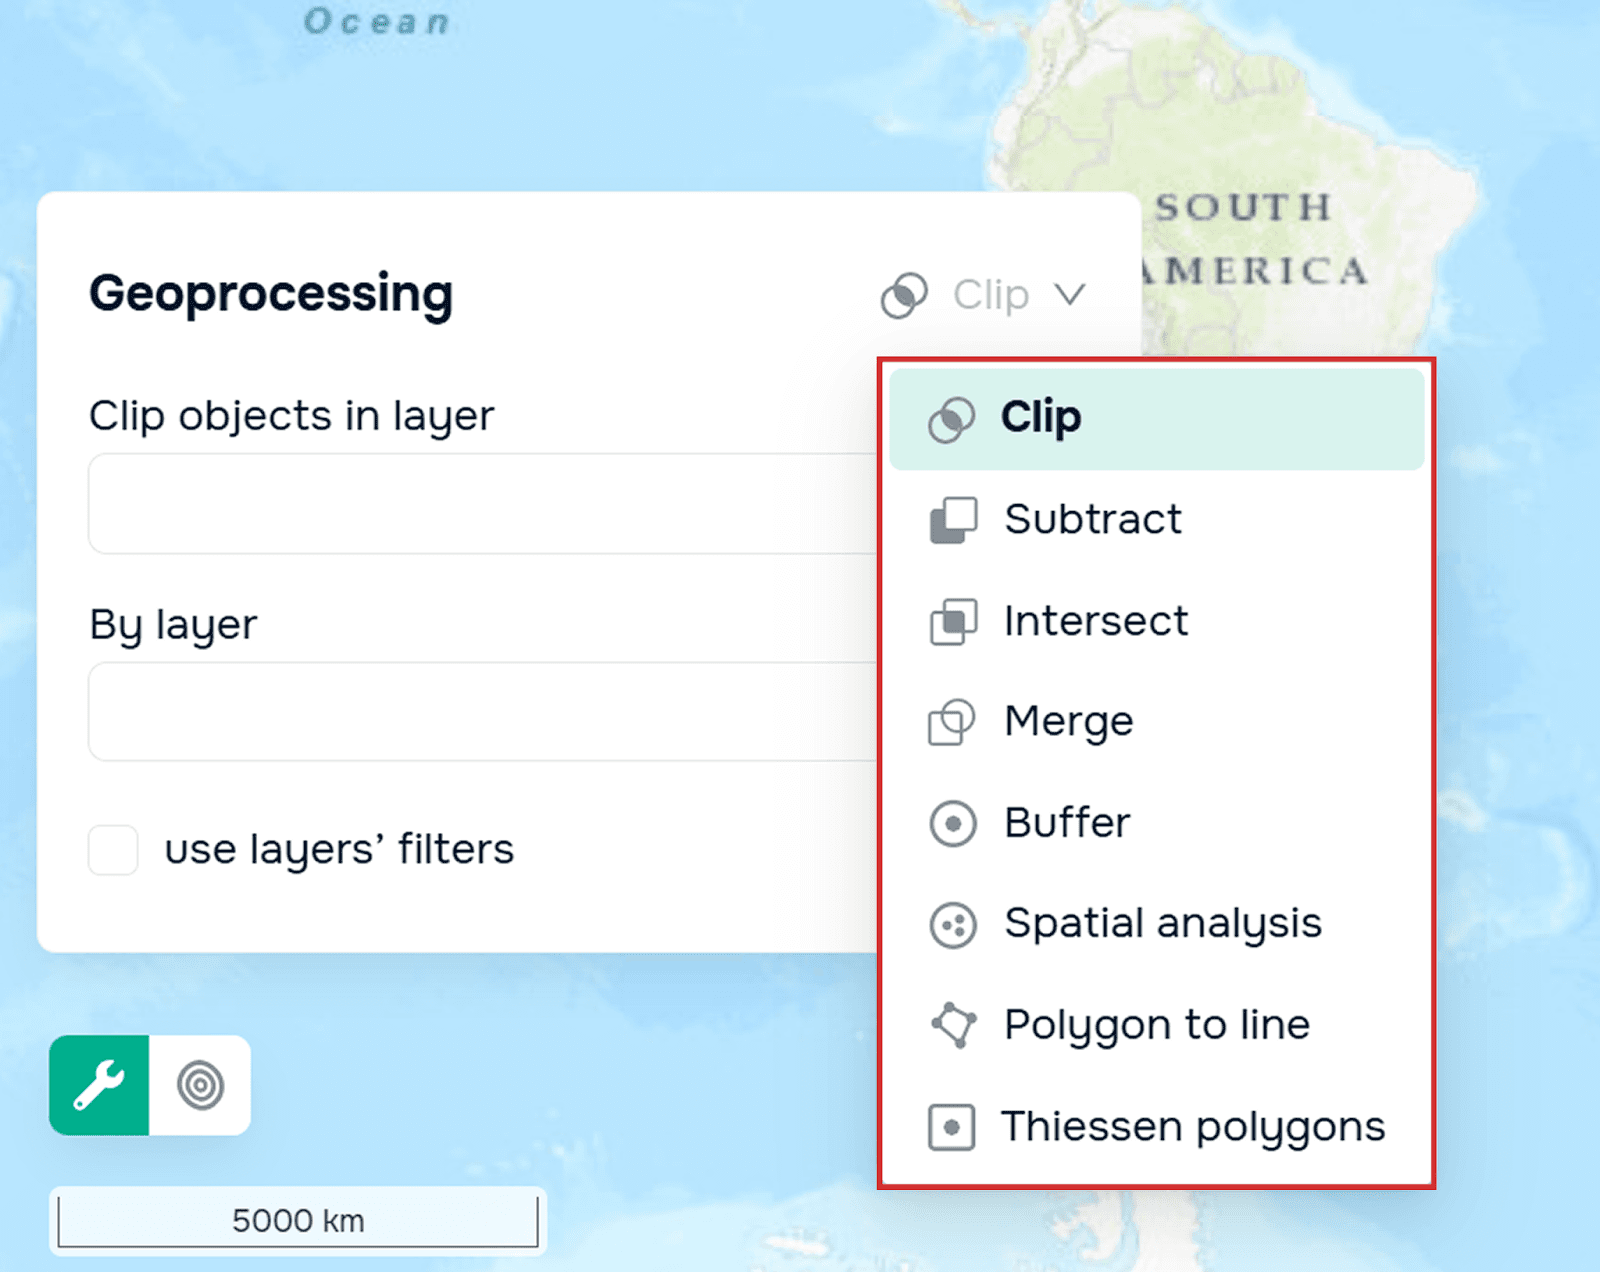
Paso 2. A continuación, en la esquina superior derecha de la ventana del widget, debe seleccionar el tipo de geoprocesamiento de la lista desplegable que se abre al hacer clic en Recortar (Clip).
Paso 3. El proceso de geoprocesamiento en sí. Veámoslo en detalle.
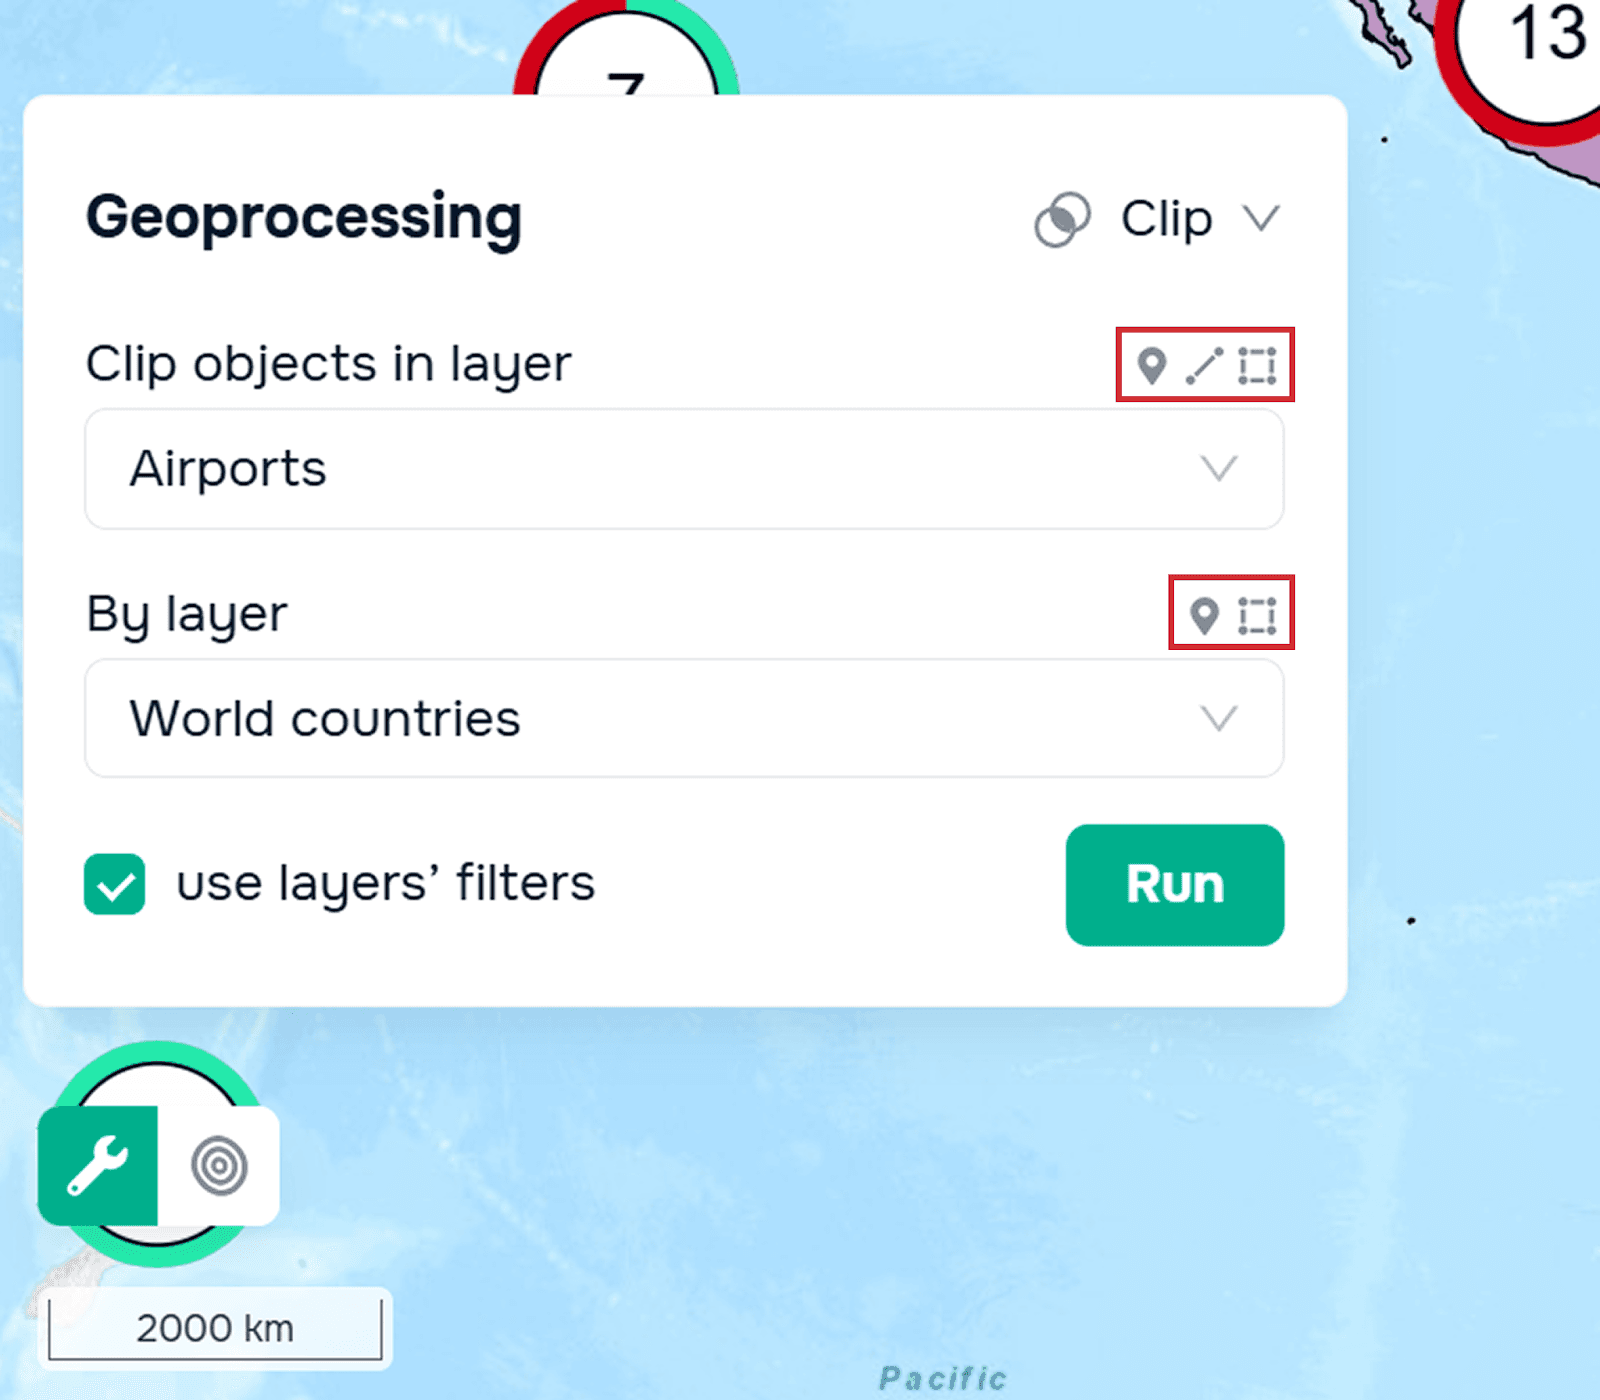
Recortar (Clip)
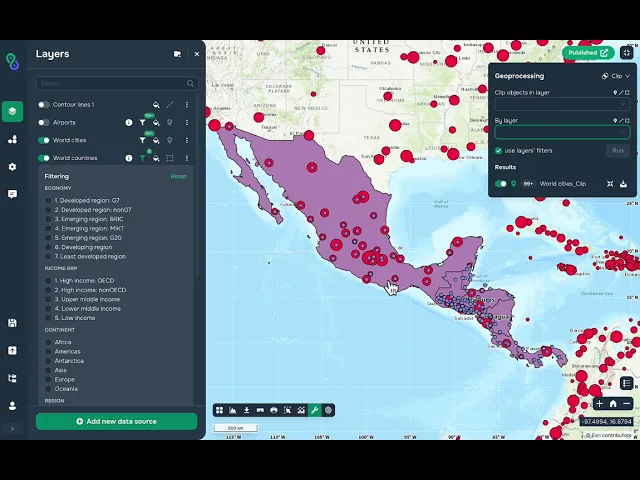
Para trabajar con esta herramienta, debe seleccionar la capa que desea recortar y la capa mediante la cual la recortará. También puede tener en cuenta los filtros habilitados en las capas.
El resultado de la herramienta será la intersección de los objetos de la primera y la segunda capa.
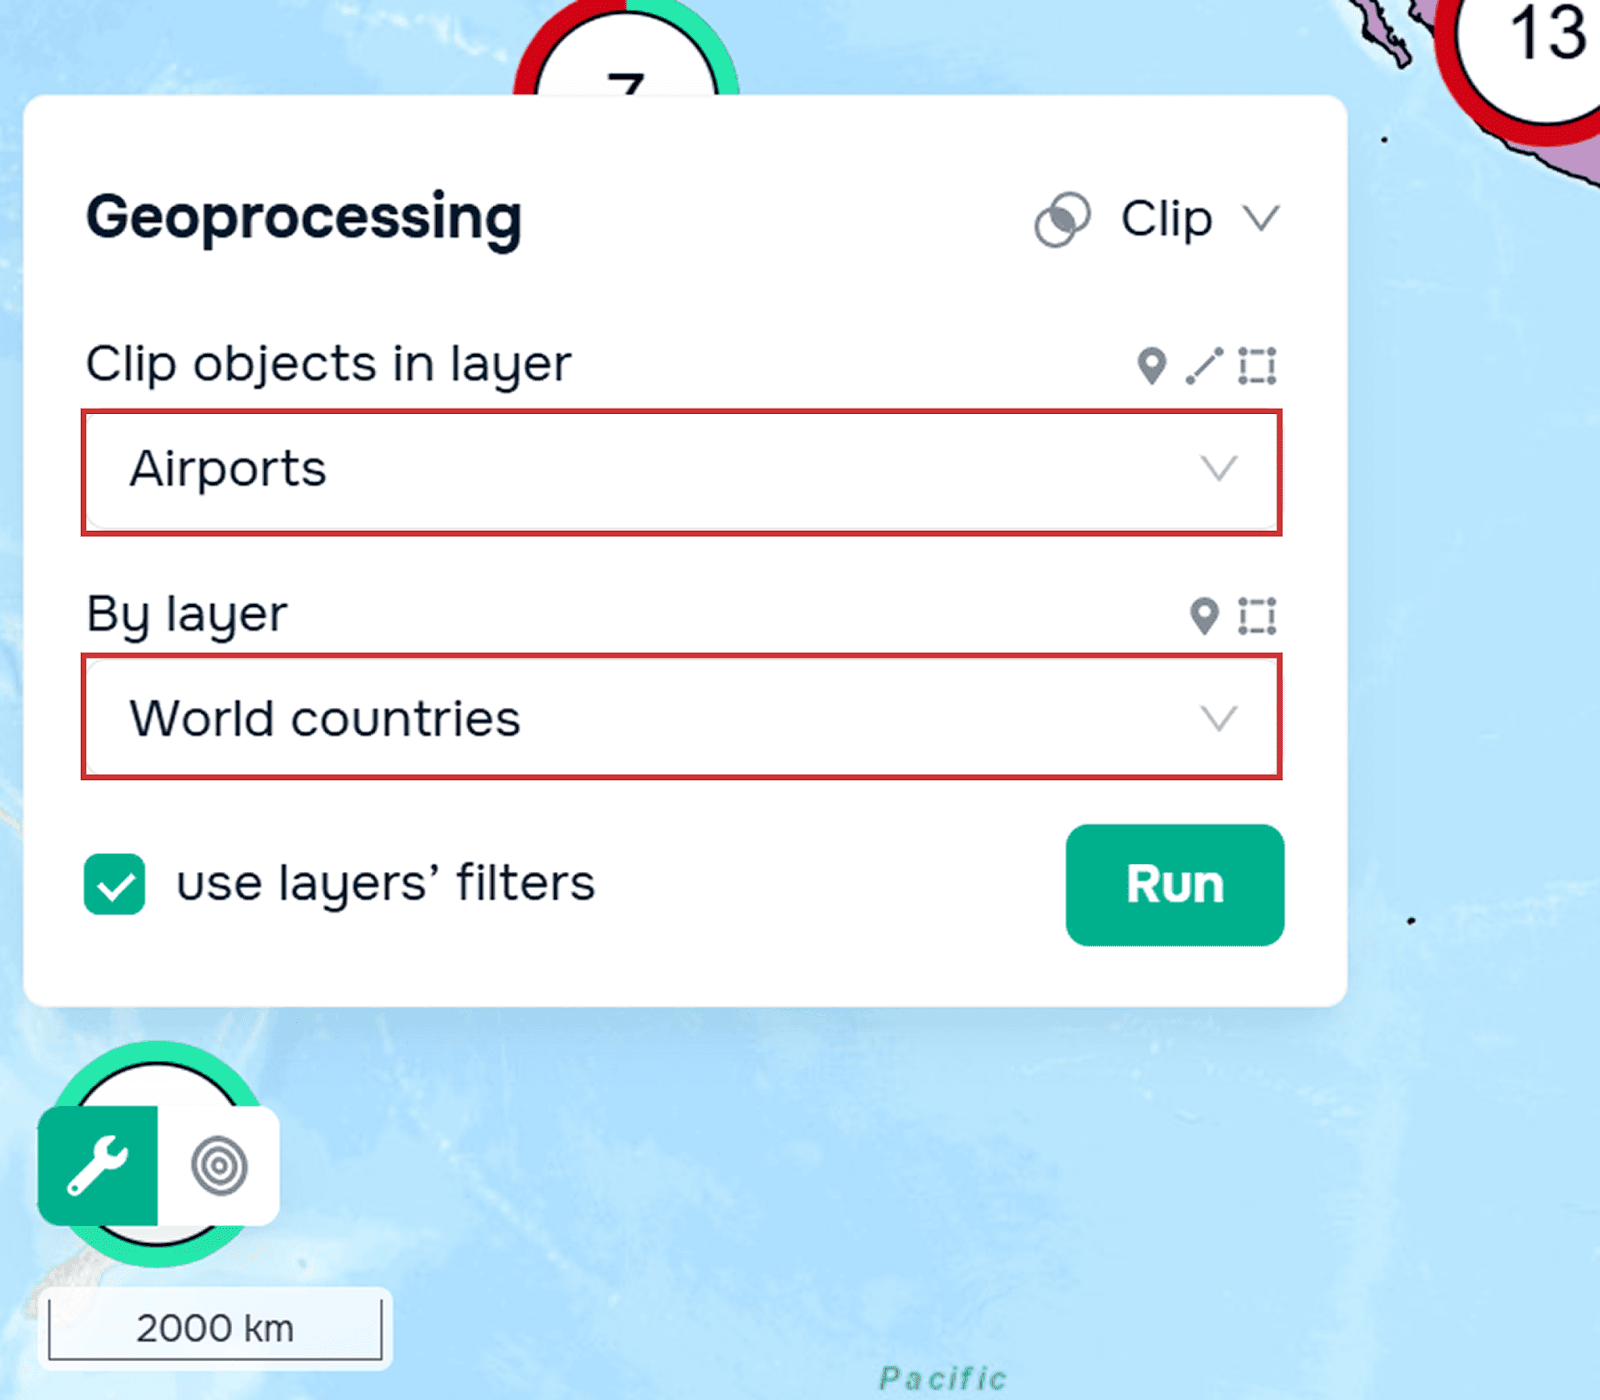
También vale la pena señalar que, al seleccionar las capas, en la esquina superior derecha hay una pista gráfica sobre qué tipo de geometría se puede seleccionar.
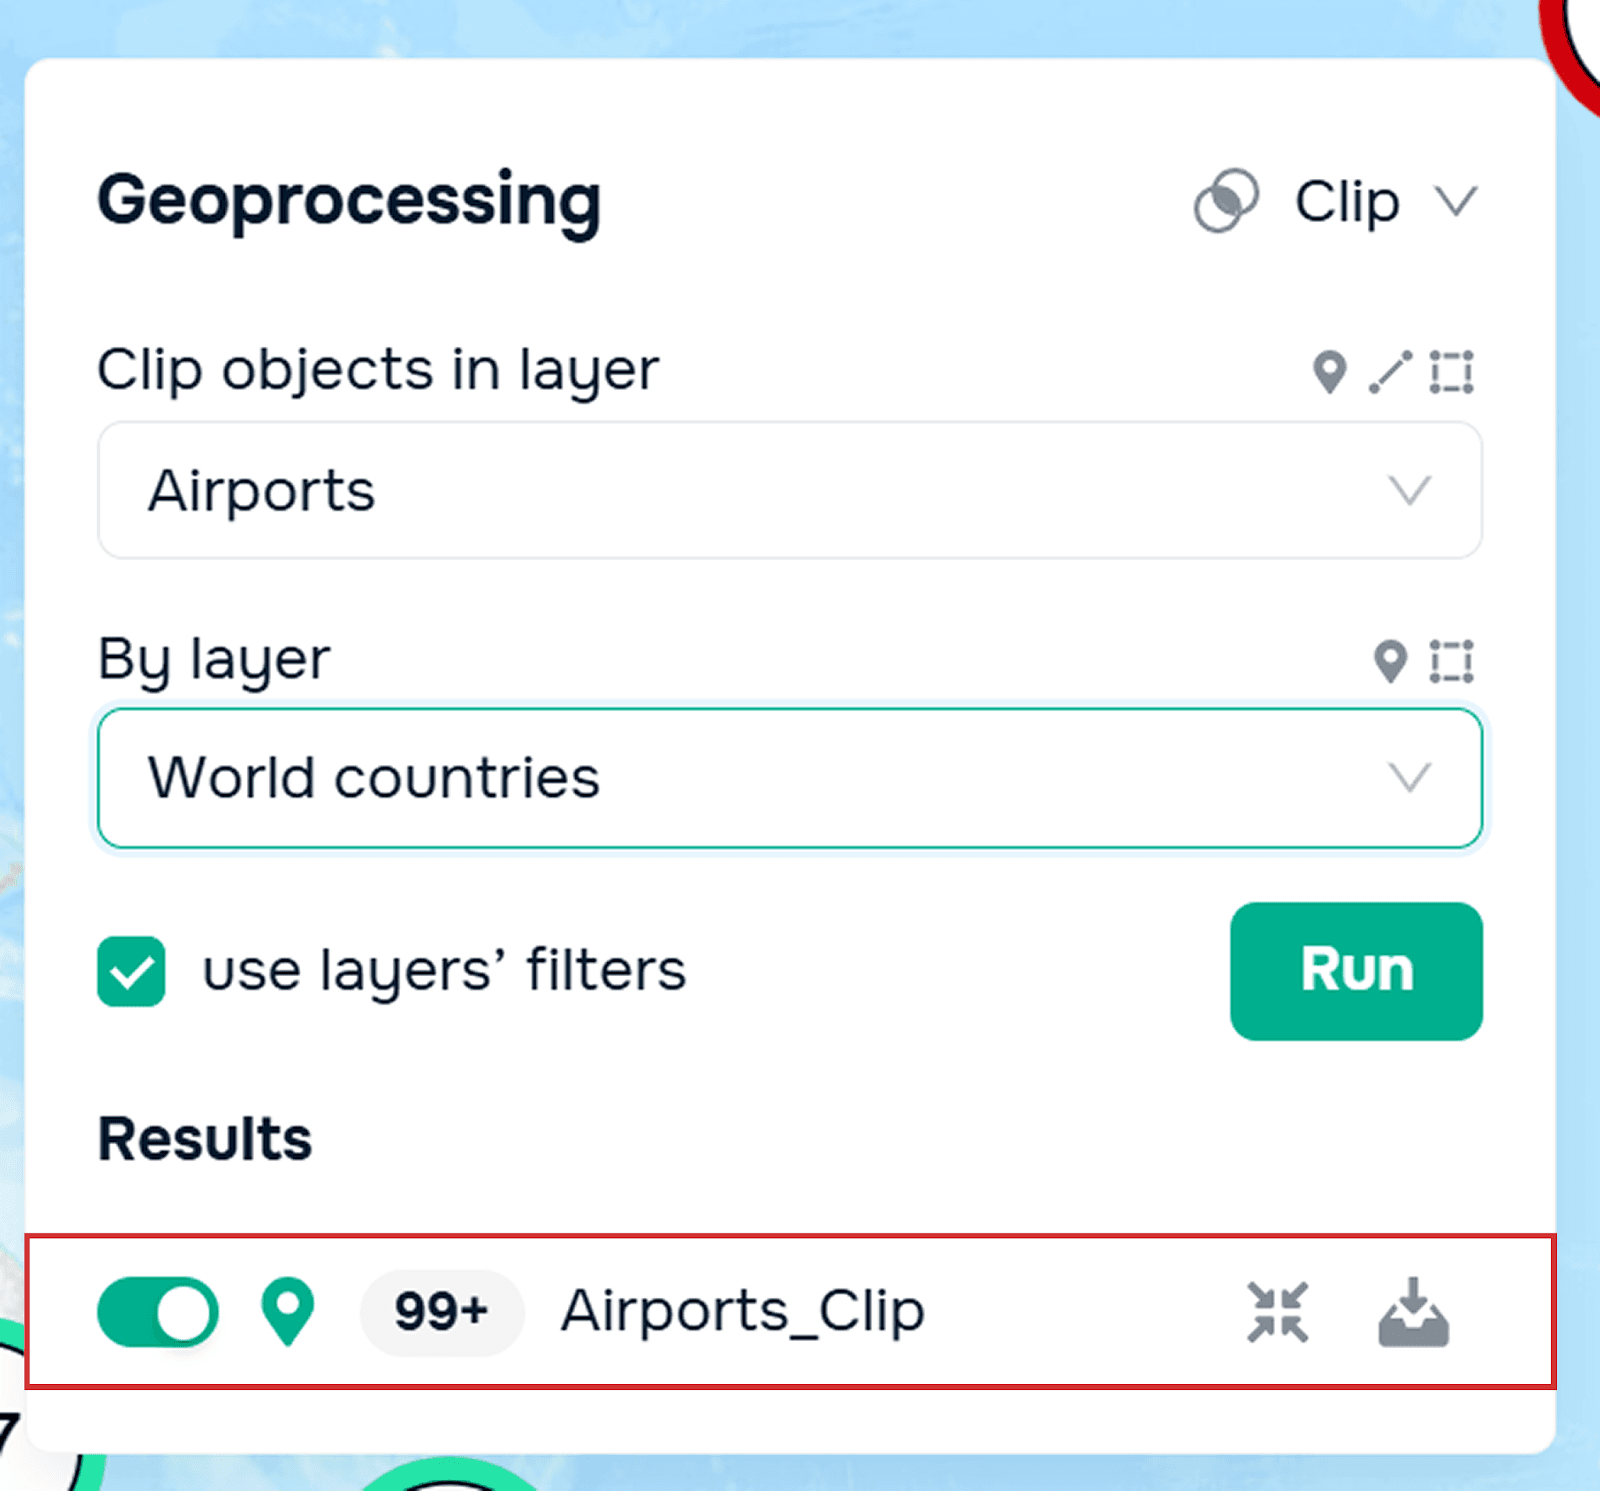
El resultado del geoprocesamiento se añadirá a la ventana del widget. Puede descargarlo a su base de datos.
Puede encontrar más detalles sobre cómo funciona la herramienta de Recorte en nuestro tutorial.
Restar
Debe seleccionar dos capas:
– la capa de la cual va a restar
– la capa cuya intersección va a restar
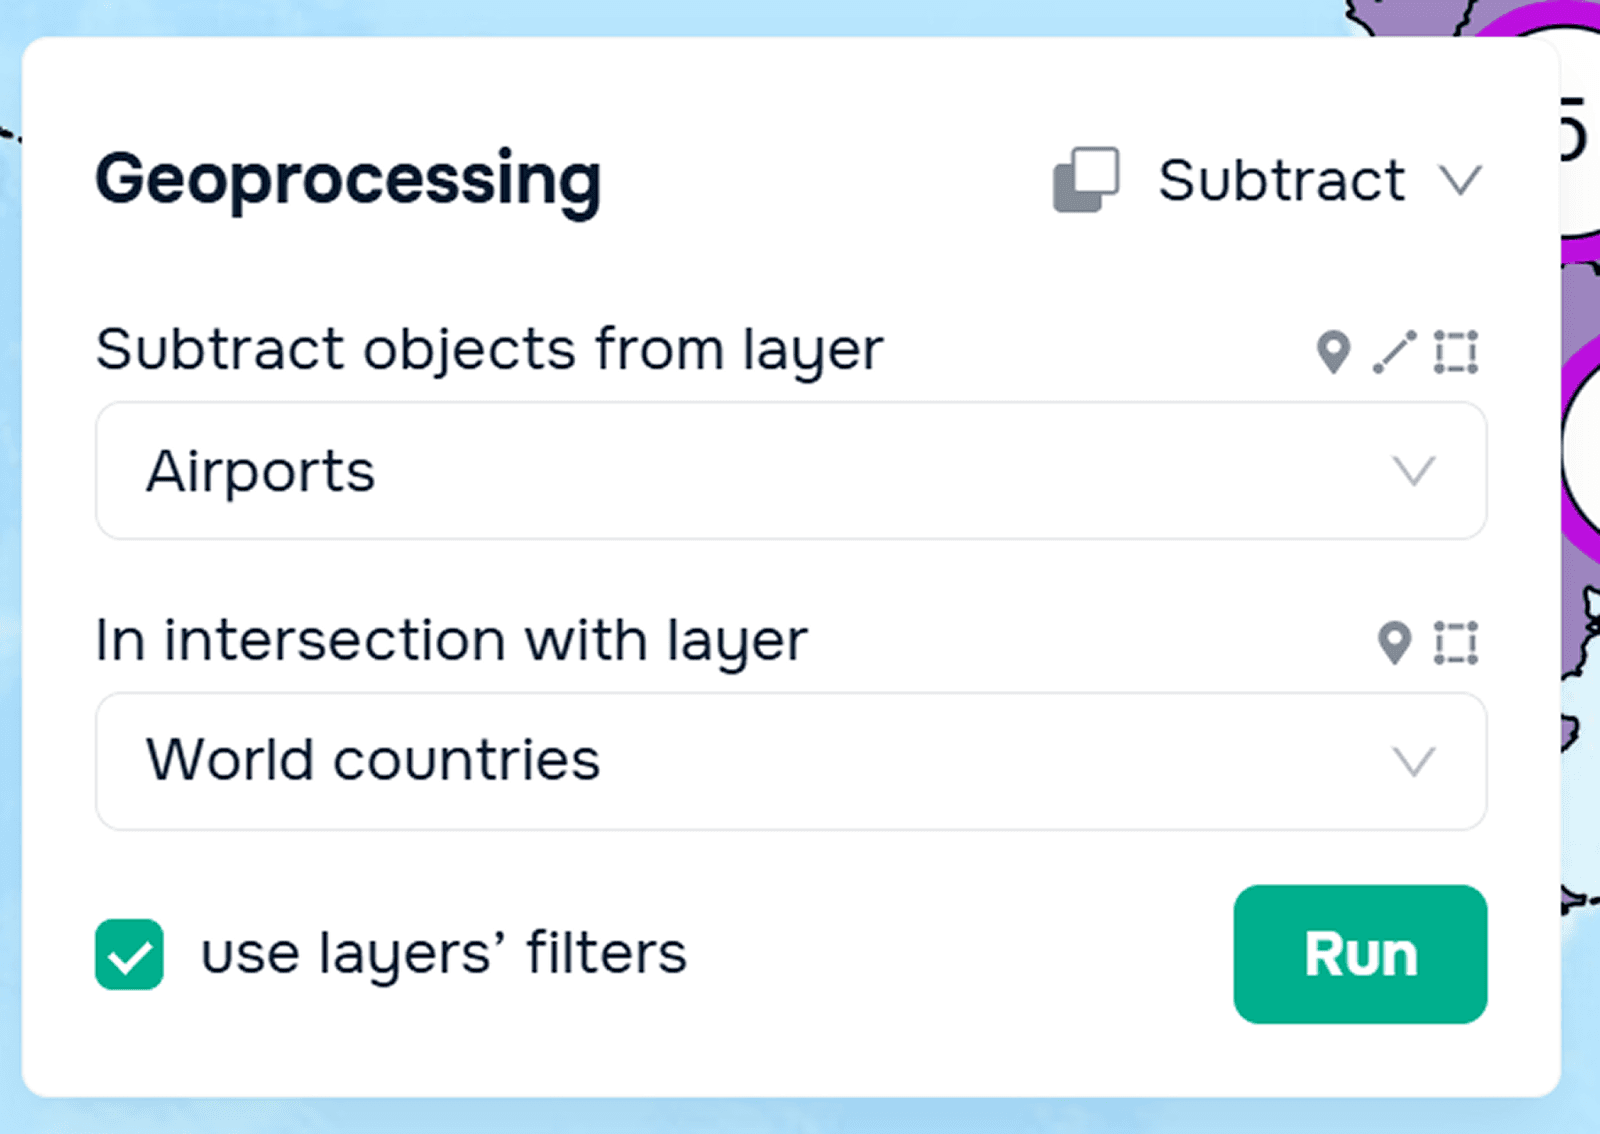
El resultado de esta herramienta será la parte de la primera capa que no se cruza con la segunda.
Puede obtener más información sobre el funcionamiento de esta herramienta en nuestro tutorial.
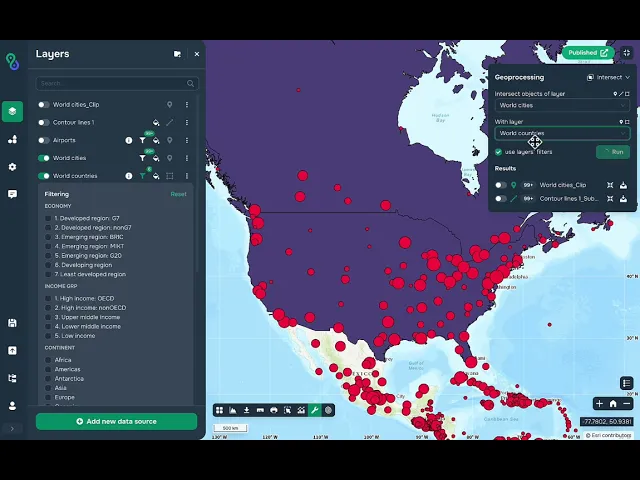
Intersección
Al utilizar esta herramienta, debe seleccionar las capas que desea intersectar. El resultado será una intersección de ambas capas.
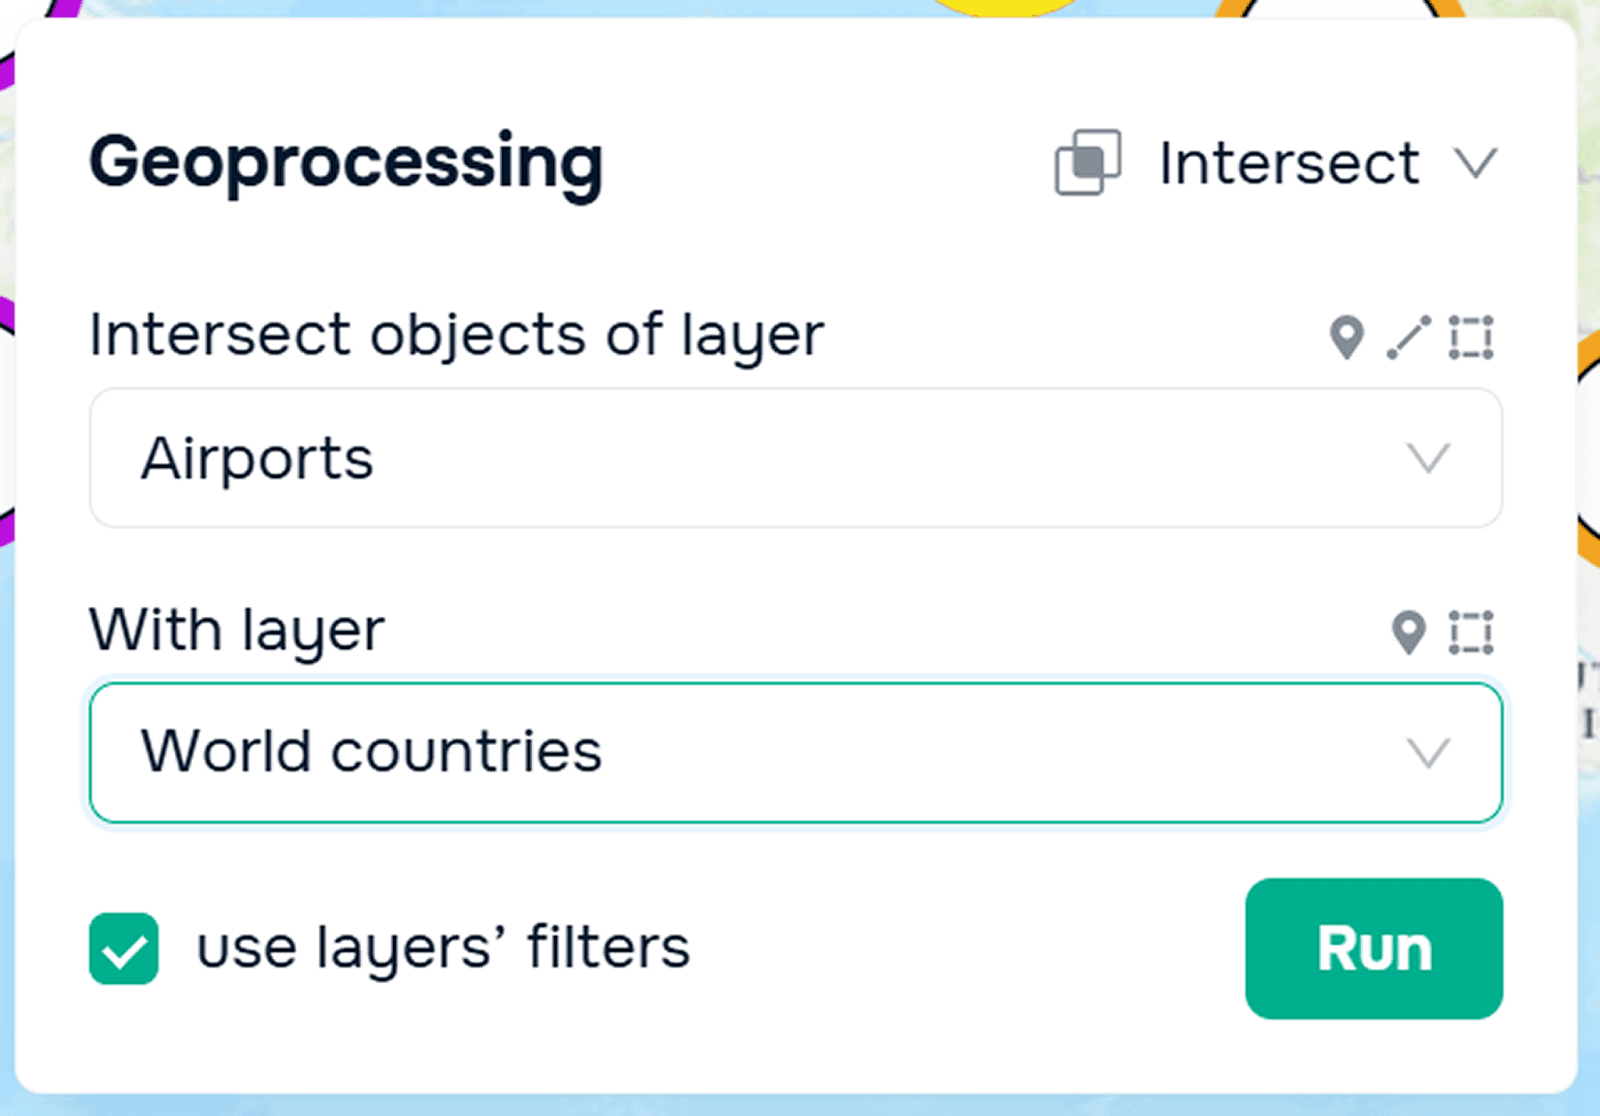
Puede obtener más información sobre el funcionamiento de esta herramienta en nuestro tutorial.
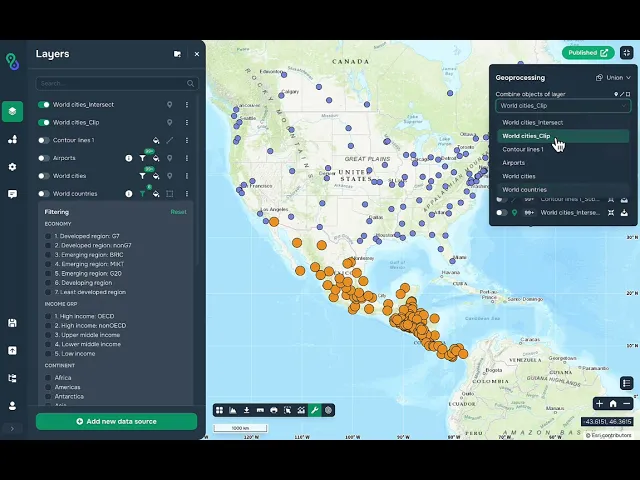
Fusionar (Merge)
Para utilizar esta herramienta, debe seleccionar dos capas con idéntica geometría. El resultado es una capa fusionada que contiene elementos tanto de la primera como de la segunda capa.
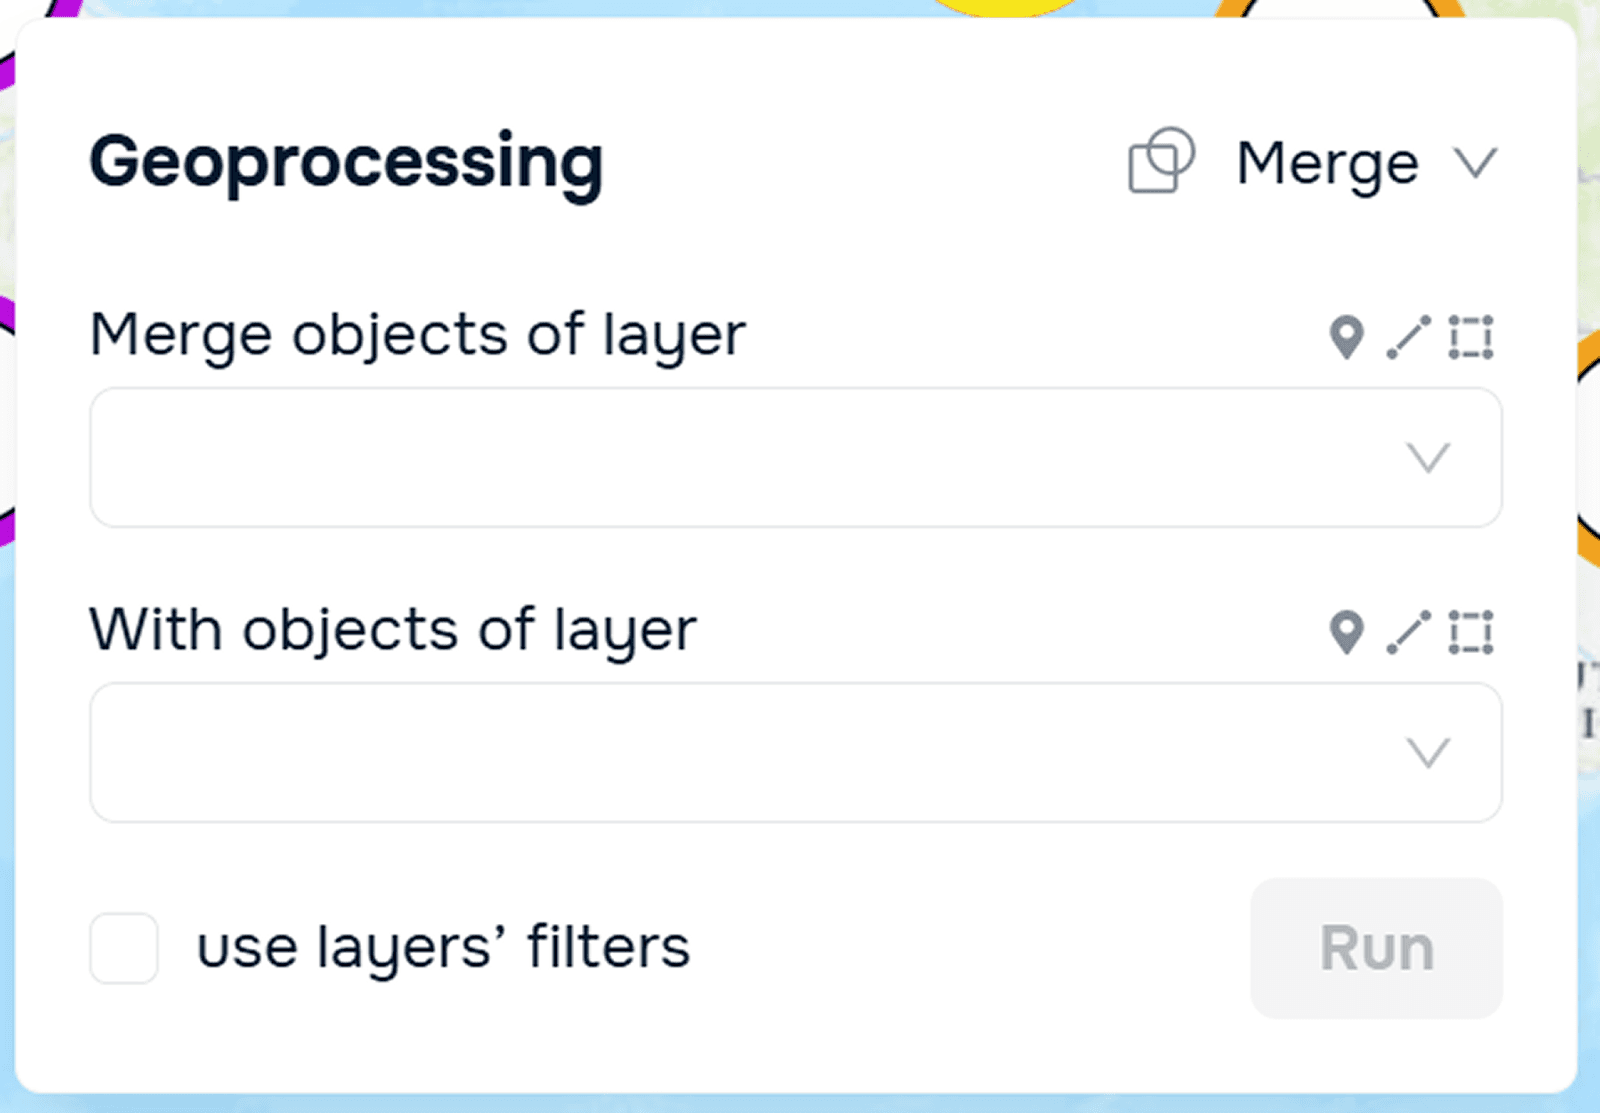
Puede obtener más información sobre el funcionamiento de esta herramienta en nuestro tutorial.
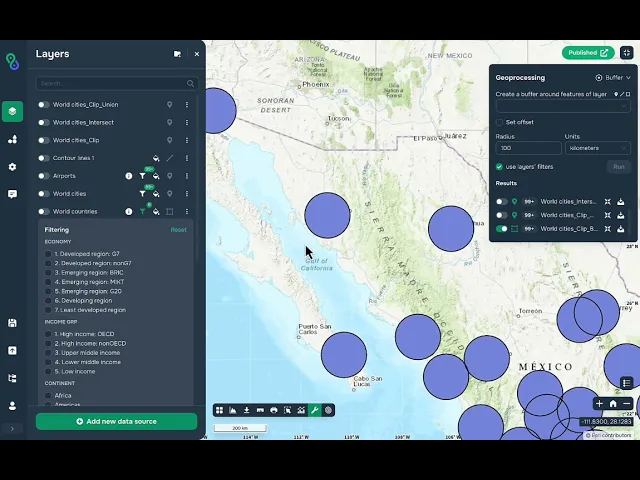
Área de influencia (Buffer)
Esta herramienta le permite crear una zona de amortiguamiento alrededor de un objeto con un radio especificado. En la ventana del widget, puede configurar el radio y las unidades de medida.
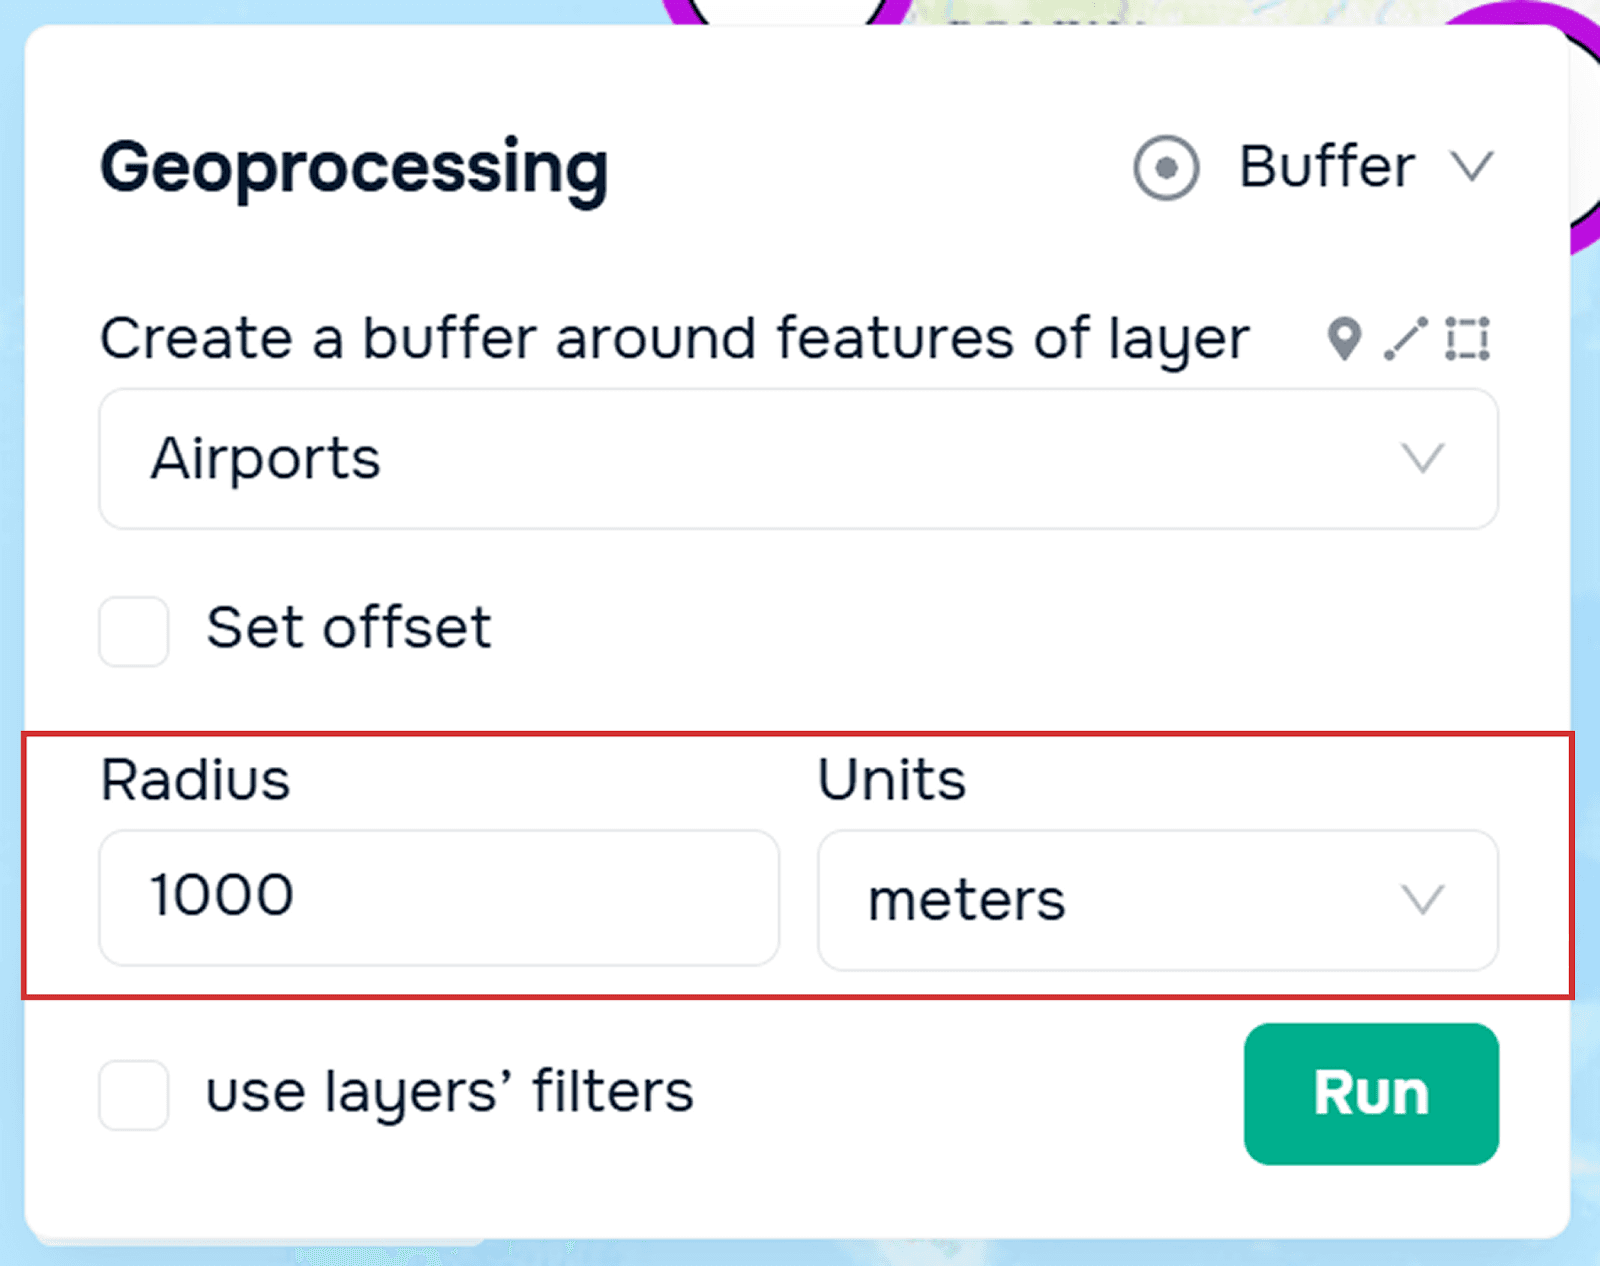
Puede obtener más información sobre el funcionamiento de esta herramienta en nuestro tutorial.
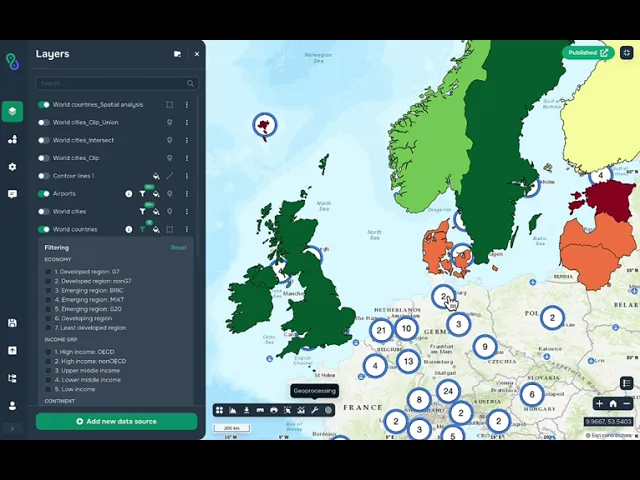
Análisis espacial
Para utilizar esta herramienta, debe seleccionar una capa de polígonos a la que se adjuntarán los valores obtenidos. A continuación, elija la capa sobre la que se generarán las estadísticas (puede ser cualquier geometría). Luego, seleccione el atributo numérico para el cálculo. Por último, seleccione el tipo de cálculo: mínimo, máximo, media o suma. El resultado es una nueva capa de polígonos basada en la primera con un atributo adicional para las estadísticas.
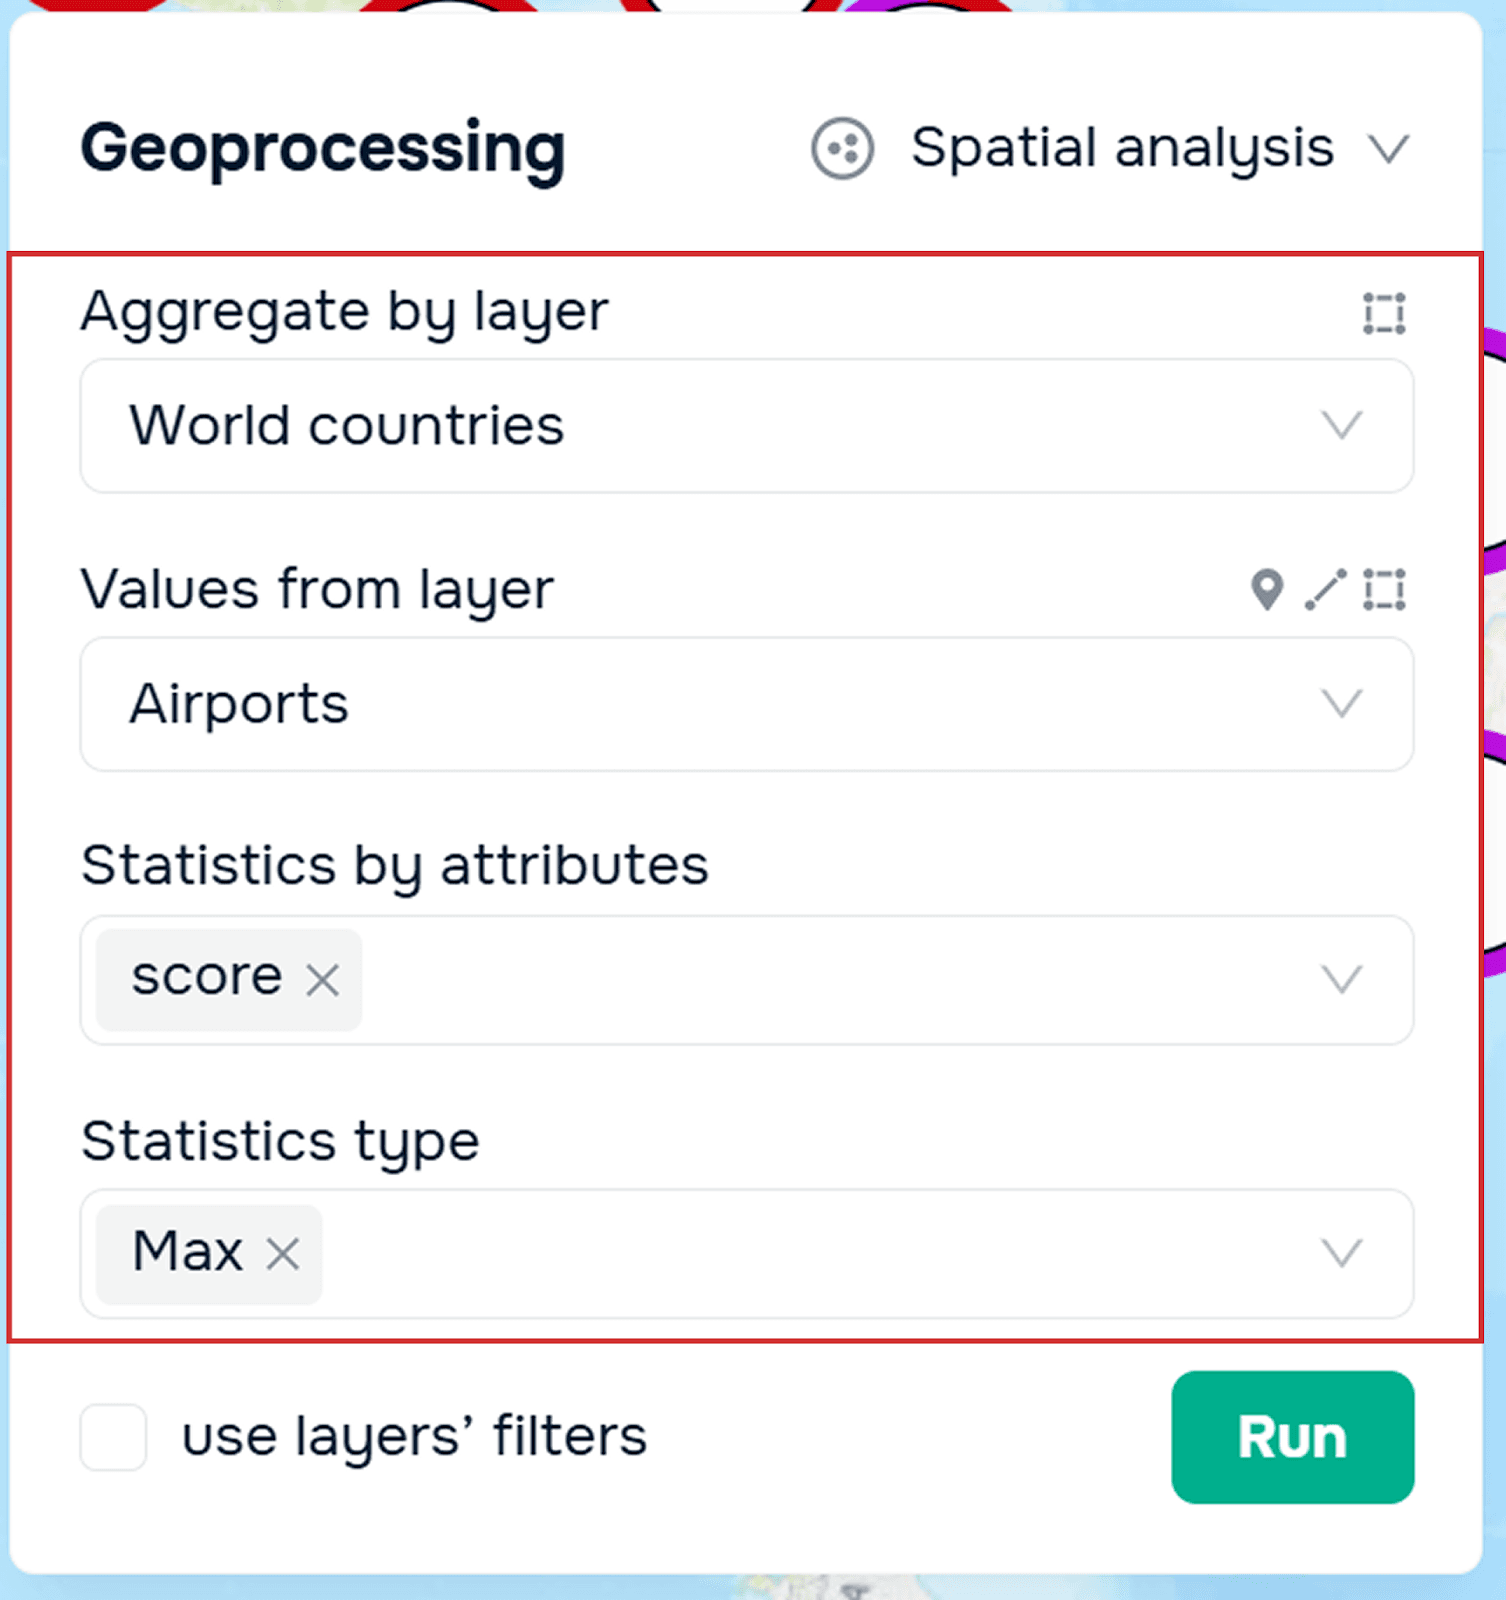
Puede obtener más información sobre el funcionamiento de esta herramienta en nuestro tutorial.
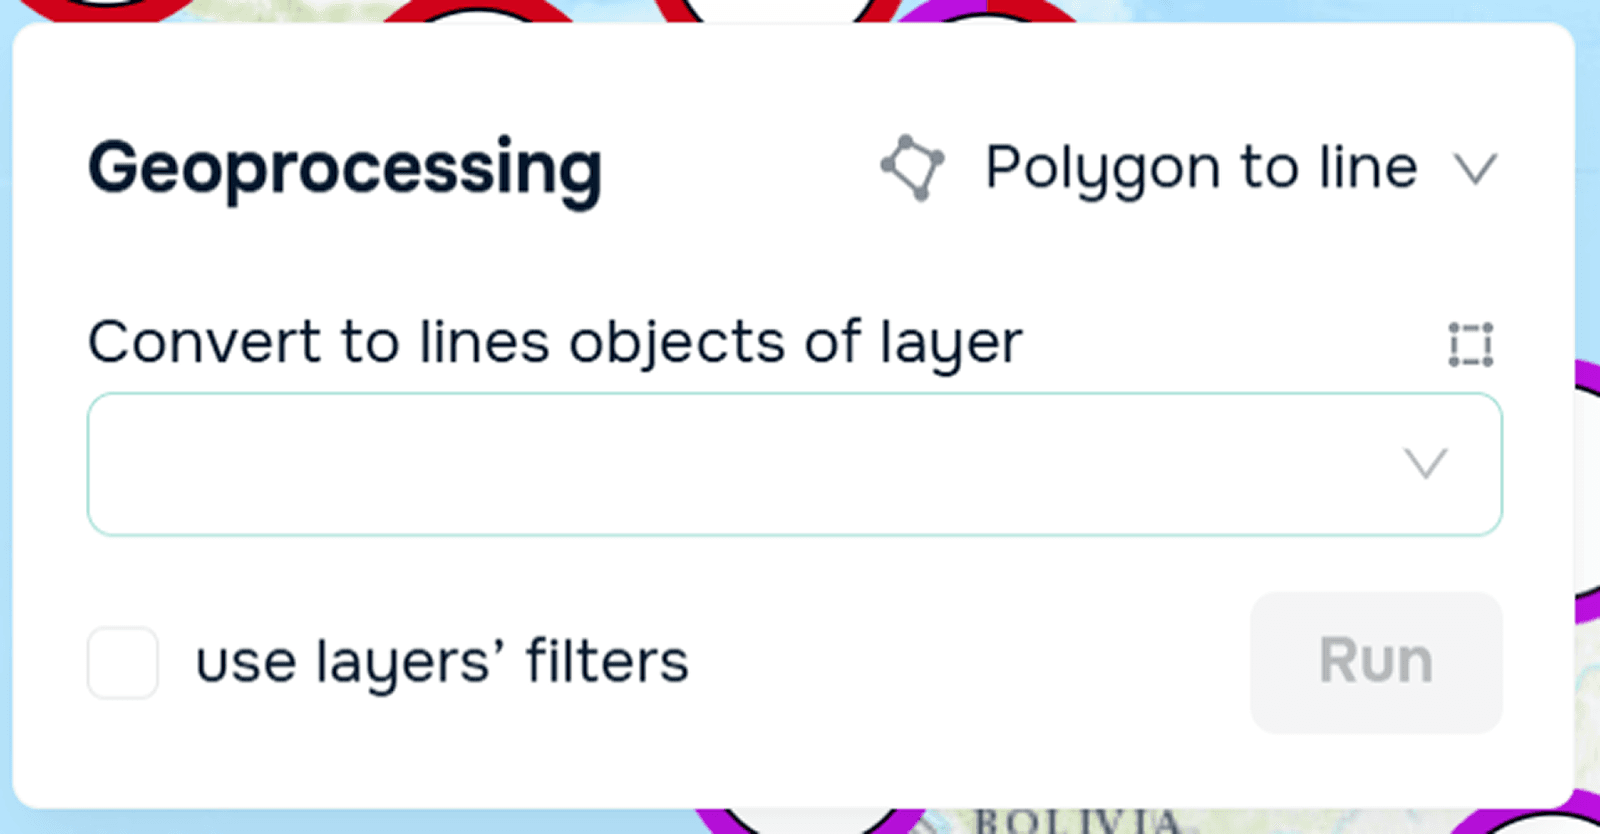
Polígono a líneas
Debe seleccionar la capa de polígonos que desea convertir en una capa de líneas.
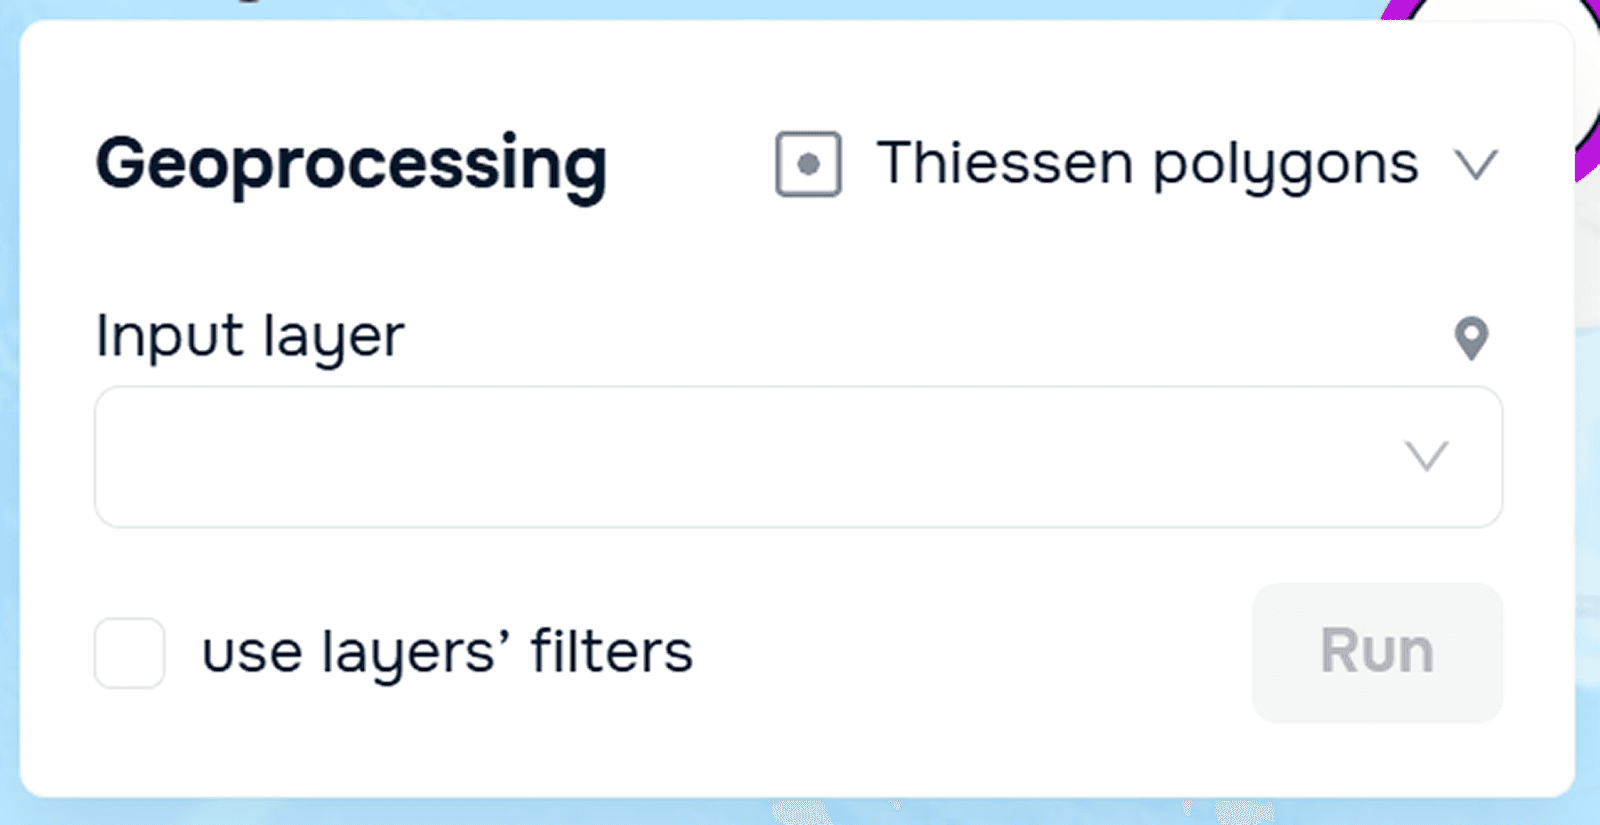
Polígonos de Thiessen
Una herramienta que crea polígonos que definen áreas de influencia alrededor de cada punto de entrada. Debe seleccionar una capa de puntos alrededor de la cual se construirán estas áreas.
Preguntas frecuentes
¿Qué tipos de datos son compatibles con el widget de Geoprocesamiento?
El widget admite capas de puntos, líneas y polígonos. Las herramientas disponibles dependen de la geometría de las capas seleccionadas.
¿Puedo utilizar capas filtradas en las operaciones de geoprocesamiento?
Sí, los filtros habilitados en las capas se pueden tener en cuenta al ejecutar herramientas como Recortar (Clip) y Restar.
¿Dónde se almacenan los resultados de geoprocesamiento?
Los resultados aparecen en la ventana del widget y se pueden descargar y guardar en su base de datos para su uso posterior.
¿Por qué algunas capas no están disponibles para su selección?
Cada herramienta tiene requisitos geométricos específicos. El widget muestra sugerencias gráficas que indican qué tipos de geometría son compatibles.
Conclusiones clave
El geoprocesamiento es esencial para transformar, combinar y analizar datos espaciales en SIG.
Herramientas como Recortar, Intersección y Restar ayudan a identificar superposiciones, exclusiones y áreas de interés.
Las herramientas de análisis como Área de influencia, Análisis espacial y Polígonos de Thiessen revelan relaciones espaciales y zonas de influencia.
El widget de Geoprocesamiento en GISCARTA proporciona un flujo de trabajo intuitivo y paso a paso con resultados descargables.


