
Los índices espectrales son una de las herramientas fundamentales para analizar datos de observación de la Tierra. Son combinaciones matemáticas de valores de reflectancia en varias bandas espectrales de imágenes satelitales. Estas combinaciones permiten resaltar propiedades específicas de la superficie que son difíciles de determinar a partir de imágenes estándar en color.
Cada tipo de superficie—vegetación, suelo, agua o áreas urbanizadas—refleja la radiación electromagnética de manera diferente en distintos rangos espectrales. Por ejemplo, la vegetación sana refleja activamente la radiación en el rango del infrarrojo cercano y absorbe la luz roja. Utilizando esta propiedad, se pueden calcular índices que permiten evaluar cuantitativamente la salud de la vegetación.
A diferencia de las imágenes RGB estándar, los índices espectrales permiten identificar patrones ocultos en los datos. Se utilizan ampliamente en agricultura, silvicultura, ecología y monitoreo ambiental. Pueden emplearse para evaluar la salud de los cultivos, seguir la degradación de la vegetación, identificar el estrés de las plantas y analizar cambios en la superficie terrestre a lo largo del tiempo.
Índices básicos de vegetación
Uno de los índices más comunes es el NDVI (Índice de Vegetación de Diferencia Normalizada). Se calcula utilizando las bandas roja y de infrarrojo cercano (NIR) de las imágenes satelitales.
Explicación de canales
Satélite | Verde | Rojo | NIR |
Sentinel-2 | Banda 3 | Banda 4 | Banda 8 |
Landsat 8–9 | Banda 3 | Banda 4 | Banda 5 |
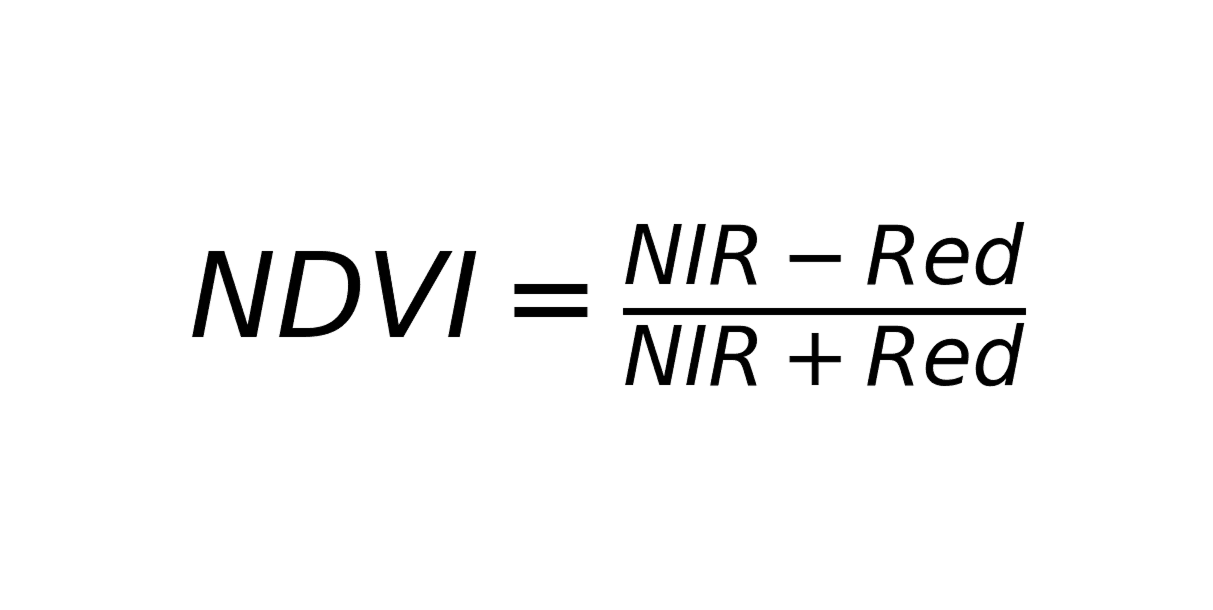
Fórmula de cálculo del índice NDVI
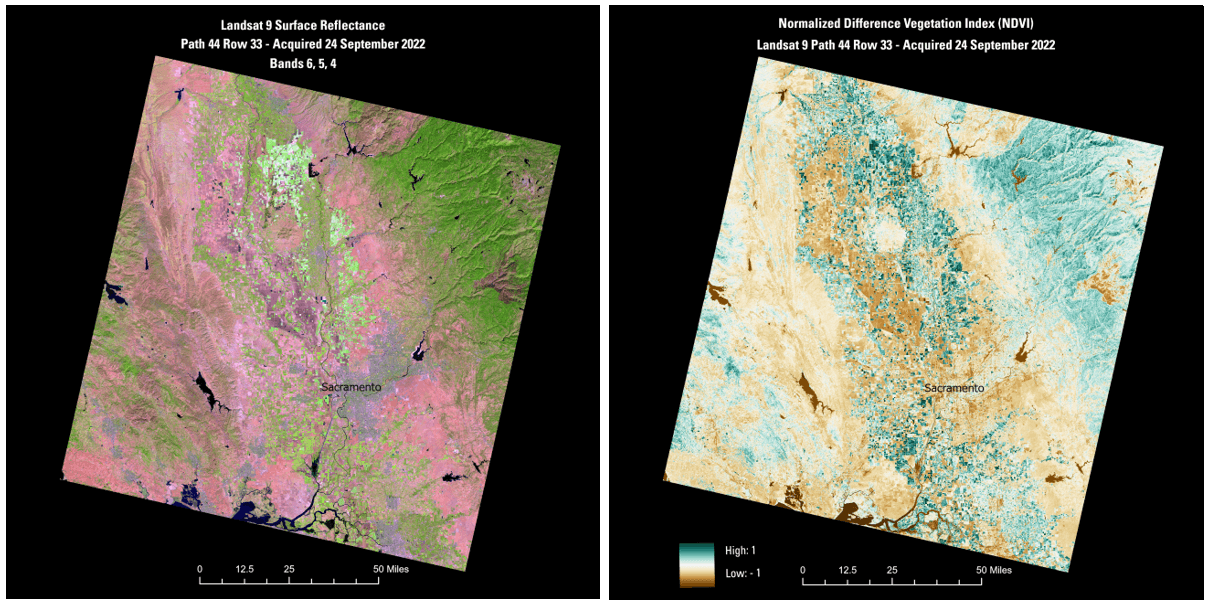
Ejemplo de cálculo del índice. Fuentes/Uso: Dominio público. Ver detalles del recurso multimedia
Los valores del índice van de -1 a 1. Los valores altos (0.6–0.9) suelen corresponder a vegetación densa y saludable, los valores cercanos a cero indican suelo o vegetación dispersa, y los valores negativos son típicos del agua o las nubes. En los mapas NDVI, la vegetación saludable suele mostrarse en tonos verdes, mientras que los valores bajos son amarillos o rojos.
Otro índice simple es el DVI (Índice de Vegetación de Diferencia):
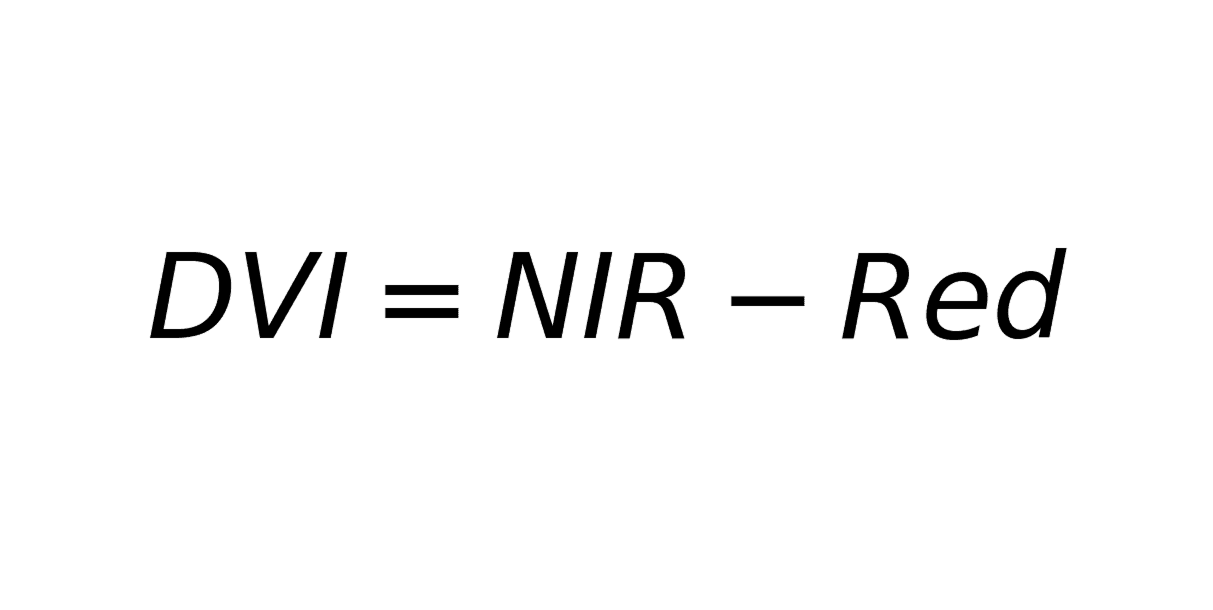
Fórmula de cálculo del índice DVI
Este índice refleja la diferencia absoluta entre los canales infrarrojo y rojo. Es sensible a la densidad de la vegetación, pero puede verse afectado por las condiciones de iluminación y las características del sensor.
RVI (Índice de Vegetación de Razón) es la razón de estos mismos canales:
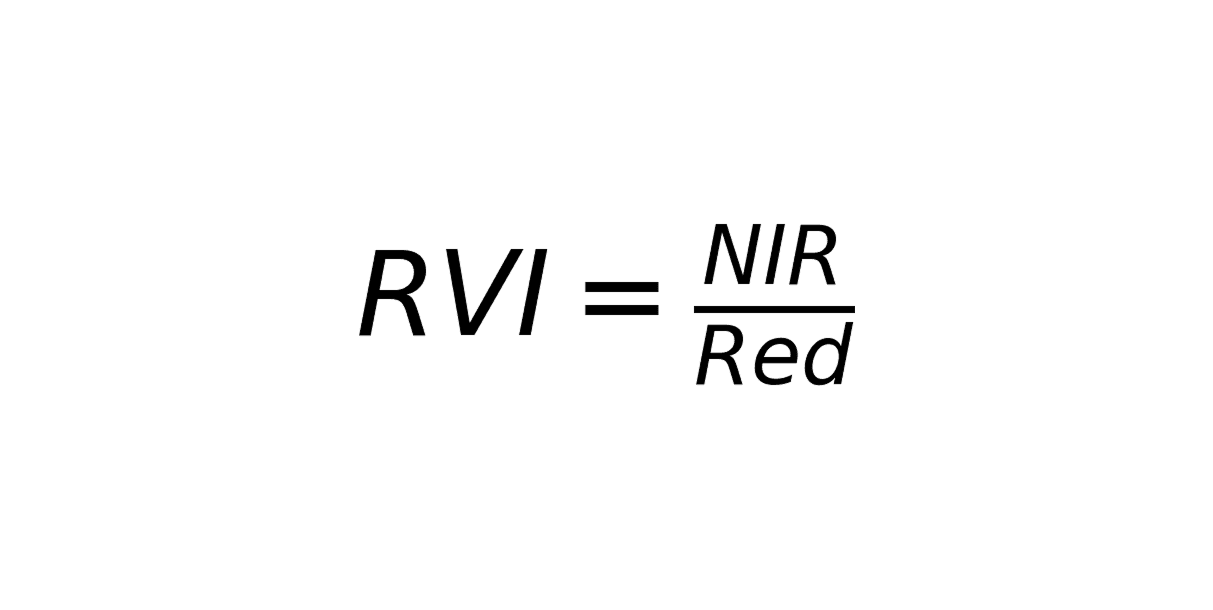
Fórmula de cálculo del índice RVI
Este índice se utiliza para evaluar la biomasa y la densidad de la vegetación.
Otro indicador simple es el GRVI (Índice de Vegetación Verde-Rojo):
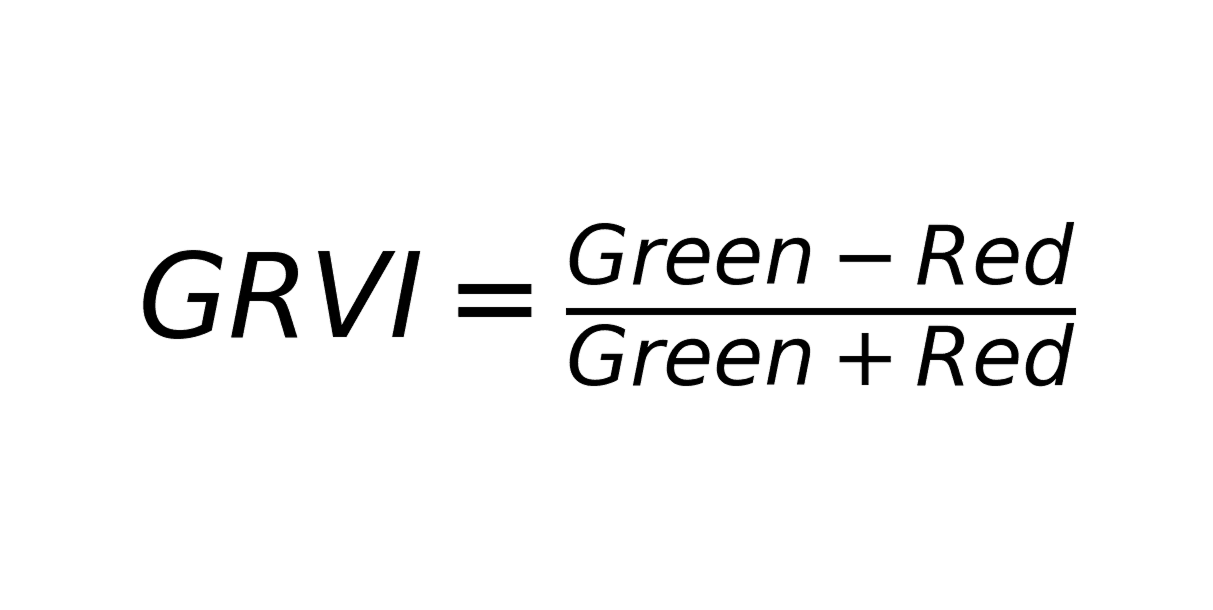
Fórmula de cálculo del índice GRVI
Utiliza tanto las bandas verde como roja y puede aplicarse en situaciones donde no hay datos infrarrojos disponibles.
Estos índices básicos se utilizan a menudo como punto de partida para el análisis de la vegetación y permiten una evaluación rápida del estado de un área utilizando datos satelitales.
Aplicación práctica de los índices básicos
La elección del índice espectral depende de la tarea de análisis y de los canales de datos satelitales disponibles. Los índices básicos: NDVI, DVI, RVI y GRVI se utilizan para una evaluación inicial del estado de la vegetación y permiten identificar rápidamente áreas con distinta densidad de vegetación.
NDVI es el índice más común y se utiliza para monitorear las condiciones de la vegetación en grandes áreas. Permite identificar zonas de crecimiento activo de plantas, seguir cambios estacionales y analizar la dinámica de la vegetación a lo largo del tiempo.
DVI se utiliza para evaluar las diferencias de reflectividad entre las bandas infrarroja y roja. Este índice puede usarse para identificar fácilmente áreas con mayor o menor biomasa, así como para análisis rápidos de imágenes sin normalización compleja de datos.
RVI es la razón entre las bandas infrarroja y roja y se utiliza para evaluar la densidad de la vegetación. Es especialmente útil para comparar diferentes áreas de un territorio, ya que permite identificar diferencias en la intensidad de la vegetación.
GRVI utiliza bandas verde y roja y puede aplicarse en situaciones donde no se dispone de datos del infrarrojo cercano. Este índice es adecuado para analizar imágenes con un conjunto limitado de bandas espectrales, como las de ciertos tipos de fotografías aéreas o cámaras.
El uso de estos índices básicos proporciona una idea general del estado de la vegetación y sirve como punto de partida para un análisis más detallado de los datos satelitales. En aplicaciones prácticas, a menudo se utiliza la comparación de múltiples índices, lo que ayuda a interpretar con mayor precisión la condición del área de estudio.
Tabla resumen de índices
Índice | Bandas espectrales | Bandas de ejemplo (Sentinel-2 / Landsat 8–9) | Rango de valores | Ventajas | Limitaciones |
NDVI | NIR, Rojo | Sentinel-2: B8, B4 / Landsat 8–9: B5, B4 | −1 a 1 | Índice ampliamente utilizado, valores normalizados, eficaz para monitorear el estado de la vegetación y sus cambios a lo largo del tiempo | Puede saturarse en vegetación densa y verse afectado por las condiciones atmosféricas |
DVI | NIR, Rojo | Sentinel-2: B8, B4 / Landsat 8–9: B5, B4 | Depende de los valores de reflectancia del sensor | Cálculo muy simple, útil para detectar diferencias en la biomasa de la vegetación | No está normalizado, sensible a la iluminación y a diferencias entre sensores |
RVI | NIR, Rojo | Sentinel-2: B8, B4 / Landsat 8–9: B5, B4 | Normalmente > 1 para vegetación | Útil para comparar la densidad de vegetación y biomasa entre áreas | Sensible a efectos atmosféricos y variaciones en los valores de reflectancia |
GRVI | Verde, Rojo | Sentinel-2: B3, B4 / Landsat 8–9: B3, B4 | −1 a 1 | Puede calcularse cuando no hay datos NIR disponibles, adecuado para conjuntos de datos espectrales limitados | Menos sensible a la salud de la vegetación en comparación con índices que usan NIR |
Preguntas frecuentes
¿Para qué se utilizan los índices espectrales?
Los índices espectrales ayudan a analizar imágenes satelitales al resaltar propiedades de la superficie terrestre, como la salud de la vegetación, la biomasa o las diferencias en la cobertura del suelo.
¿Por qué NDVI es el índice más utilizado?
NDVI proporciona una forma simple y fiable de evaluar las condiciones de la vegetación utilizando bandas roja y de infrarrojo cercano, lo que lo hace adecuado para el monitoreo a gran escala.
¿Cuándo deben usarse índices como DVI, RVI o GRVI?
Estos índices son útiles para análisis rápidos de vegetación, comparar densidad de vegetación o trabajar con conjuntos de datos donde solo hay disponibles bandas espectrales limitadas.
Puntos clave
Los índices espectrales permiten a los investigadores extraer información adicional de las imágenes satelitales combinando valores de diferentes bandas espectrales.
Índices básicos de vegetación como NDVI, DVI, RVI y GRVI ayudan a evaluar rápidamente la densidad y el estado de la vegetación en grandes áreas.
Comparar varios índices en conjunto mejora la interpretación de los datos satelitales y proporciona una comprensión más fiable de los patrones de vegetación.


