
¿Qué son las isolíneas de elevación?
Las isolíneas de elevación, o isohipsas, son líneas en un mapa que conectan puntos de igual elevación sobre el nivel del mar. Estas líneas representan cambios de elevación en el paisaje, lo que permite visualizar montañas, valles, colinas y otras formas del relieve en un mapa plano. Visualmente, las isolíneas ayudan a comprender mejor la forma de la superficie terrestre, haciendo que los mapas sean más informativos y claros.
Las isolíneas se utilizan para representar el terreno en mapas de distintas escalas, desde grandes mapas regionales hasta mapas topográficos detallados. Cuanto más juntas están las isolíneas, más precisos y detallados se vuelven los cambios de elevación. Las isolíneas facilitan determinar la pendiente del terreno, la profundidad de los valles y la altura de las cordilleras.
¿Cómo se construyen las curvas de nivel?
Para construir curvas de nivel, se utilizan modelos digitales de elevación (DEM). Estos modelos representan los datos de elevación para cada punto de la superficie terrestre. Estos datos pueden obtenerse mediante imágenes satelitales, fotografía aérea, escaneo láser (LiDAR) y otros métodos de recopilación de datos geoespaciales. Para más información sobre dónde encontrar datos de elevación, consulte nuestro artículo Fuentes abiertas de datos de relieve.
El proceso de construcción de curvas de nivel normalmente incluye varios pasos:
Preparación de datos: selección de un modelo de elevación (p. ej., SRTM, Copernicus DEM, ASTER GDEM).
Cálculo de los valores de elevación para cada celda de la imagen ráster obtenida del DEM.
Construcción de líneas de contorno que conectan puntos con los mismos valores de elevación. Esto puede lograrse utilizando algoritmos de interpolación u otros métodos matemáticos.
Así, las curvas de nivel en un mapa muestran cómo cambia la elevación de un área y ayudan a identificar fácilmente las formas del relieve.
¿Dónde se utilizan las curvas de nivel?
Las curvas de nivel se utilizan en una gran variedad de áreas donde es necesario analizar o planificar el uso del suelo según su forma. Estas son algunas áreas en las que las curvas de nivel desempeñan un papel clave:
Cartografía: Las curvas de nivel se utilizan para crear mapas topográficos que muestran el relieve del terreno. También ayudan a crear mapas temáticos para diversas aplicaciones, desde mapas de rutas turísticas hasta cartas de navegación.
Hidrología: En hidrología, las curvas de nivel ayudan a determinar cuencas de drenaje y direcciones del flujo de agua. Son una herramienta importante para el análisis de inundaciones, el diseño de sistemas de drenaje y la evaluación de la erosión.
Planificación urbana: En la planificación de infraestructura, las curvas de nivel son importantes para el diseño de carreteras, puentes y otras estructuras en zonas montañosas y onduladas. Permiten contabilizar con precisión los cambios de elevación y reducir los costos de construcción.
Estudios ambientales: Las curvas de nivel se utilizan para evaluar la influencia del relieve en la vegetación, así como para comprender la distribución de los ecosistemas y sus cambios a lo largo del tiempo.
Agricultura: En agronomía, las curvas de nivel ayudan en la planificación del riego, la evaluación del riesgo de erosión y la optimización del uso del suelo.
Las líneas de curvas de nivel proporcionan información crucial para el análisis y la toma de decisiones en estas áreas, ayudando a mejorar la precisión de la planificación y la previsión. Se pueden utilizar herramientas modernas para crear curvas de nivel y usarlas para resolver problemas del mundo real. Por ejemplo, la plataforma GISCARTA ofrece un widget de curvas de nivel que permite visualizar y analizar fácilmente datos de elevación, haciendo el proceso más accesible y eficiente.
El widget de Isolíneas de Elevación en la plataforma GISCARTA
Para empezar a usar el widget, debe hacerlo disponible en la barra de herramientas. Puede habilitarlo en la sección Widgets; aparecerá como una espiral.
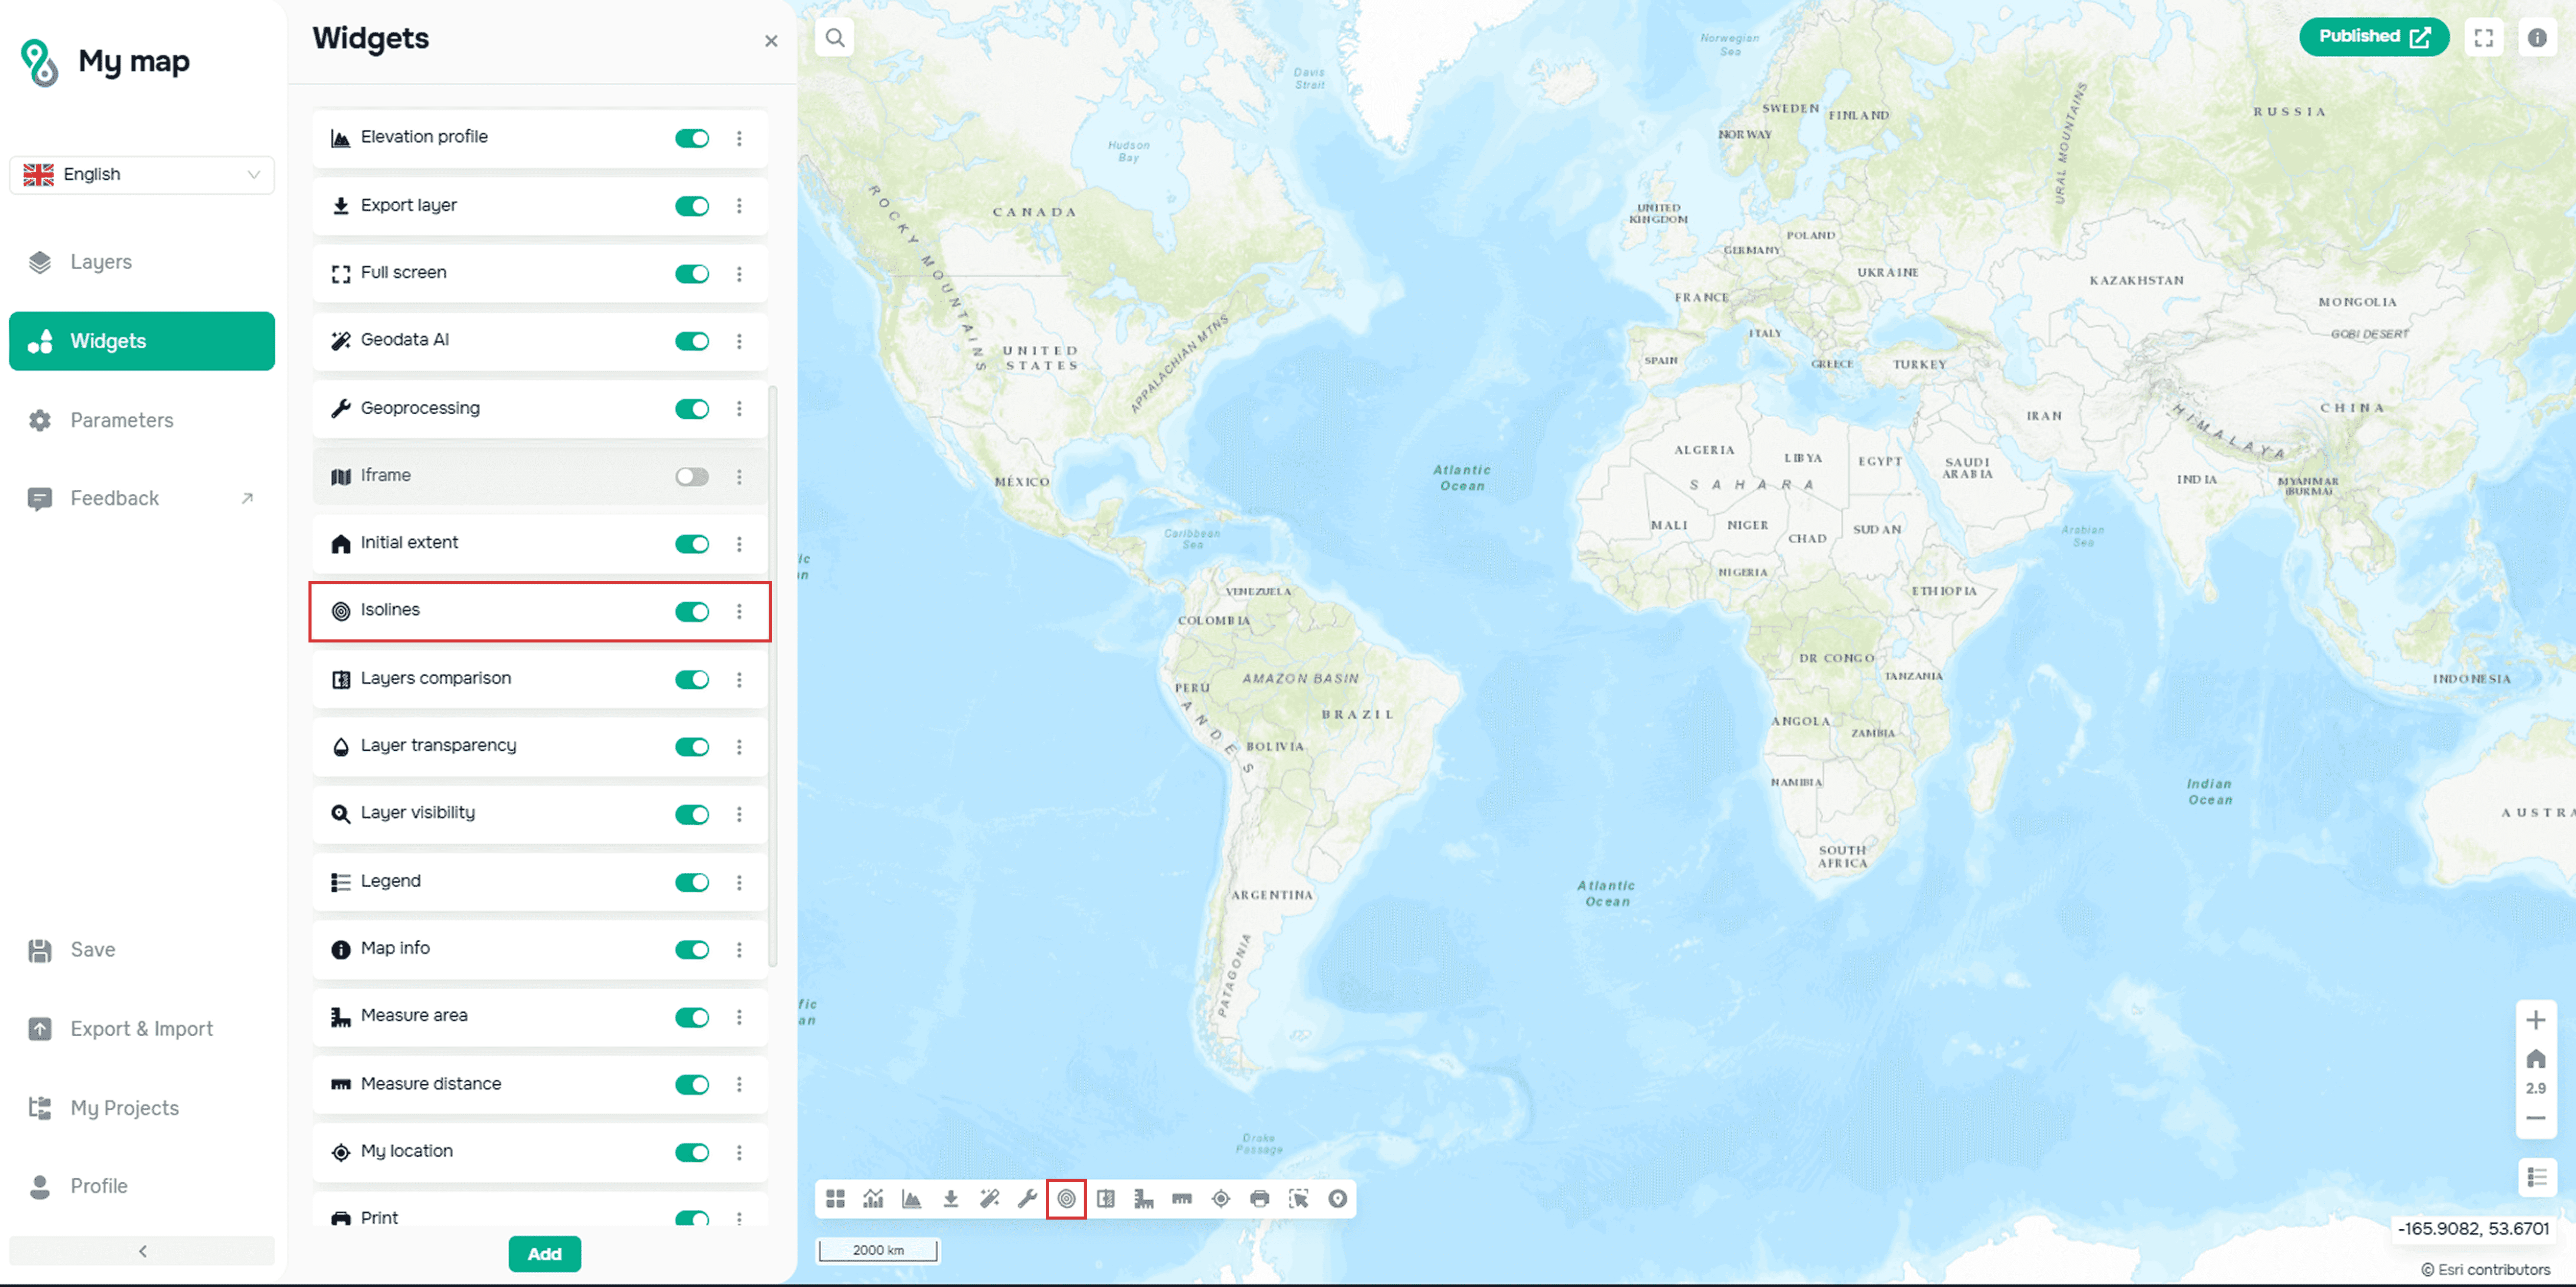
Widget de creación de isolíneas en la plataforma web cartográfica GISCARTA
El widget utiliza el DEM GEBCO, resolución de 500 m, como base para trazar isolíneas.
A continuación, debe configurar los siguientes parámetros:
– el intervalo entre líneas

Configuración de parámetros del widget de isolíneas: frecuencia
– unidades de medida
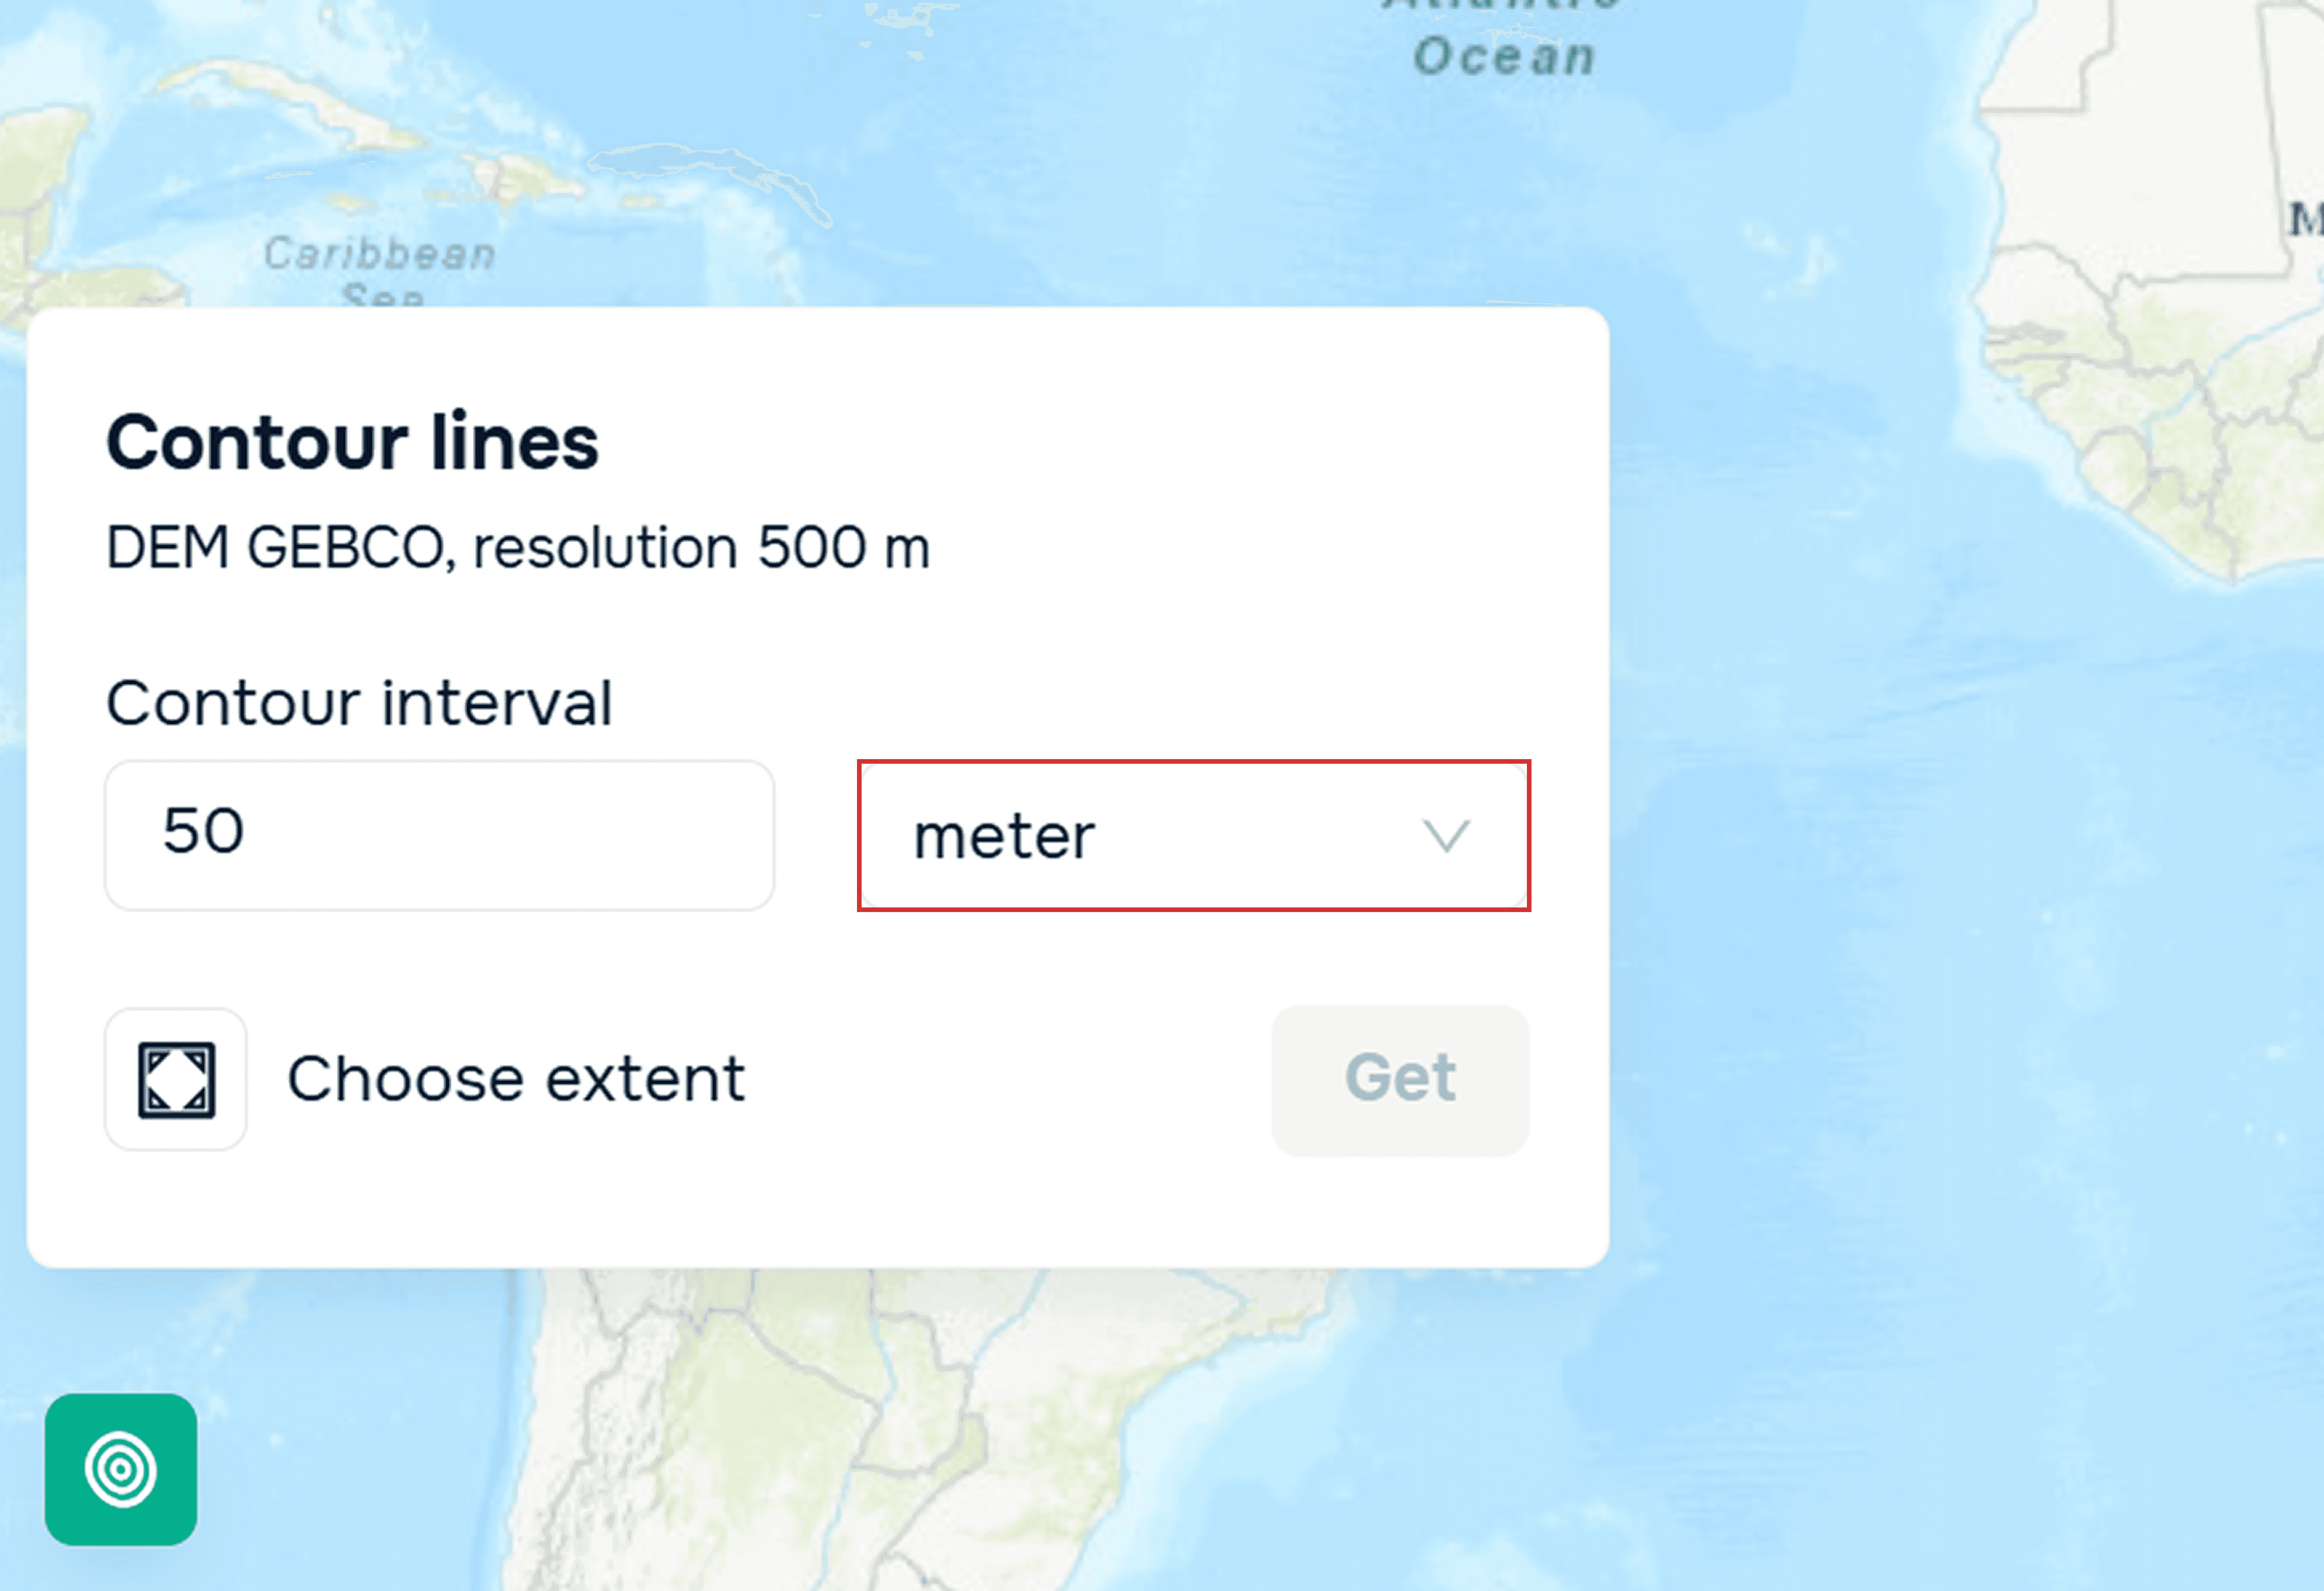
Configuración de parámetros del widget de isolíneas: unidades de medida
Luego debe seleccionar la extensión y hacer clic en el botón Obtener.
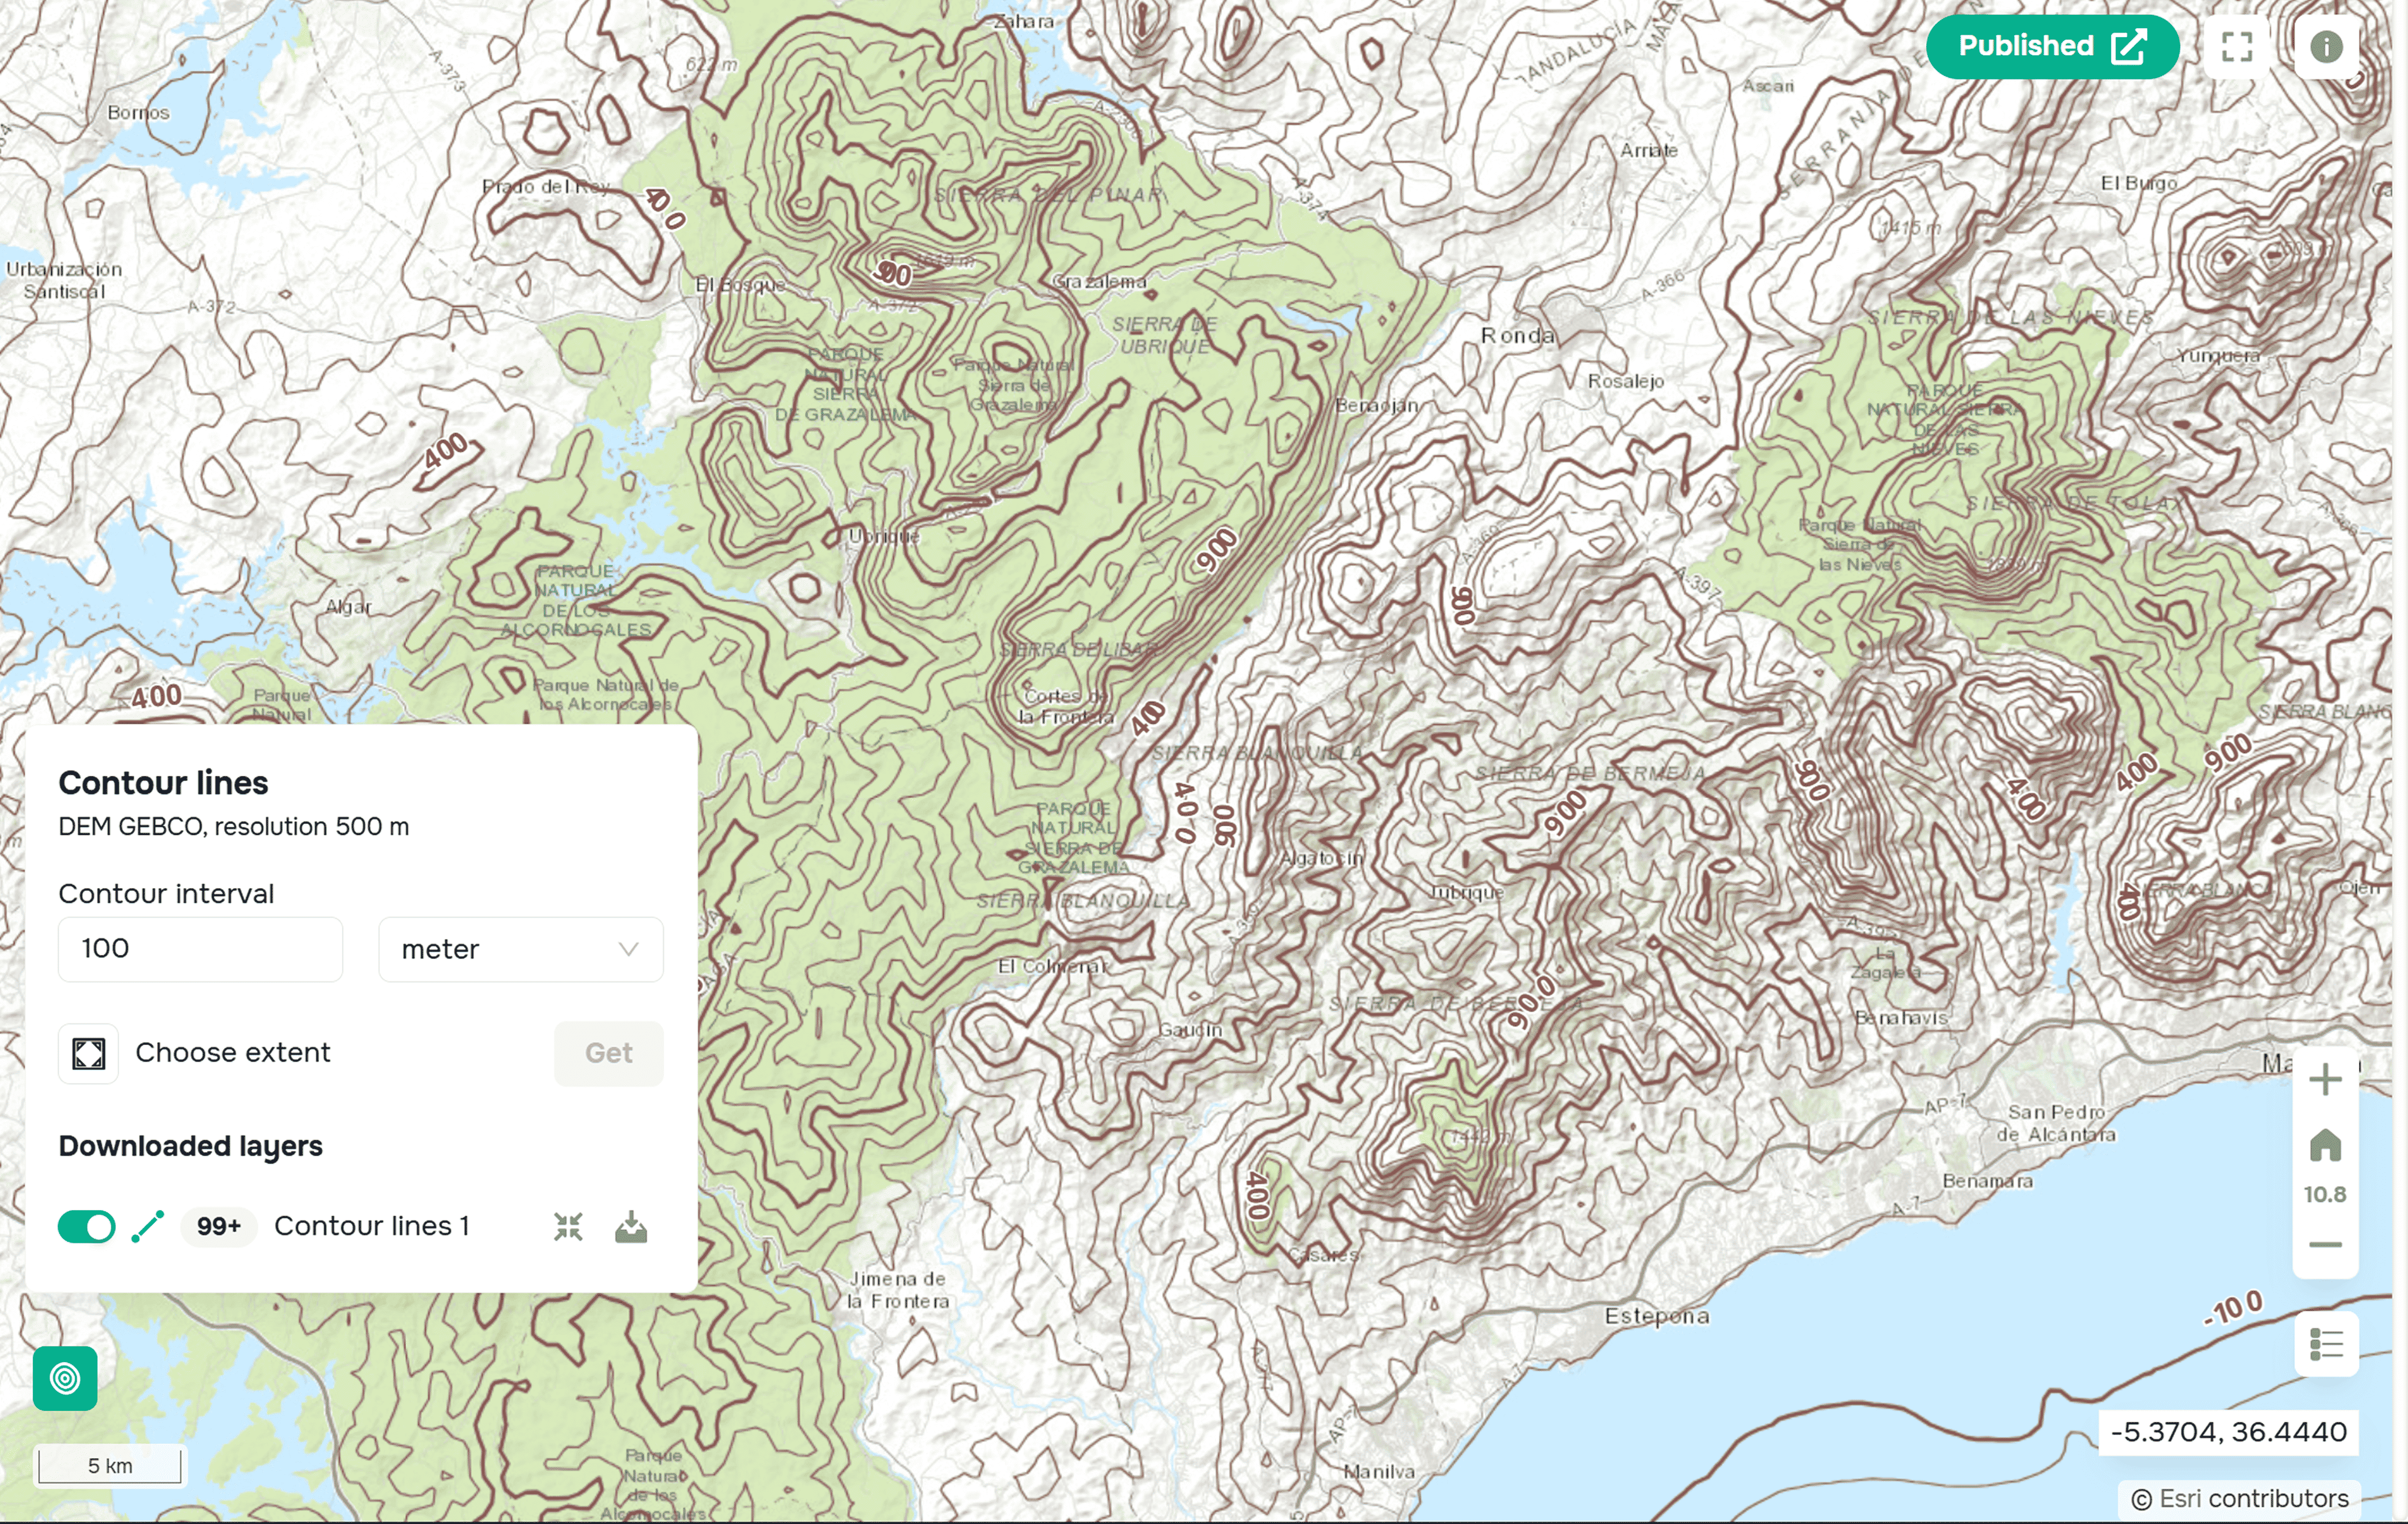
Isolíneas listas, construidas con el widget Isolíneas en la plataforma GISCARTA
Después del procesamiento en el widget, la capa resultante puede añadirse a su base de datos.
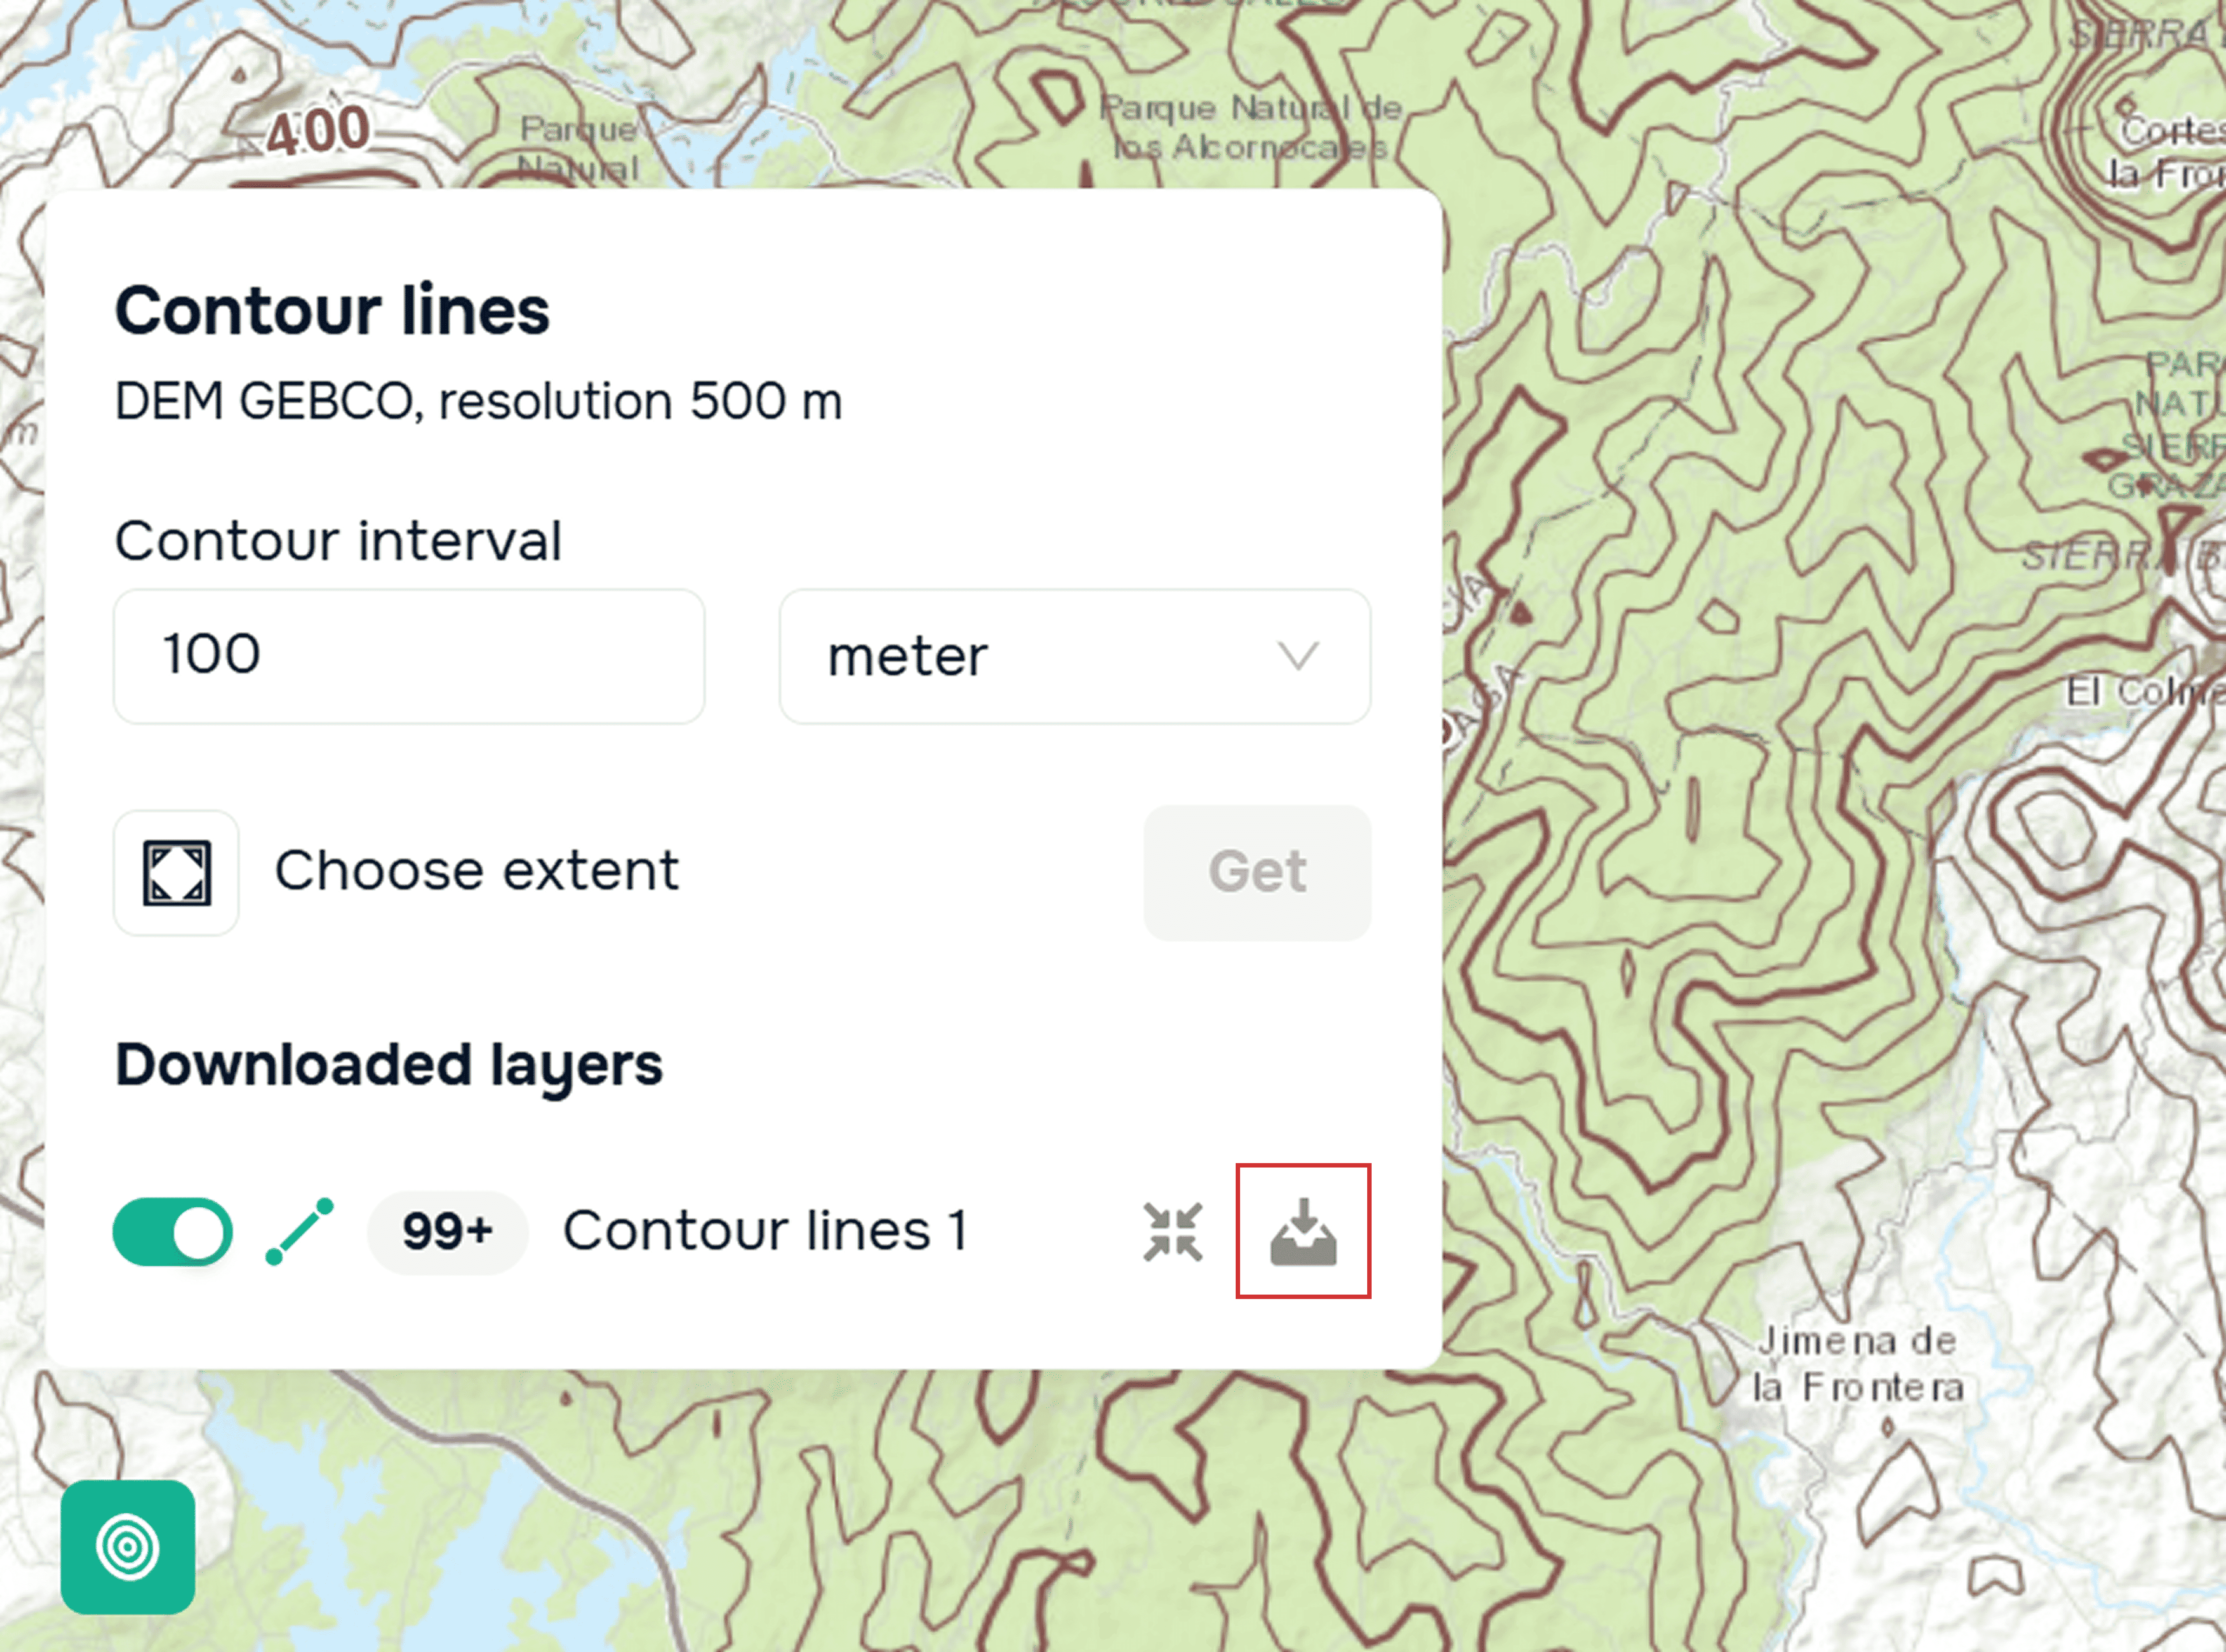
Exportación de una capa vectorial con isolíneas en la plataforma GISCARTA
Conclusión
Las curvas de nivel siguen siendo uno de los métodos más visuales y versátiles para analizar datos de elevación. Herramientas web modernas como GISCARTA permiten trabajar con curvas de nivel sin preparación compleja de datos ni software especializado.
Conclusiones clave
La precisión de las curvas de nivel depende de la calidad del DEM.
El ruido, los errores y la resolución insuficiente en el modelo de elevación afectan directamente la forma de las curvas de nivel.
El intervalo de curvas de nivel debe coincidir con la escala del mapa.
El intervalo elegido define la legibilidad del mapa y su valor analítico más que el máximo detalle.
Los DEM globales sirven para el análisis; los DEM locales, para el diseño.
Los modelos globales funcionan bien para estudios regionales, mientras que para tareas de ingeniería se necesitan datos locales o de alta resolución.
Preguntas frecuentes
¿Por dónde debo empezar al crear curvas de nivel?
Comience con un DEM global abierto y elija un intervalo de curvas de nivel apropiado para la escala de su mapa.
¿Los DEM abiertos son adecuados para generar curvas de nivel?
Sí, los DEM abiertos son adecuados para la mayoría de las tareas cuando se comprenden su resolución y sus limitaciones.
¿Necesito software SIG de escritorio para trabajar con curvas de nivel?
No, las herramientas y widgets web modernos permiten crear y analizar curvas de nivel directamente en el navegador.


