This style is applicable to all spatial elements and refers to a single display for all objects in the layer. It is possible to customise the symbol, size, fill, border (see Figure 1).

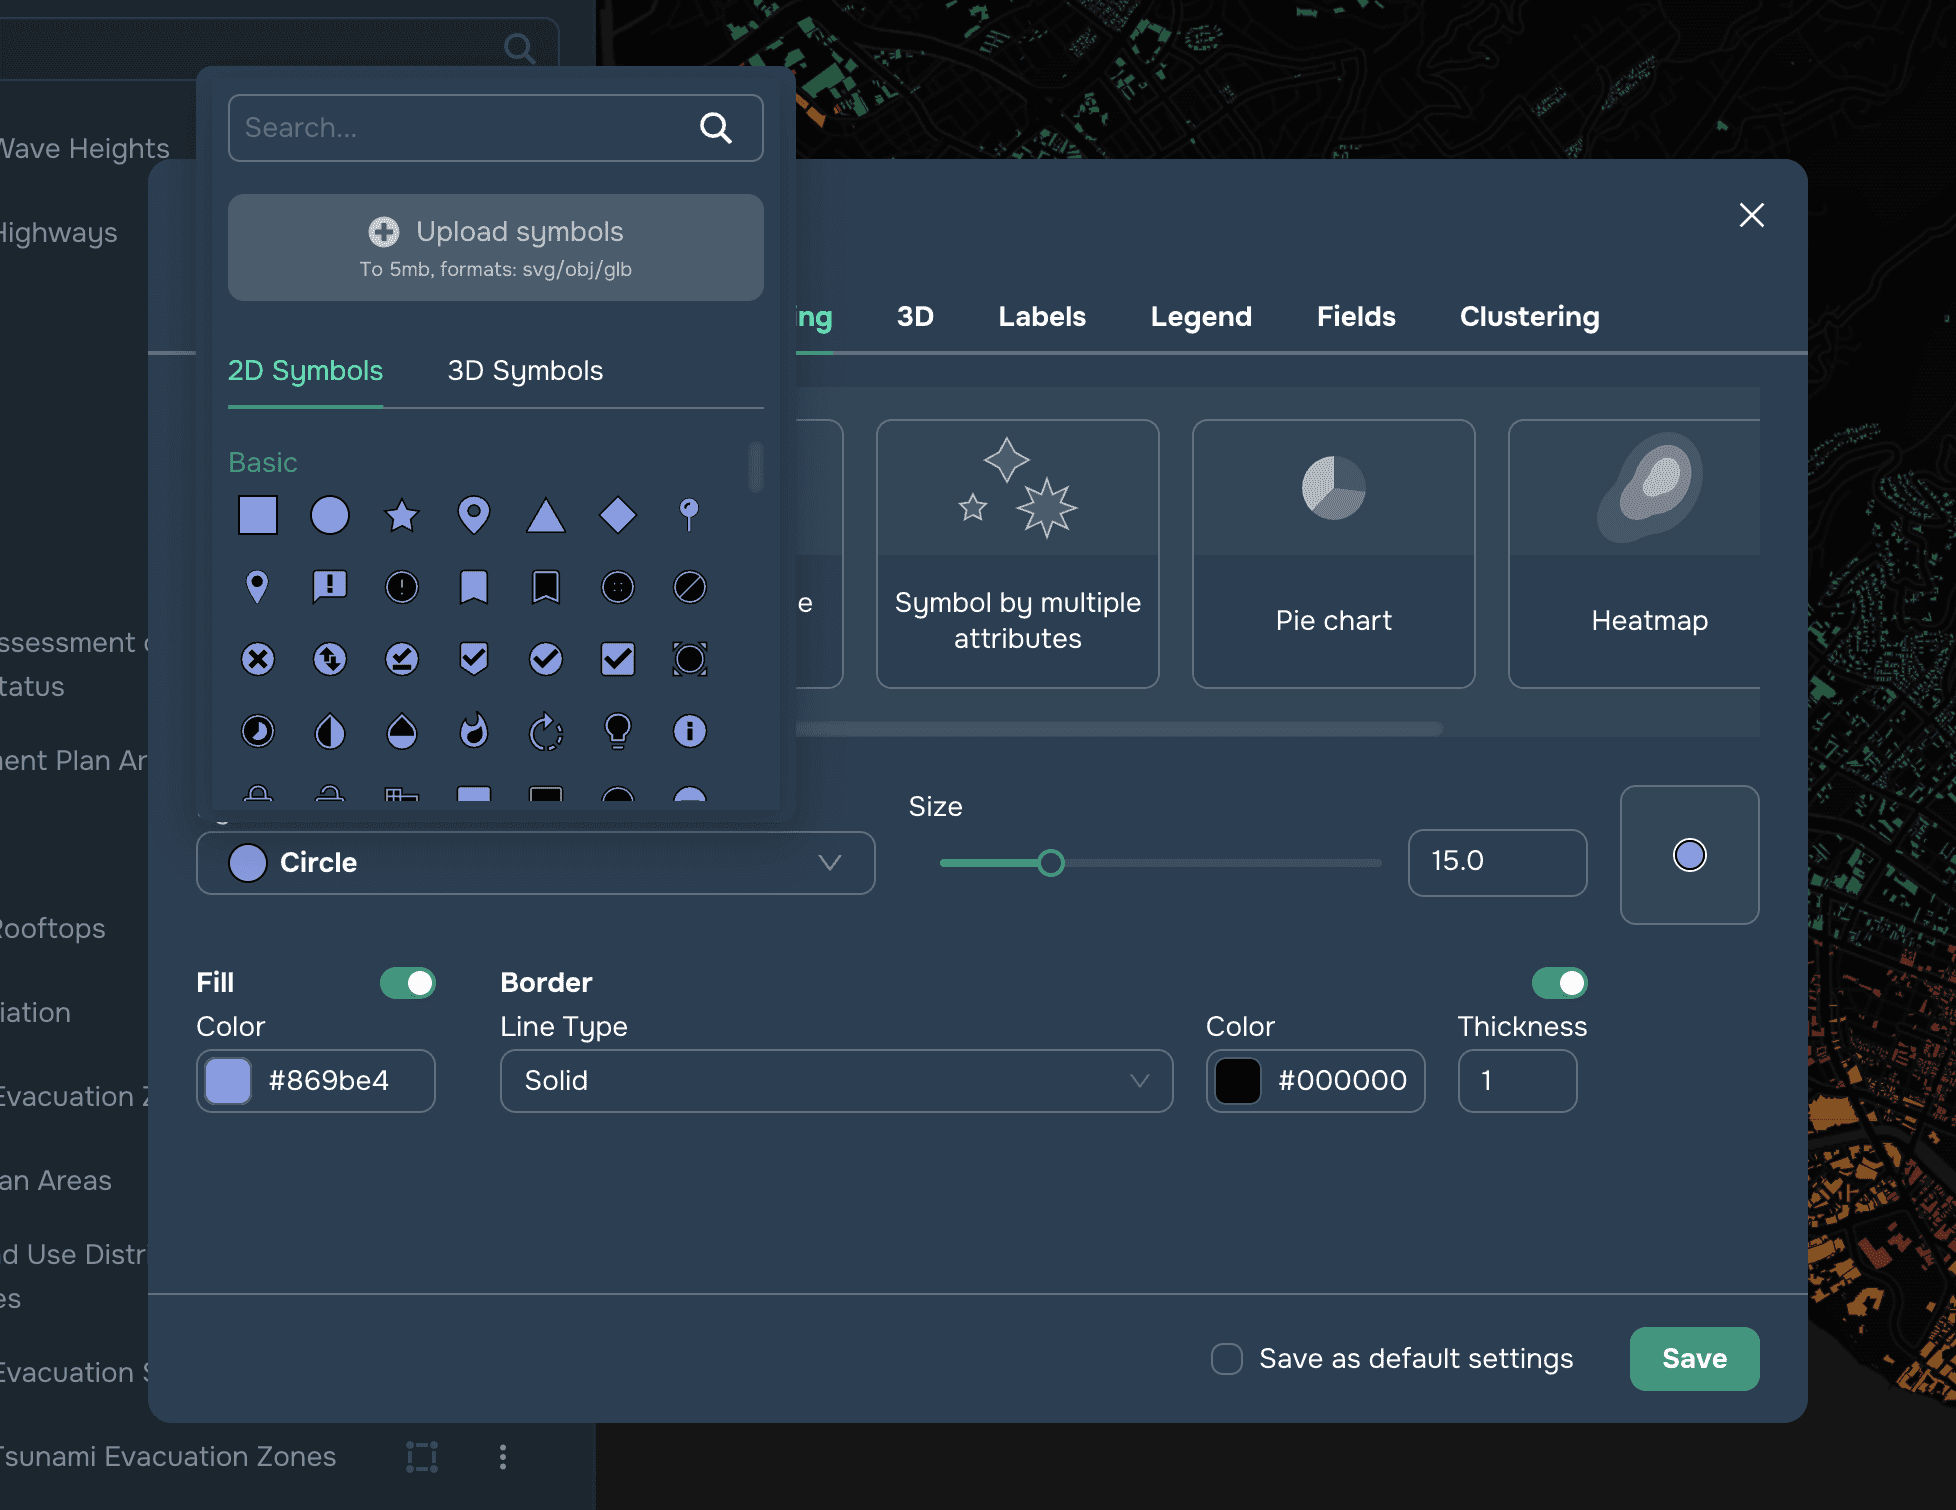
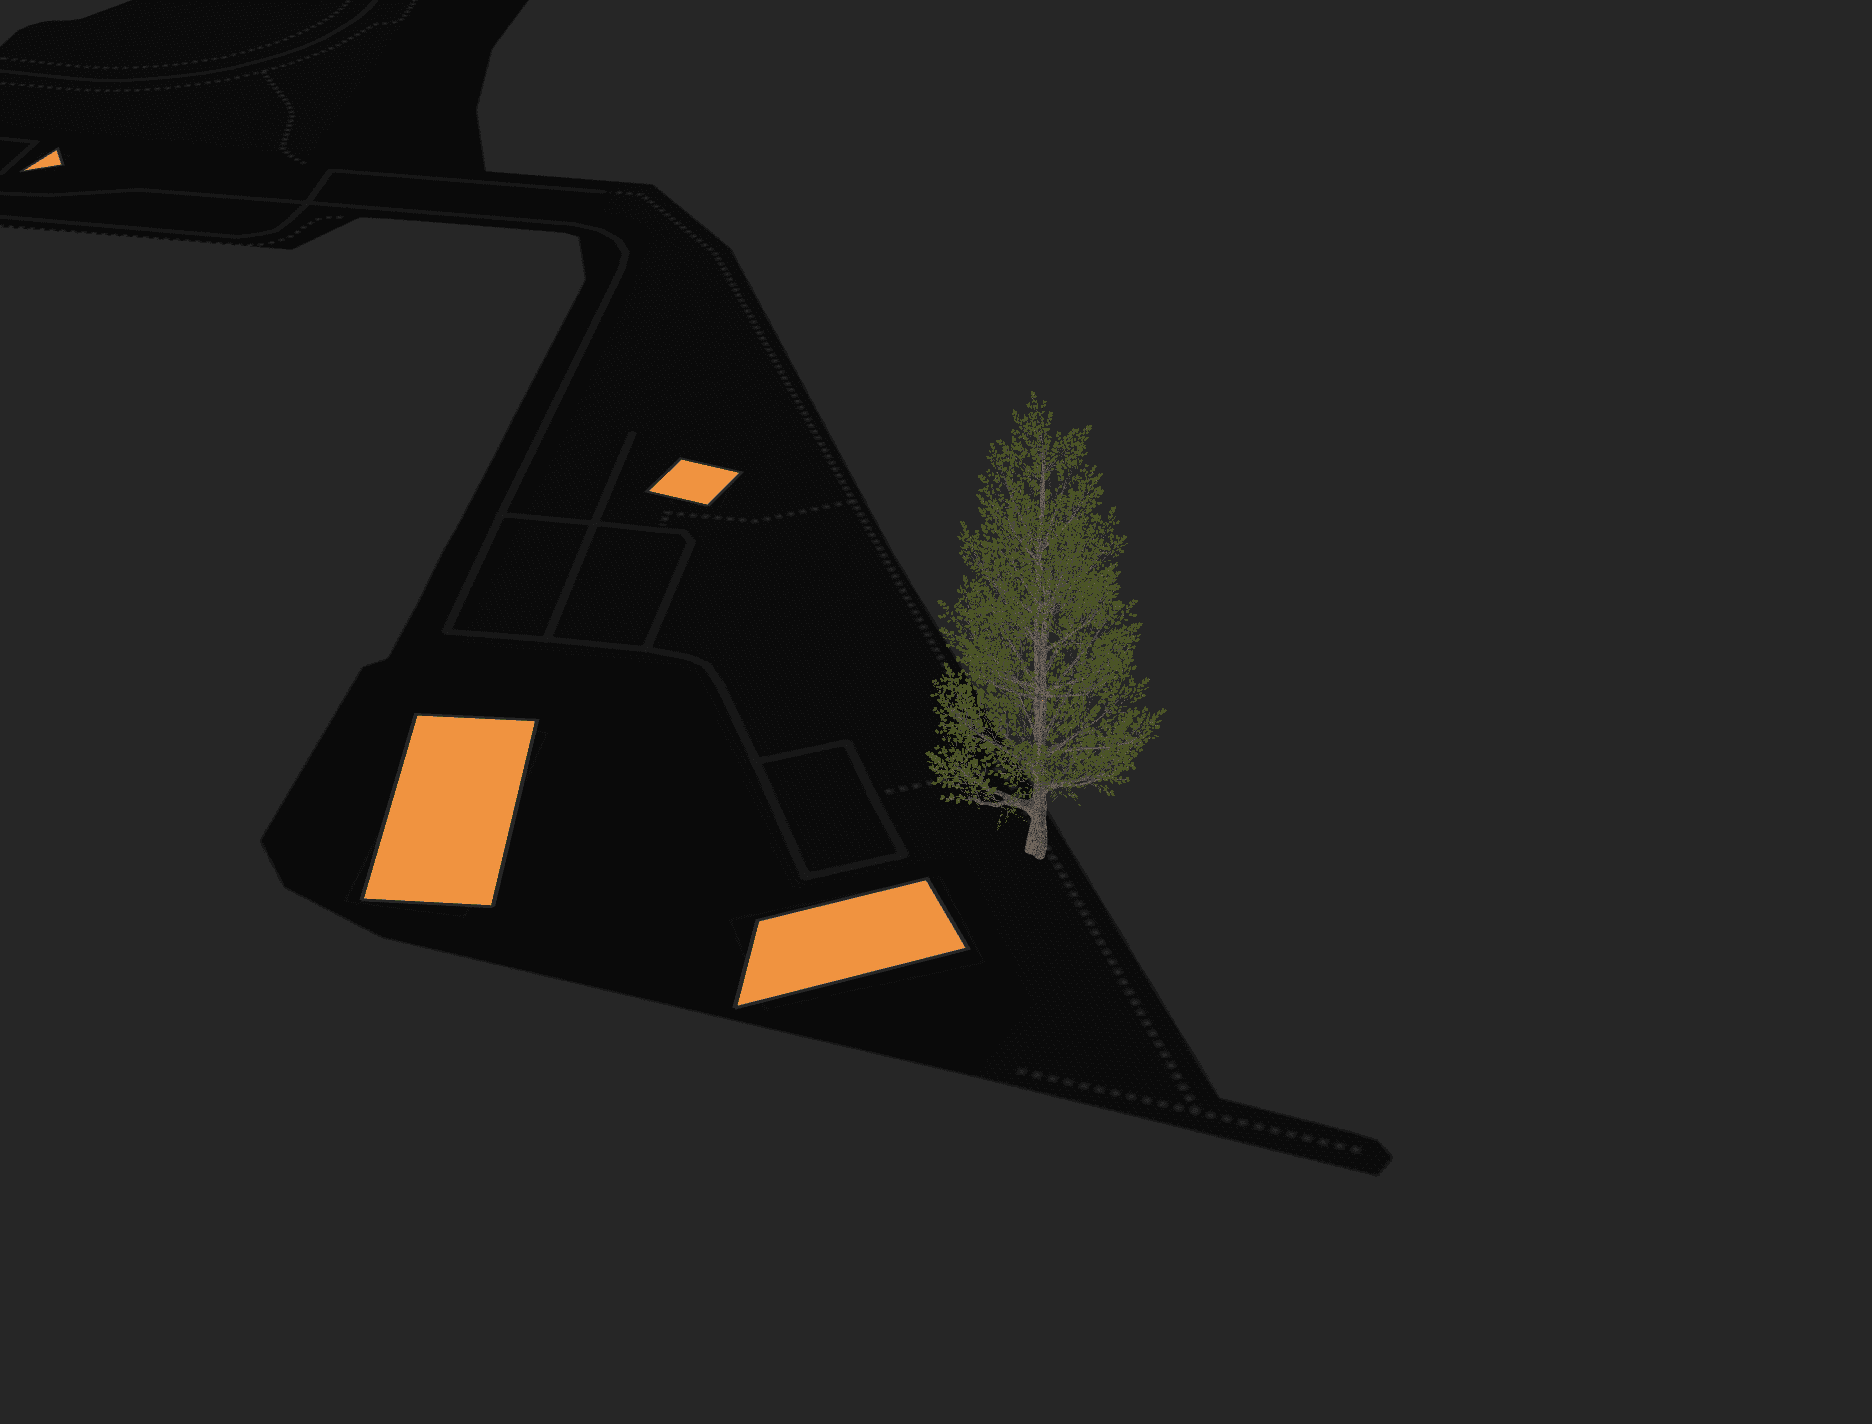
You can customize the symbol (for point objects) and you can also upload your own symbol in svg, obj, and glb formats up to 5 MB in size (see Figure 2). Obj and glb models can only be applied to layers added as vectors and displayed in 3D map view mode (see Figures 3).
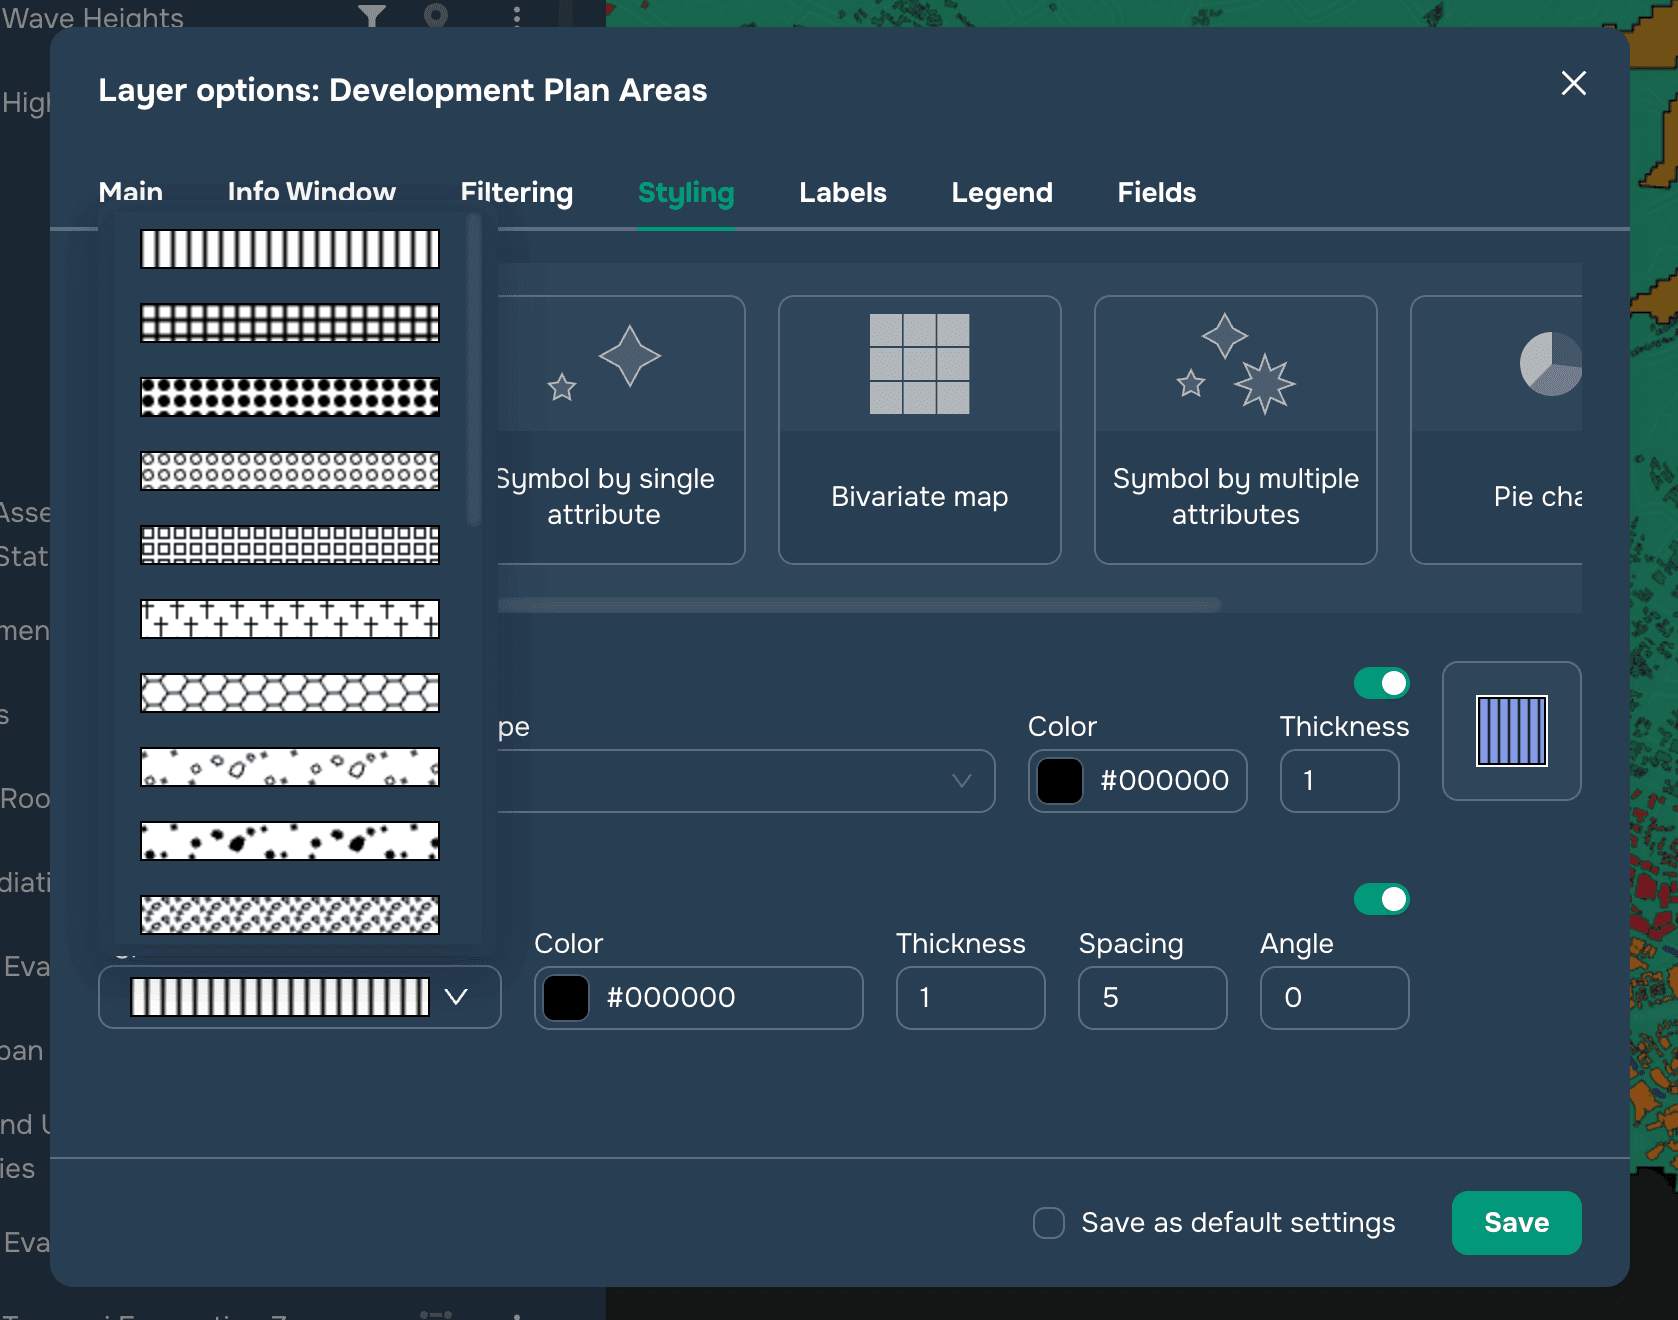
You can customize the size, fill, border and hatch for polygonal objects (see Figure 4), stroke, line pattern for linear objects (see Figure 5).

Symbol by single attribute
This style is applicable to all spatial elements and refers to a display set by one of the layer’s attributes. To do so, select an attribute from the drop-down list and then set up the styling for the values of this attribute.
For text attributes, it is possible to automatically load all values by selecting the "Unique values" method and clicking the "Set" button (see Figure 1).


For numeric attributes, you can set intervals using the following methods (see Figure 1):
Equal intervals is a method that will divide the range of values into equal-size classes. For example, three classes for the range of values from 0 to 300 will be created with the following ranges: 0 — 100, 101 — 200, 201 — 300.
Equal number (quantile) is a method that will split the range of values into classes equal to the number of objects within each class.
Natural Breaks (Jenks optimization) is a method that will split the range of values into classes, the differences between values within which will be maximal.
Now you can set the symbol style for each of the set values separately or apply the general settings to all values by clicking on the "Gears" icon next to the word Symbol (see Figure 2). General settings include selecting a palette or fill, and setting the look and size of the symbol.
You can also specify value aliases for the Legend widget.


Symbol by multiple attributes
This style is applicable to Point layers and refers to a display adjusted by several layer attributes. Here you can set the display of attributes in three categories (see Figure 1):

By symbol
By color
By size
To do so, select the attribute for each category and the way it will be set: Unique values or interval types (see Symbol by single attribute). You can also configure the values and styles manually.
You can also specify value aliases for the Legend widget.

Bivariate map
This style is applicable to all types of geometry, but is most often used for polygonal layers. In this case, stylization is based on 2 numeric attributes, for each of which 3 intervals are generated and, accordingly, 3 colors. Then these colors intersect and a 3x3 matrix with 9 colors is obtained. In other words, the bivariate choropleth style shows the dependence of two attributes on each other and allows you to clearly represent this on the map. In the style settings (Figure 1), you need to select numeric attributes, interval types (see Symbol by single attribute) and colors.

You can also customize the axis labels and change the border, symbol and size (if a point layer is configured) by clicking on the gear. Figure 2 shows the legend of this style on a map.

Pie chart
This style is applicable for point layers and refers to displaying a chart at a point that is set by several layer attributes. Here you can set the point size (see Figure 1) based on a numeric attribute by selecting one of several options: Unique values or interval types (see Symbol by single attribute).

In addition, you can specify the numeric fields used to construct the pie chart (see Figure 2). The sectors are divided according to the share of each of the attributes in the total for each object (see Figure 3). User can also customise the type of chart: Pie, Donut, Bar. And choose a style: 2D or 3D (see pictures 4, 5, 6)


pie chart


Donut chart

Bar chart
Heatmap
This style is applicable to point type geometry and allows you to configure the display as a heatmap. When configuring this style, you can choose a numeric attribute for the degree of change for the point color intensity. If an attribute is not selected, then all points are set to the same intensity and a heatmap is created based on the point density distribution. If an attribute is selected, each point will be weighted by the attribute’s value. A point weight can vary from 0 to 1. If the value is greater than 1, then the point weight is set to 1. If the value is less than 0, then the point weight is set to 0. Therefore, an attribute with a weighted value between 0 and 1 is needed in order to get correct results.
You can also change the gradient palettes, the point radius and its blurring. In the "Alias" column, the caption for the Legend widget can be set.

