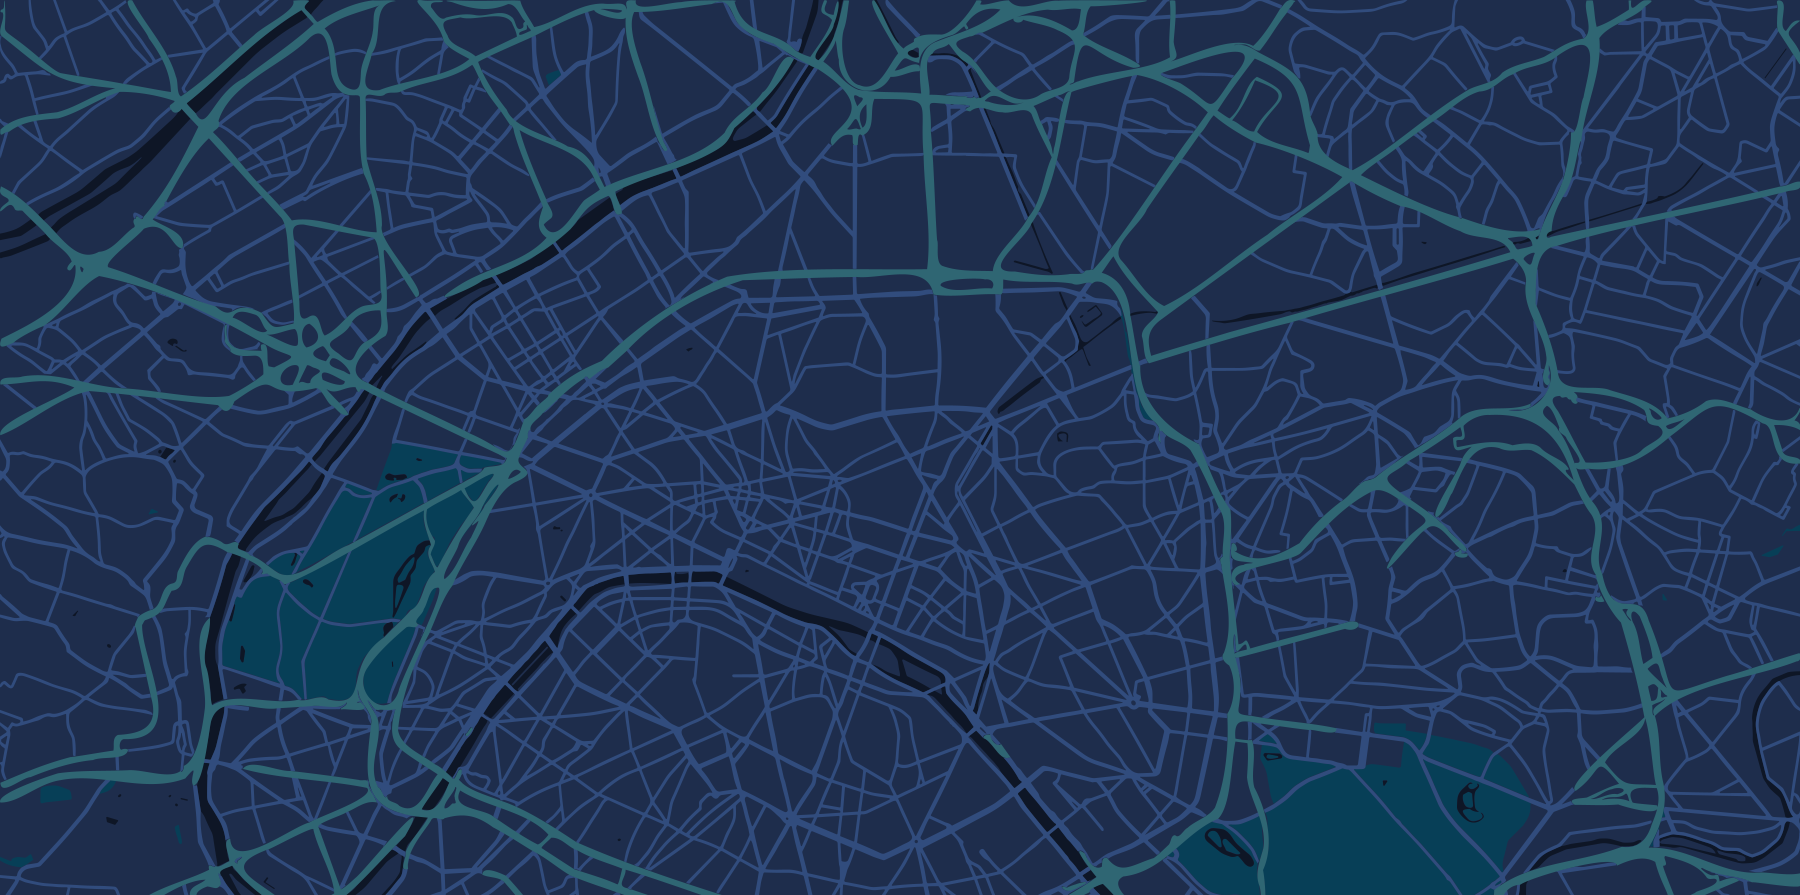
GIS in Real Estate
GIS in Real Estate
You can build interactive maps, bring all your data into one view, and run geospatial analysis to support site selection and coverage planning.
You can build interactive maps, bring all your data into one view, and run geospatial analysis to support site selection and coverage planning.

Real estate teams juggle data in many files and tools. Decisions take too long, and insights are hard to share. GISCARTA puts maps, data, and analysis in one place, so managers can compare sites, understand catchments, and explain choices with clarity.
Real estate teams juggle data in many files and tools. Decisions take too long, and insights are hard to share. GISCARTA puts maps, data, and analysis in one place, so managers can compare sites, understand catchments, and explain choices with clarity.
Real estate teams juggle data in many files and tools. Decisions take too long, and insights are hard to share. GISCARTA puts maps, data, and analysis in one place, so managers can compare sites, understand catchments, and explain choices with clarity.
Quick checklist
Quick checklist
Quick checklist
Centralize property, market, and competitor layers
Compare candidate sites side by side on a live map
Share a dashboard link with stakeholders
Capture comments and decisions in one workspace
Why GIS for Real Estate with GISCARTA
Why GIS for Real Estate with GISCARTA
You get a focused toolkit for site selection. GISCARTA combines mapping, data integration, and location intelligence so your team can move from questions to answers in minutes.
You get a focused toolkit for site selection. GISCARTA combines mapping, data integration, and location intelligence so your team can move from questions to answers in minutes.
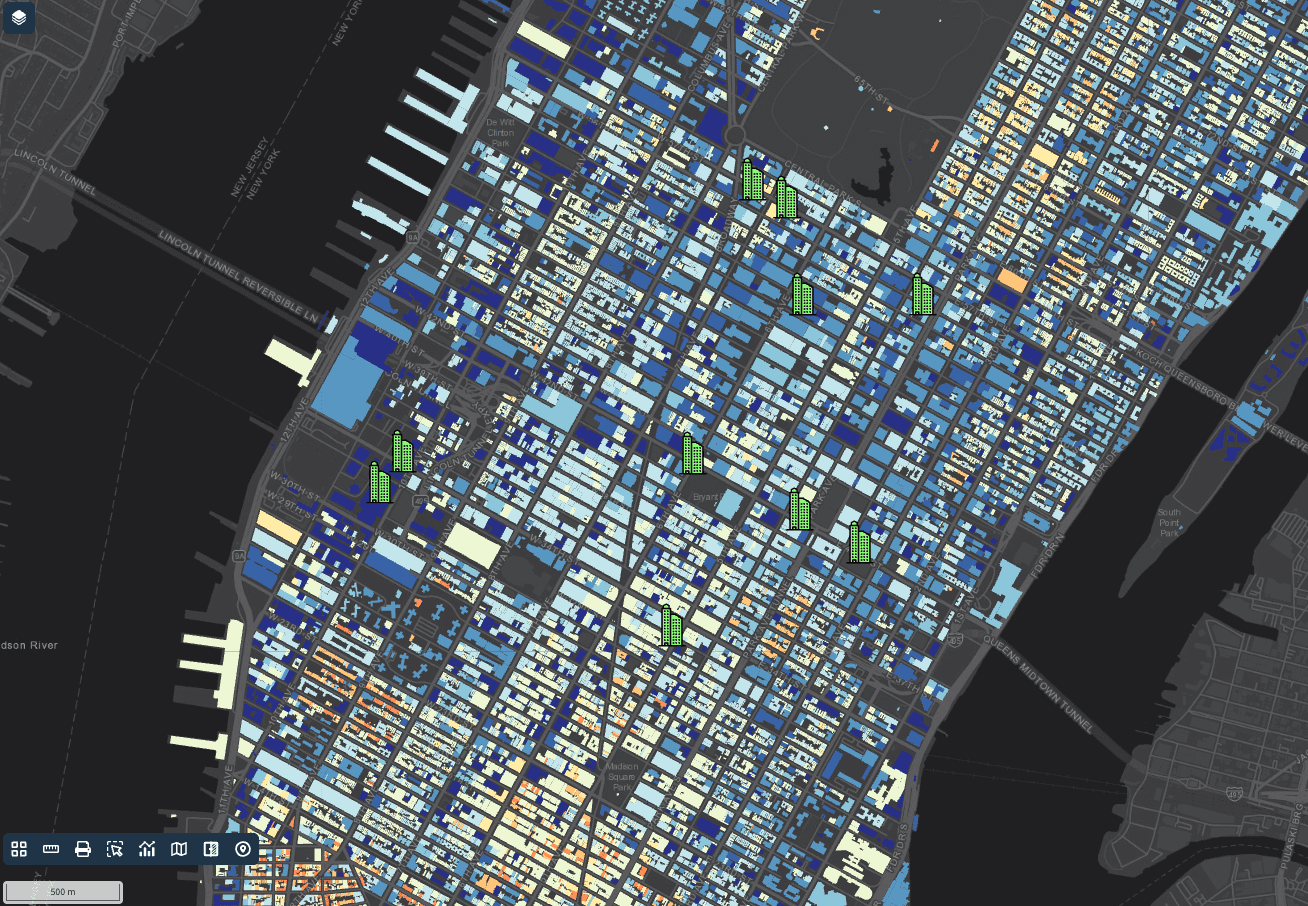

Data integration
Data integration
Data integration
Bring in spreadsheets, shapefiles, and common geospatial formats. Add open data or licensed datasets where needed. Keep your layers organized with clear names and simple filters.
Load points, lines, and polygons
Tag layers by region or project
Control visibility at a click
Bring in spreadsheets, shapefiles, and common geospatial formats. Add open data or licensed datasets where needed. Keep your layers organized with clear names and simple filters.
Load points, lines, and polygons
Tag layers by region or project
Control visibility at a click
Interactive mapping and dashboards
Interactive mapping and dashboards
Create live maps for markets, trade areas, and coverage. Build simple dashboards that highlight KPIs for each site.
Turn layers on and off to tell the story
Use search and filters to find locations fast
Share a view-only link or a workspace for collaboration
Create live maps for markets, trade areas, and coverage. Build simple dashboards that highlight KPIs for each site.
Turn layers on and off to tell the story
Use search and filters to find locations fast
Share a view-only link or a workspace for collaboration
Geospatial analysis
Geospatial analysis
Use practical tools that answer real questions. Analyze locations, compare options, and document decisions.
Draw or import trade areas
Measure distances and areas in metric units
Overlay context layers for planning
Use practical tools that answer real questions. Analyze locations, compare options, and document decisions.
Draw or import trade areas
Measure distances and areas in metric units
Overlay context layers for planning
Simple steps to get started
Simple steps to get started
Simple steps to get started
Simple steps to get started
Teams use GISCARTA to evaluate locations, align decisions, and reduce time to approval. The platform supports global datasets and enables secure sharing across departments, helping managers communicate plans with confidence
Teams use GISCARTA to evaluate locations, align decisions, and reduce time to approval. The platform supports global datasets and enables secure sharing across departments, helping managers communicate plans with confidence
Teams use GISCARTA to evaluate locations, align decisions, and reduce time to approval. The platform supports global datasets and enables secure sharing across departments, helping managers communicate plans with confidence
Create a project and name your market
Create a project and name your market
Step 1
Import site lists and context layers
Import site lists and context layers
Step 2
Build a dashboard with key metrics
Build a dashboard with key metrics
Step 3
Share the map with your team, then iterate
Share the map with your team, then iterate
Step 4
Outcomes
Outcomes
Faster shortlists and clear trade-off notes
Faster shortlists and clear trade-off notes
Faster shortlists and clear trade-off notes
Faster shortlists and clear trade-off notes
Less manual work across spreadsheets
Less manual work across spreadsheets
Less manual work across spreadsheets
Less manual work across spreadsheets
Maps and dashboards that non experts can read
Maps and dashboards that non experts can read
Maps and dashboards that non experts can read
Maps and dashboards that non experts can read
FAQ
FAQ
FAQ
FAQ
How is GIS used in real estate?
For three jobs mainly: site selection (which location performs best), market analysis (who lives and works within reach), and portfolio visibility (seeing every asset on one map instead of in a spreadsheet). Each is a mapping and catchment question rather than a valuation question.