Import candidate sites and existing stores
Add demographics, footfall and points of interest
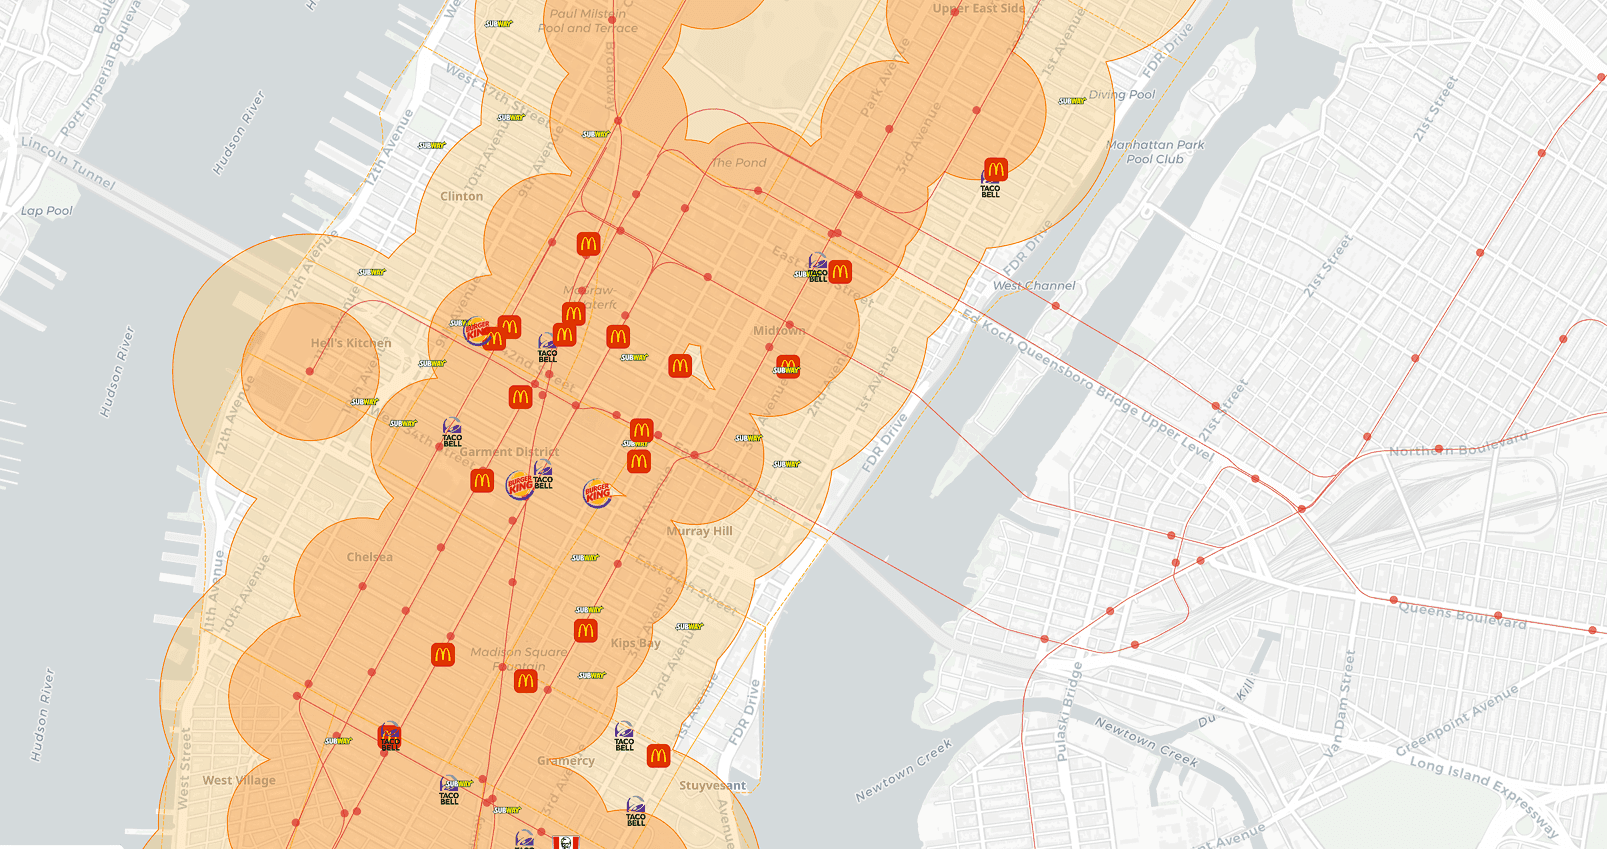
Map competitors and catchments at 500 m or 1 km
Share a link, gather comments and finalize
Bring spreadsheets and common GIS formats into a single workspace. Organize layers by region or project, apply simple filters and keep naming consistent.
Load points, lines and polygons
Tag sites by status and priority
Filter by attributes like rent band or frontage
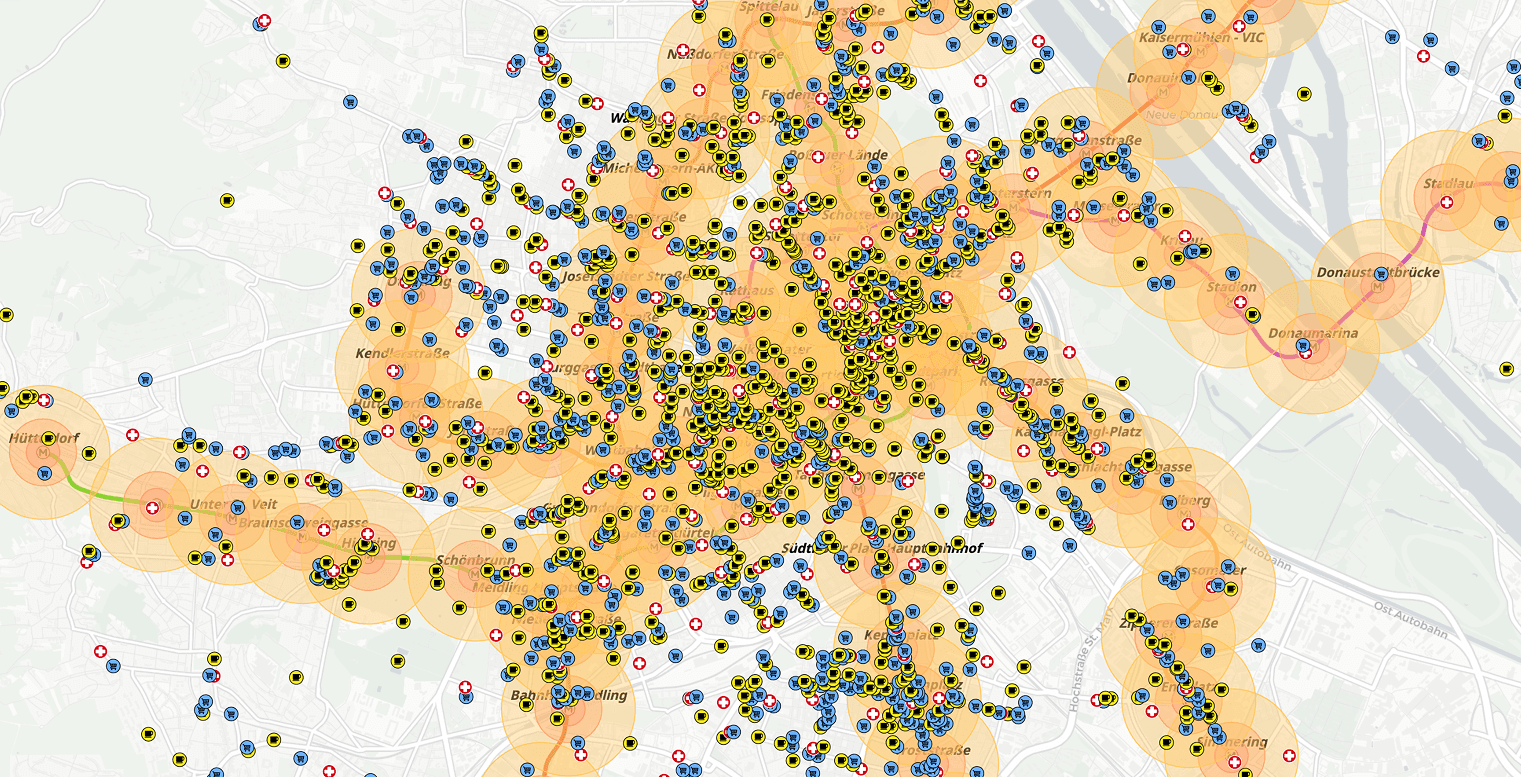
Create live maps that highlight trade areas and KPIs. Build dashboards to track store density, median income, or travel times.
Toggle layers to tell a clear story
Search addresses and features quickly
Save map views for leadership packs
Answer core questions with simple, reliable tools. Measure distances and areas in metric units, define buffers and compare scenarios.
Draw 500 m and 1 km catchments for cannibalization checks
Overlay competitors and target segments
Score candidate sites and record decisions
Keep one source of truth from scouting to launch. Reduce email threads and version drift.
Role-based view and edit access
Comments on layers and specific sites
Project folders for markets and waves
What does GIS analytics software do for retail?
It answers where questions with data: where to open, which catchment a store actually serves, where competitors overlap, and which areas are underserved. The output is a map and a dashboard rather than a spreadsheet model.