GIS for Agriculture

GIS for Agriculture

GISCARTA delivers GIS for agriculture so teams can map fields, monitor crops and act on timely insights. Bring soil, weather and management data into one place, then use interactive mapping and geospatial analysis to plan operations and predict outcomes.

GISCARTA delivers GIS for agriculture so teams can map fields, monitor crops and act on timely insights. Bring soil, weather and management data into one place, then use interactive mapping and geospatial analysis to plan operations and predict outcomes.

GIS for agriculture map showing crop blocks and field boundaries

What problems we solve

What problems we solve

Agriculture teams track many datasets in separate tools. Field notes, soil tests and satellite layers do not line up. GISCARTA unifies layers and views, helping growers and advisors compare blocks, flag risks and explain choices to stakeholders.

Agriculture teams track many datasets in separate tools. Field notes, soil tests and satellite layers do not line up. GISCARTA unifies layers and views, helping growers and advisors compare blocks, flag risks and explain choices to stakeholders.

What problems we solve

Agriculture teams track many datasets in separate tools. Field notes, soil tests and satellite layers do not line up. GISCARTA unifies layers and views, helping growers and advisors compare blocks, flag risks and explain choices to stakeholders.

Quick setup checklist

Create a farm or region project

Import field boundaries and crop blocks

Add soil layers, imagery and historic yields

Share views with teams and partners

Key capabilities for growers and agronomists

Key capabilities for growers and agronomists

GISCARTA focuses on practical tools that support crop monitoring, Land Suitability Assessment, soil management and yield prediction.
Geospatial analysis dashboard comparing soil and yield layers

Collaboration in the field

Collaboration in the field

Collaboration in the field

Work with agronomists and advisors in one source of truth. Capture notes in context and keep records clear.
  • Role-based view and edit access
  • Calculate precise field sizes
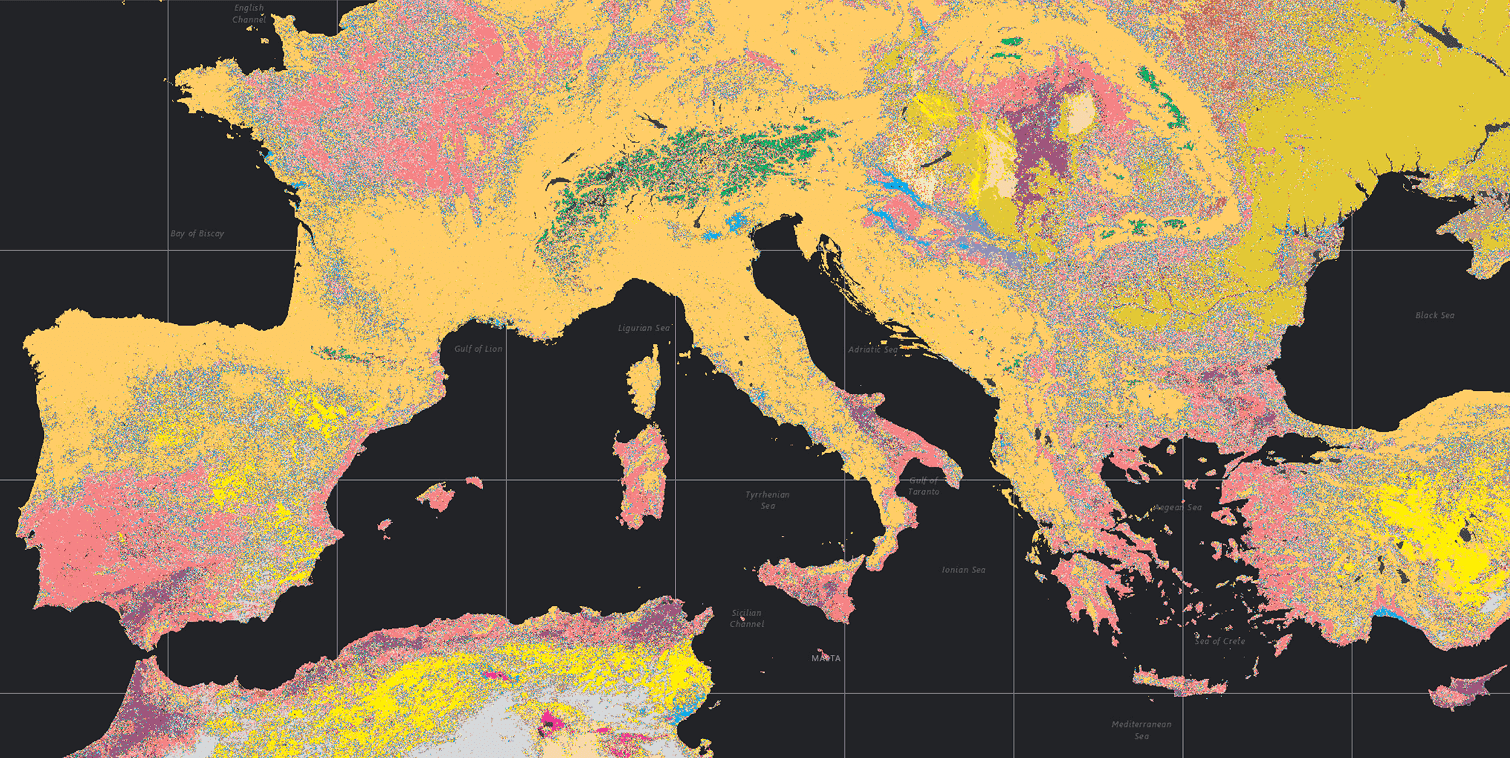
  • Analyze vegetation health and crop stress via infrared images

Geospatial analysis for agriculture

Geospatial analysis for agriculture

Geospatial analysis for agriculture

Use simple tools to quantify patterns. Measure distances and areas in metric units, define buffers and compare scenarios.
  • Calculate block areas for input planning
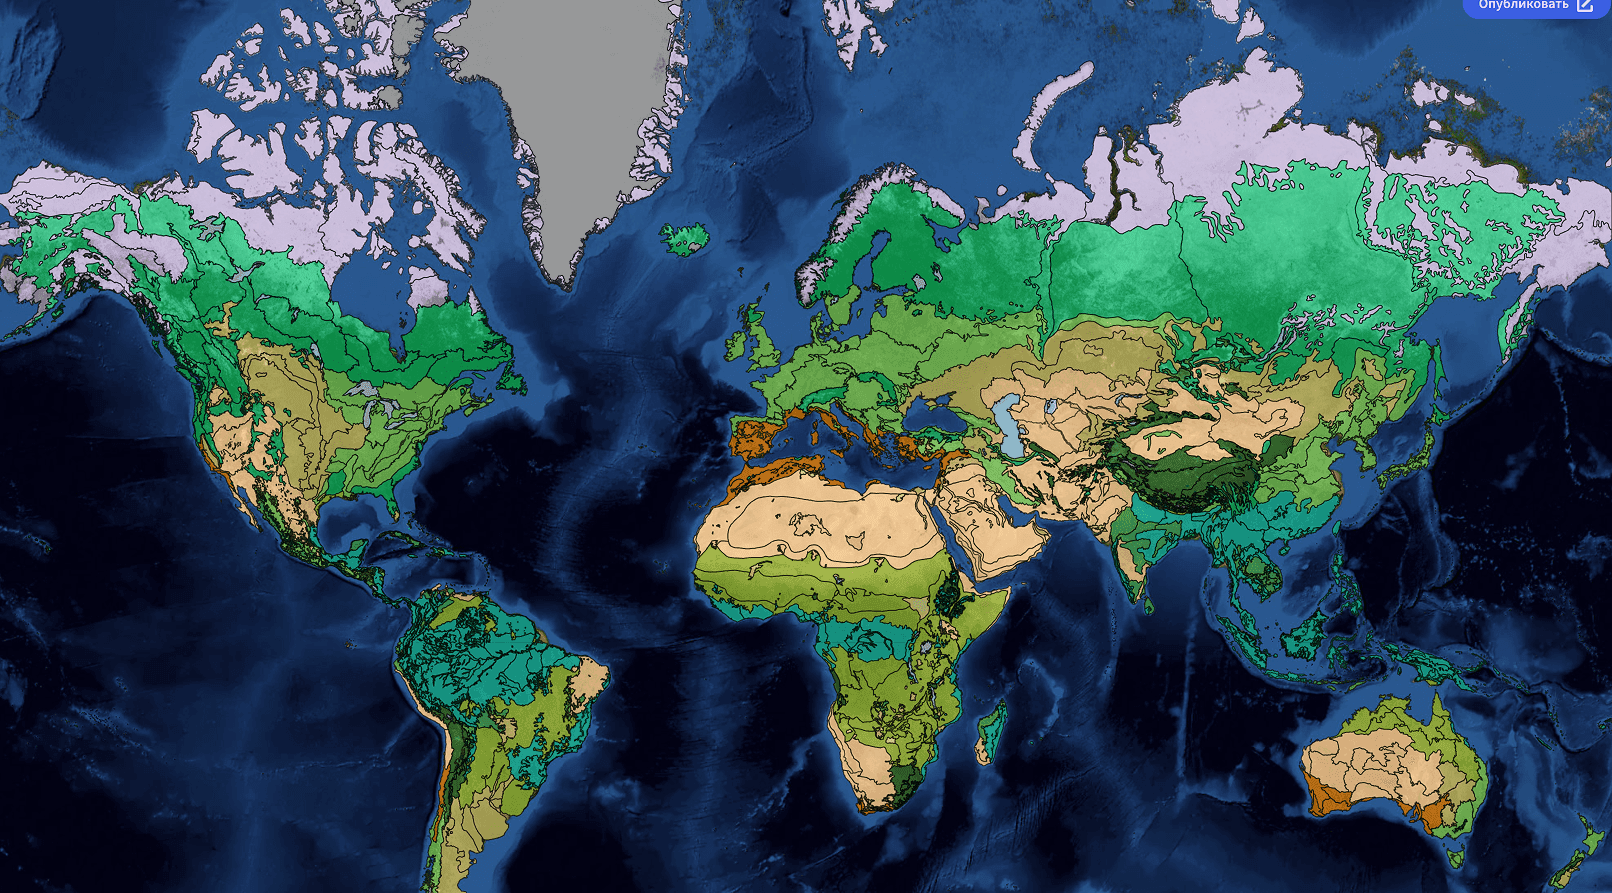
  • Overlay slope and soil texture for suitability
  • Compare crop performance across seasons

Interactive mapping and dashboards

Interactive mapping and dashboards

Interactive mapping and dashboards

Track conditions on a live map. Build dashboards that highlight KPIs such as vegetation index, soil moisture, or input use.
  • Toggle layers to tell a clear story
  • Search fields and filter by status
  • Save map views for audits and reports

Data integration

Data integration

Data integration

Bring spreadsheets and common GIS formats into a shared workspace. Keep layers organized by season, farm, or crop.
  • Load points, lines and polygons
  • Tag fields by variety and planting date
  • Filter by attributes like soil type or irrigation

Getting started with GIS for agriculture

Getting started with GIS for agriculture

Define field boundaries and blocks

Define field boundaries and blocks

Step 1

Import soil, weather and imagery layers

Import soil, weather and imagery layers

Step 2

Build a dashboard with priority metrics

Build a dashboard with priority metrics

Step 3

Share with your team, then iterate

Share with your team, then iterate

Step 4

Proof you can rely on

Proof you can rely on

Agriculture teams use GISCARTA to align field operations, reduce manual work and present evidence for decisions. The platform supports secure sharing and global datasets, helping managers coordinate across farms and regions.

Agriculture teams use GISCARTA to align field operations, reduce manual work and present evidence for decisions. The platform supports secure sharing and global datasets, helping managers coordinate across farms and regions.

Frequently Asked Questions

Frequently Asked Questions

Frequently Asked Questions

Frequently Asked Questions

What is GIS for agriculture and why use it?

How does geospatial analysis improve field planning?

Can we import data from existing farm systems?

Do non-GIS users need training?

Is it useful across regions and crops?

What is GIS for agriculture and why use it?

How does geospatial analysis improve field planning?

Can we import data from existing farm systems?

Do non-GIS users need training?

Is it useful across regions and crops?

What is GIS for education and how is it used in class?

Which subjects benefit from geospatial analysis?

Do students need prior GIS skills?

Can we use our own school datasets?

Is GISCARTA suitable for universities and schools?

What is GIS for agriculture and why use it?

How does geospatial analysis improve field planning?

Can we import data from existing farm systems?

Do non-GIS users need training?

Is it useful across regions and crops?

Result, you run clearer decisions from one map, powered by GIS for agriculture

Result, you run clearer decisions from one map, powered by GIS for agriculture

Result, you run clearer decisions from one map, powered by GIS for agriculture