Quick checklist
Create a city project and add districts and assets
Import site lists, networks and environmental layers
Build a simple dashboard with key indicators
Share a link and collect feedback in one workspace
Bring spreadsheets and common GIS formats into a single source of truth. Keep layers organized by project or region, apply simple filters and control visibility.
Load points, lines and polygons
Tag layers by department or theme
Use clear naming and metadata fields
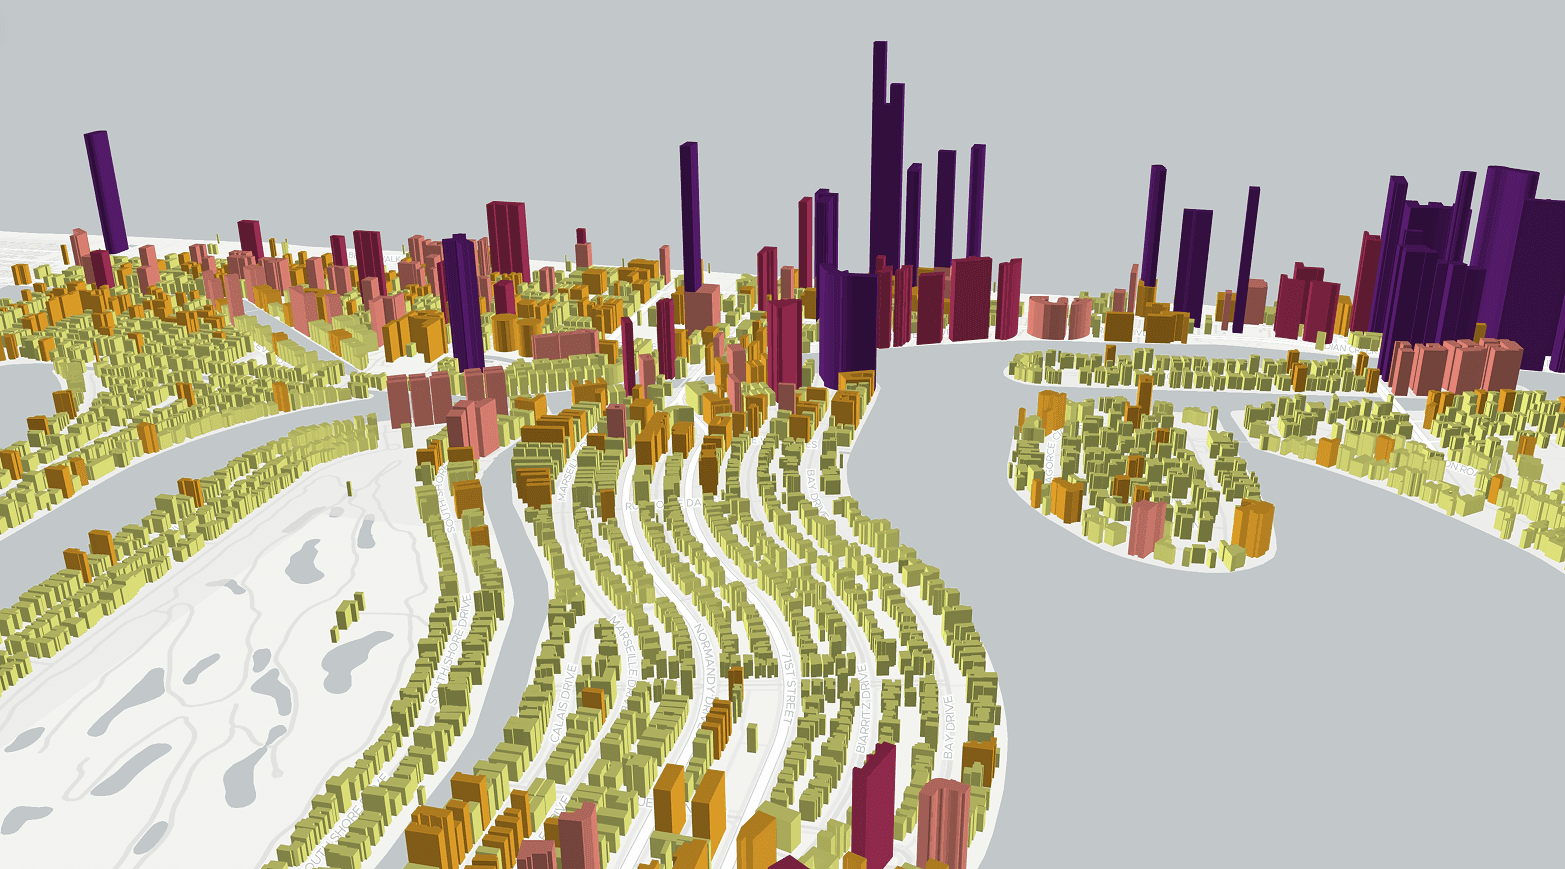
Build maps for land use, transport and services. Create dashboards that highlight KPIs per area, such as access to parks or distance to public facilities.
Toggle layers to tell a clear story
Search and filter assets by attributes
Share view-only links or invite editors
Use practical tools to answer core questions. Measure distances and areas in metric units, define buffers and compare scenarios.
Draw trade areas around stations at 500 m or 1 km
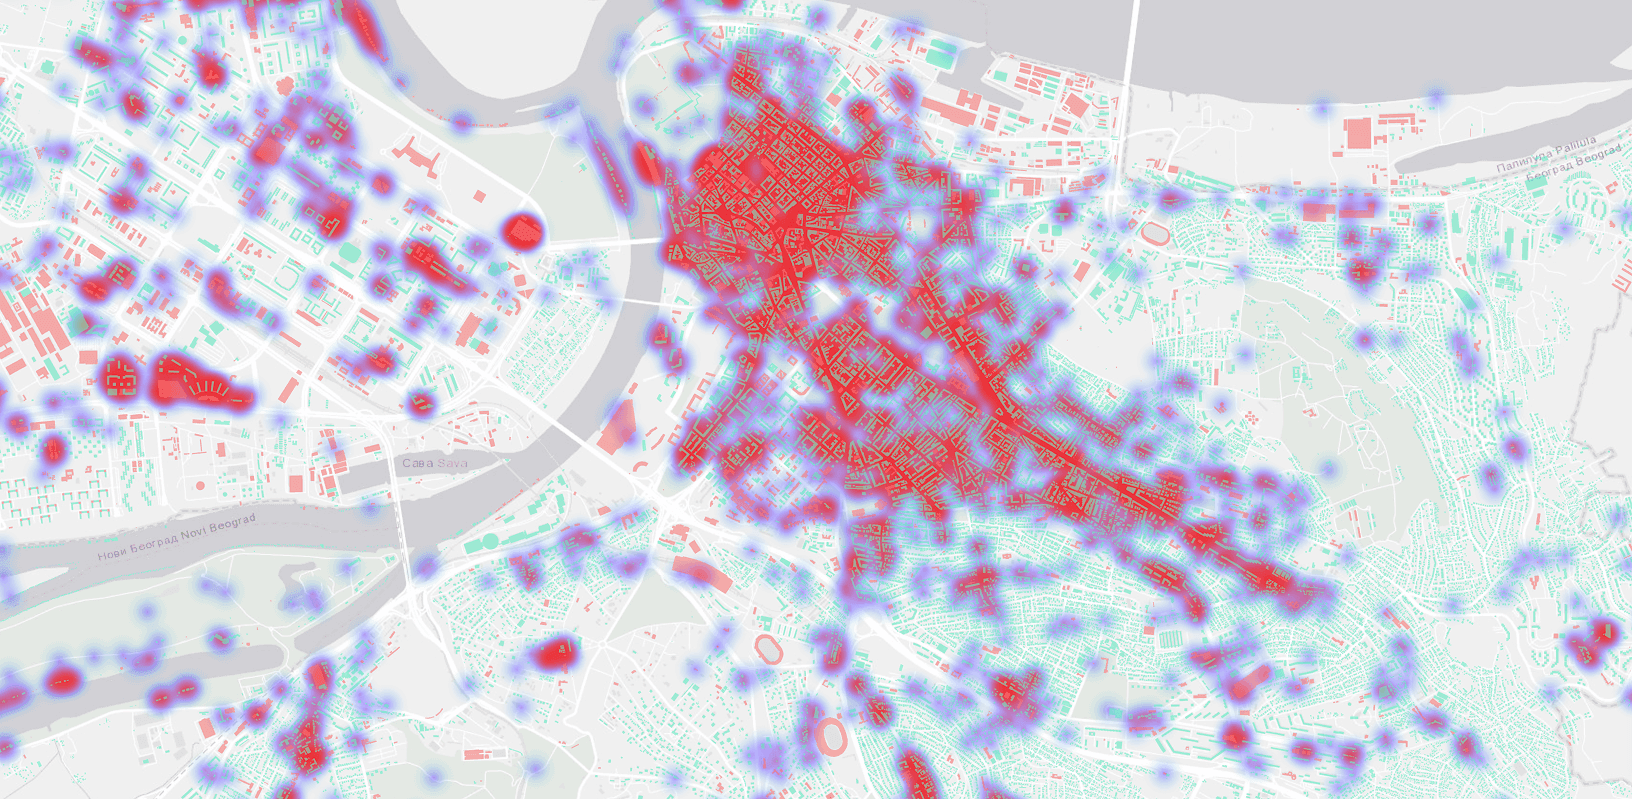
Overlay hazard zones and population layers
Capture notes and decisions on each map view
Work across departments without version chaos. Keep records of who changed what and ensure everyone sees the latest map.
Role-based access and audit history
Comments on layers and features
Project folders for districts and programs
Step 1
Step 2
Step 3
Step 4
What is GIS for urban planning and why use it?
It is a mapping approach that unifies city data on one live map. With GIS for urban planning, teams visualize assets, test scenarios and communicate plans with clear evidence.
