
In recent decades, climate change has become a key global issue. Rising average temperatures, more frequent extreme weather events, and the transformation of natural ecosystems require the systematic analysis of large data sets. At the core of this analysis are climate data-standardized, long-term observations of the atmosphere, oceans, and land.
The development of international monitoring programs and open scientific platforms has made climate information accessible to researchers, government agencies, and businesses worldwide.
What is climate data?
Climate data are systematic, long-term observations of atmospheric and hydrological processes. Unlike weather data, which describes the current state of the atmosphere, climate describes stable statistical parameters over a long period (usually at least 30 years). This standard is established by the World Meteorological Organization. Key climate variables include:
air temperature
precipitation
atmospheric pressure
humidity
wind speed and direction
solar radiation
greenhouse gas concentrations
These indicators are used to calculate climate normals, assess trends, and build climate models.
Types of Climate Data
Global Sources
Global datasets cover the entire Earth and are used to analyze planetary climate processes, make intercontinental comparisons, and construct climate change scenarios.
ERA5 (Copernicus Climate Change Service)
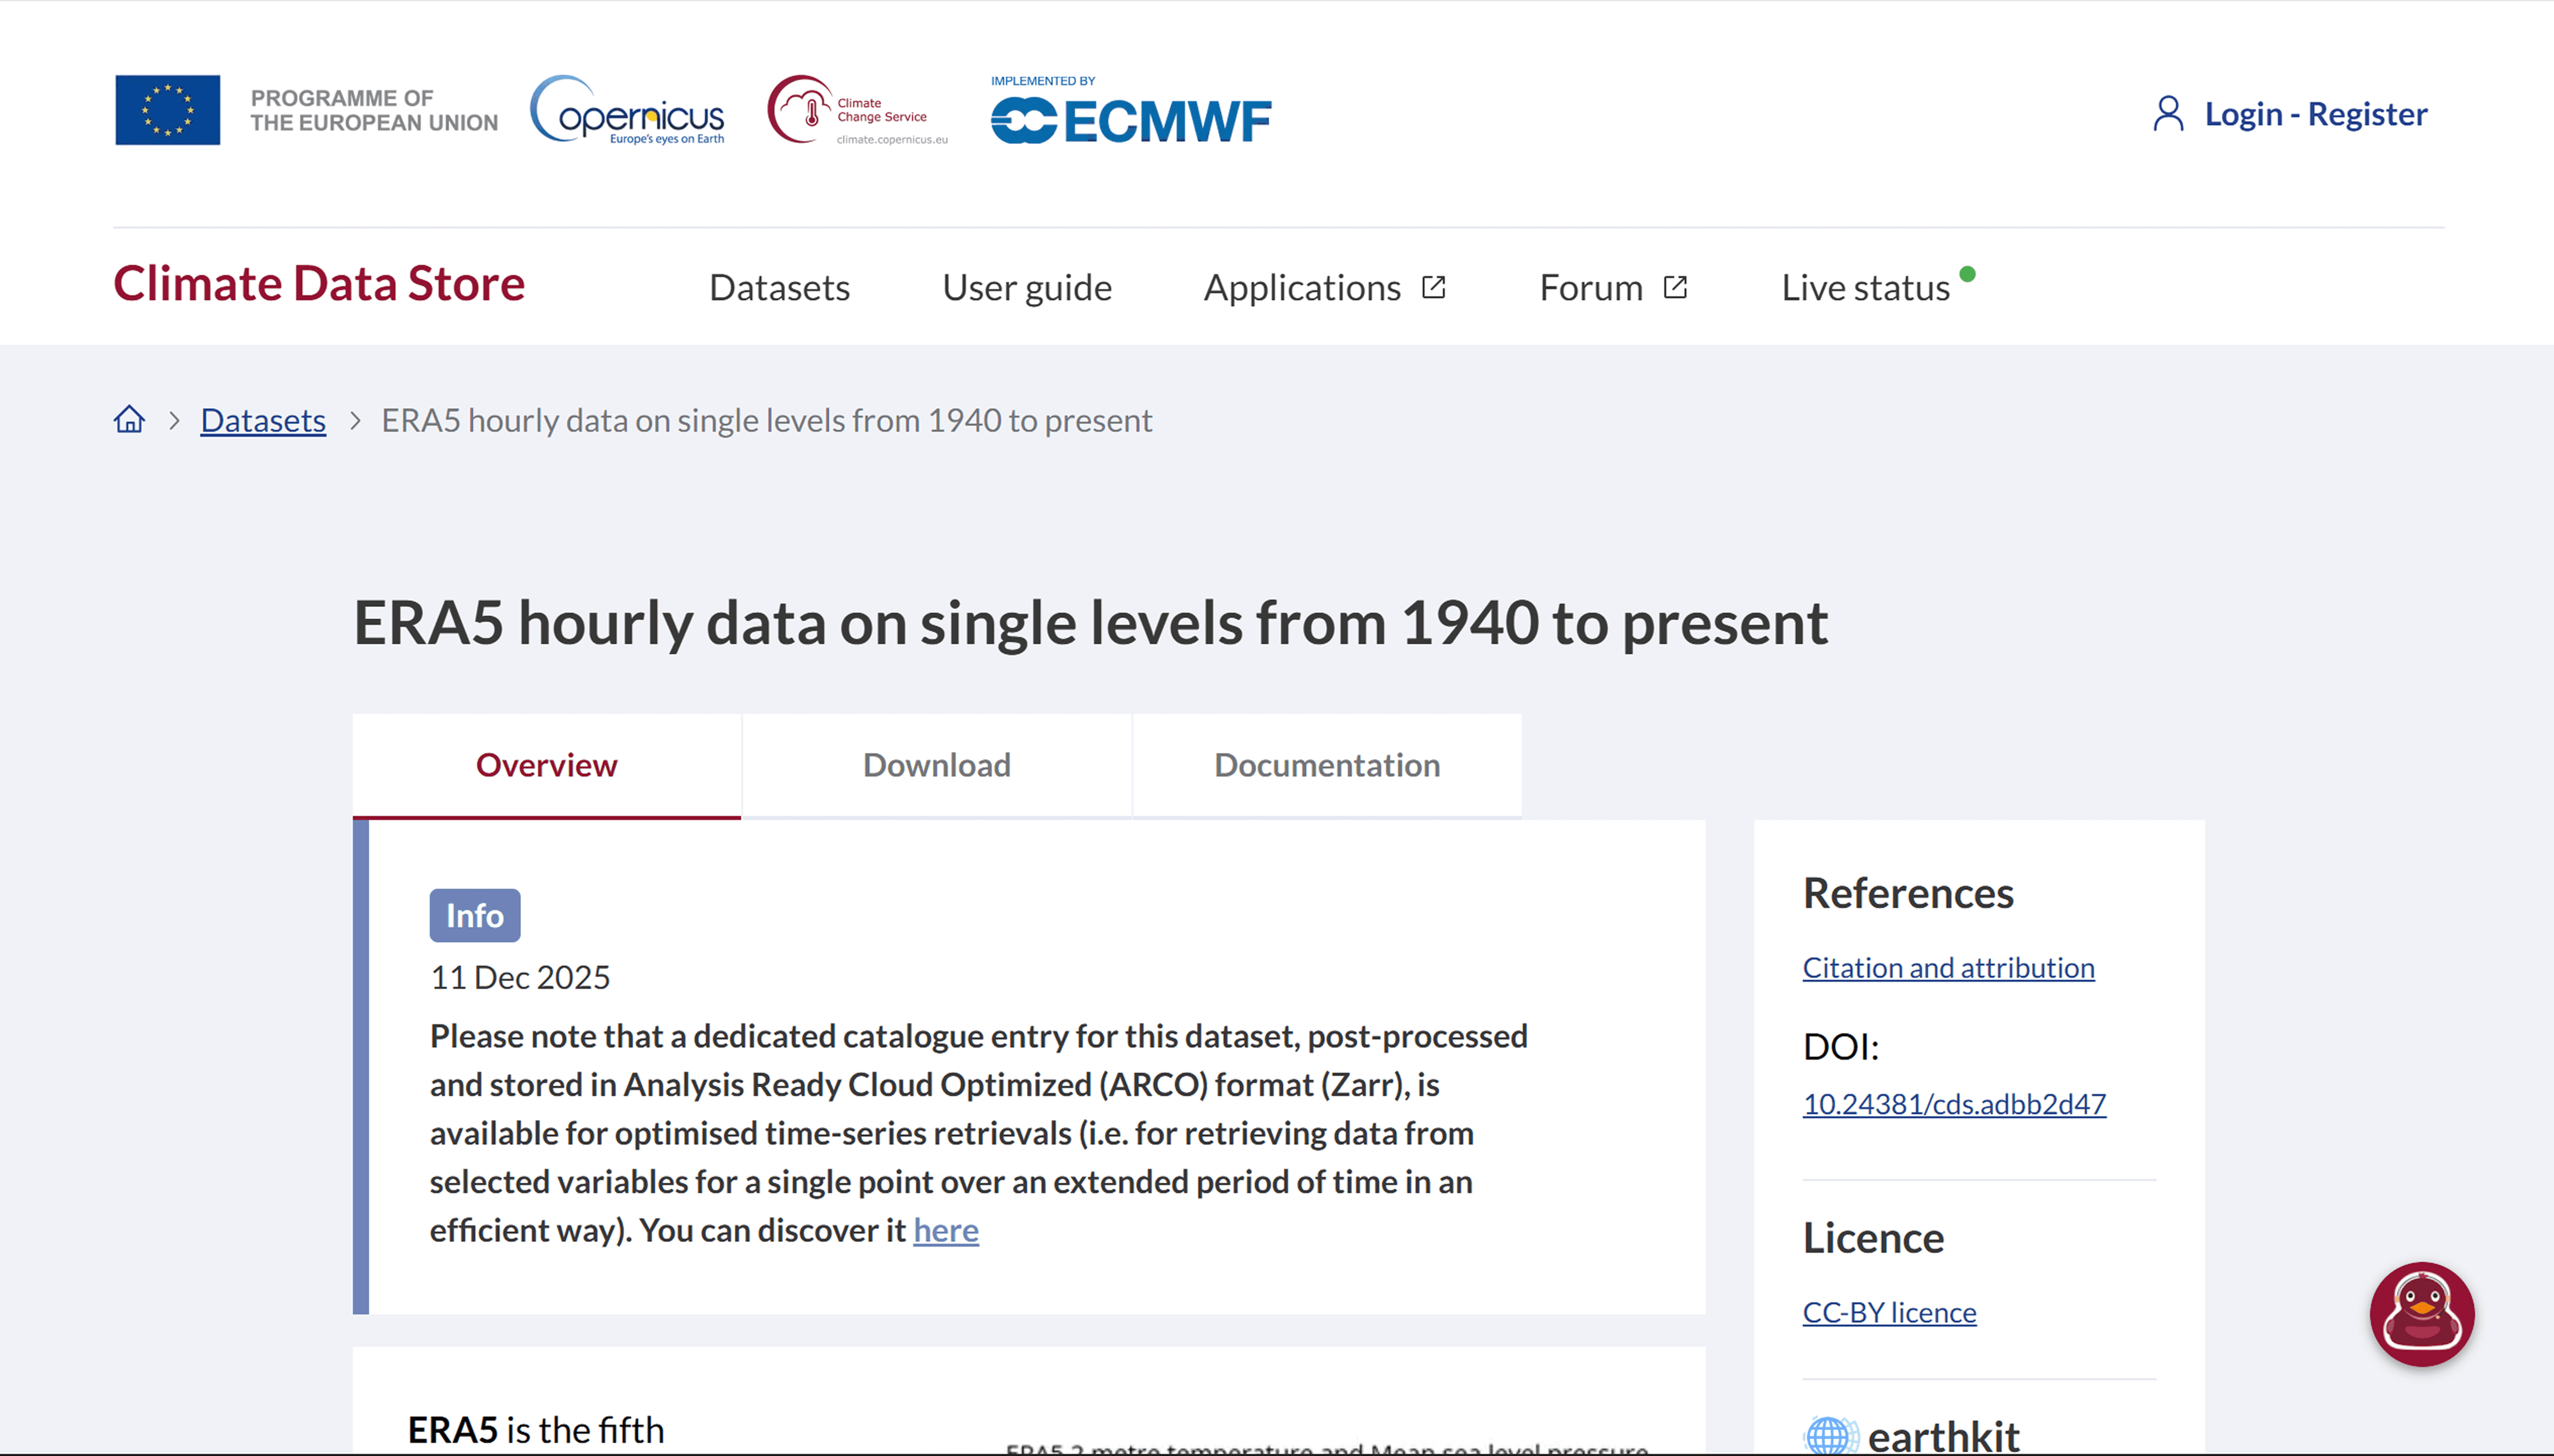
ERA5 dataset overview page showing available atmospheric variables, temporal coverage, and tools for accessing global reanalysis data.
Global atmospheric reanalysis with a resolution of up to 0.1° (~10 km). Provides continuous time series since the mid-20th century. It is used for:
– analyzing global temperature and precipitation trends;
– assessing extreme events;
– climate modeling;
– sectoral calculations (energy, transport, agriculture).
Global Historical Climatology Network (National Oceanic and Atmospheric Administration)
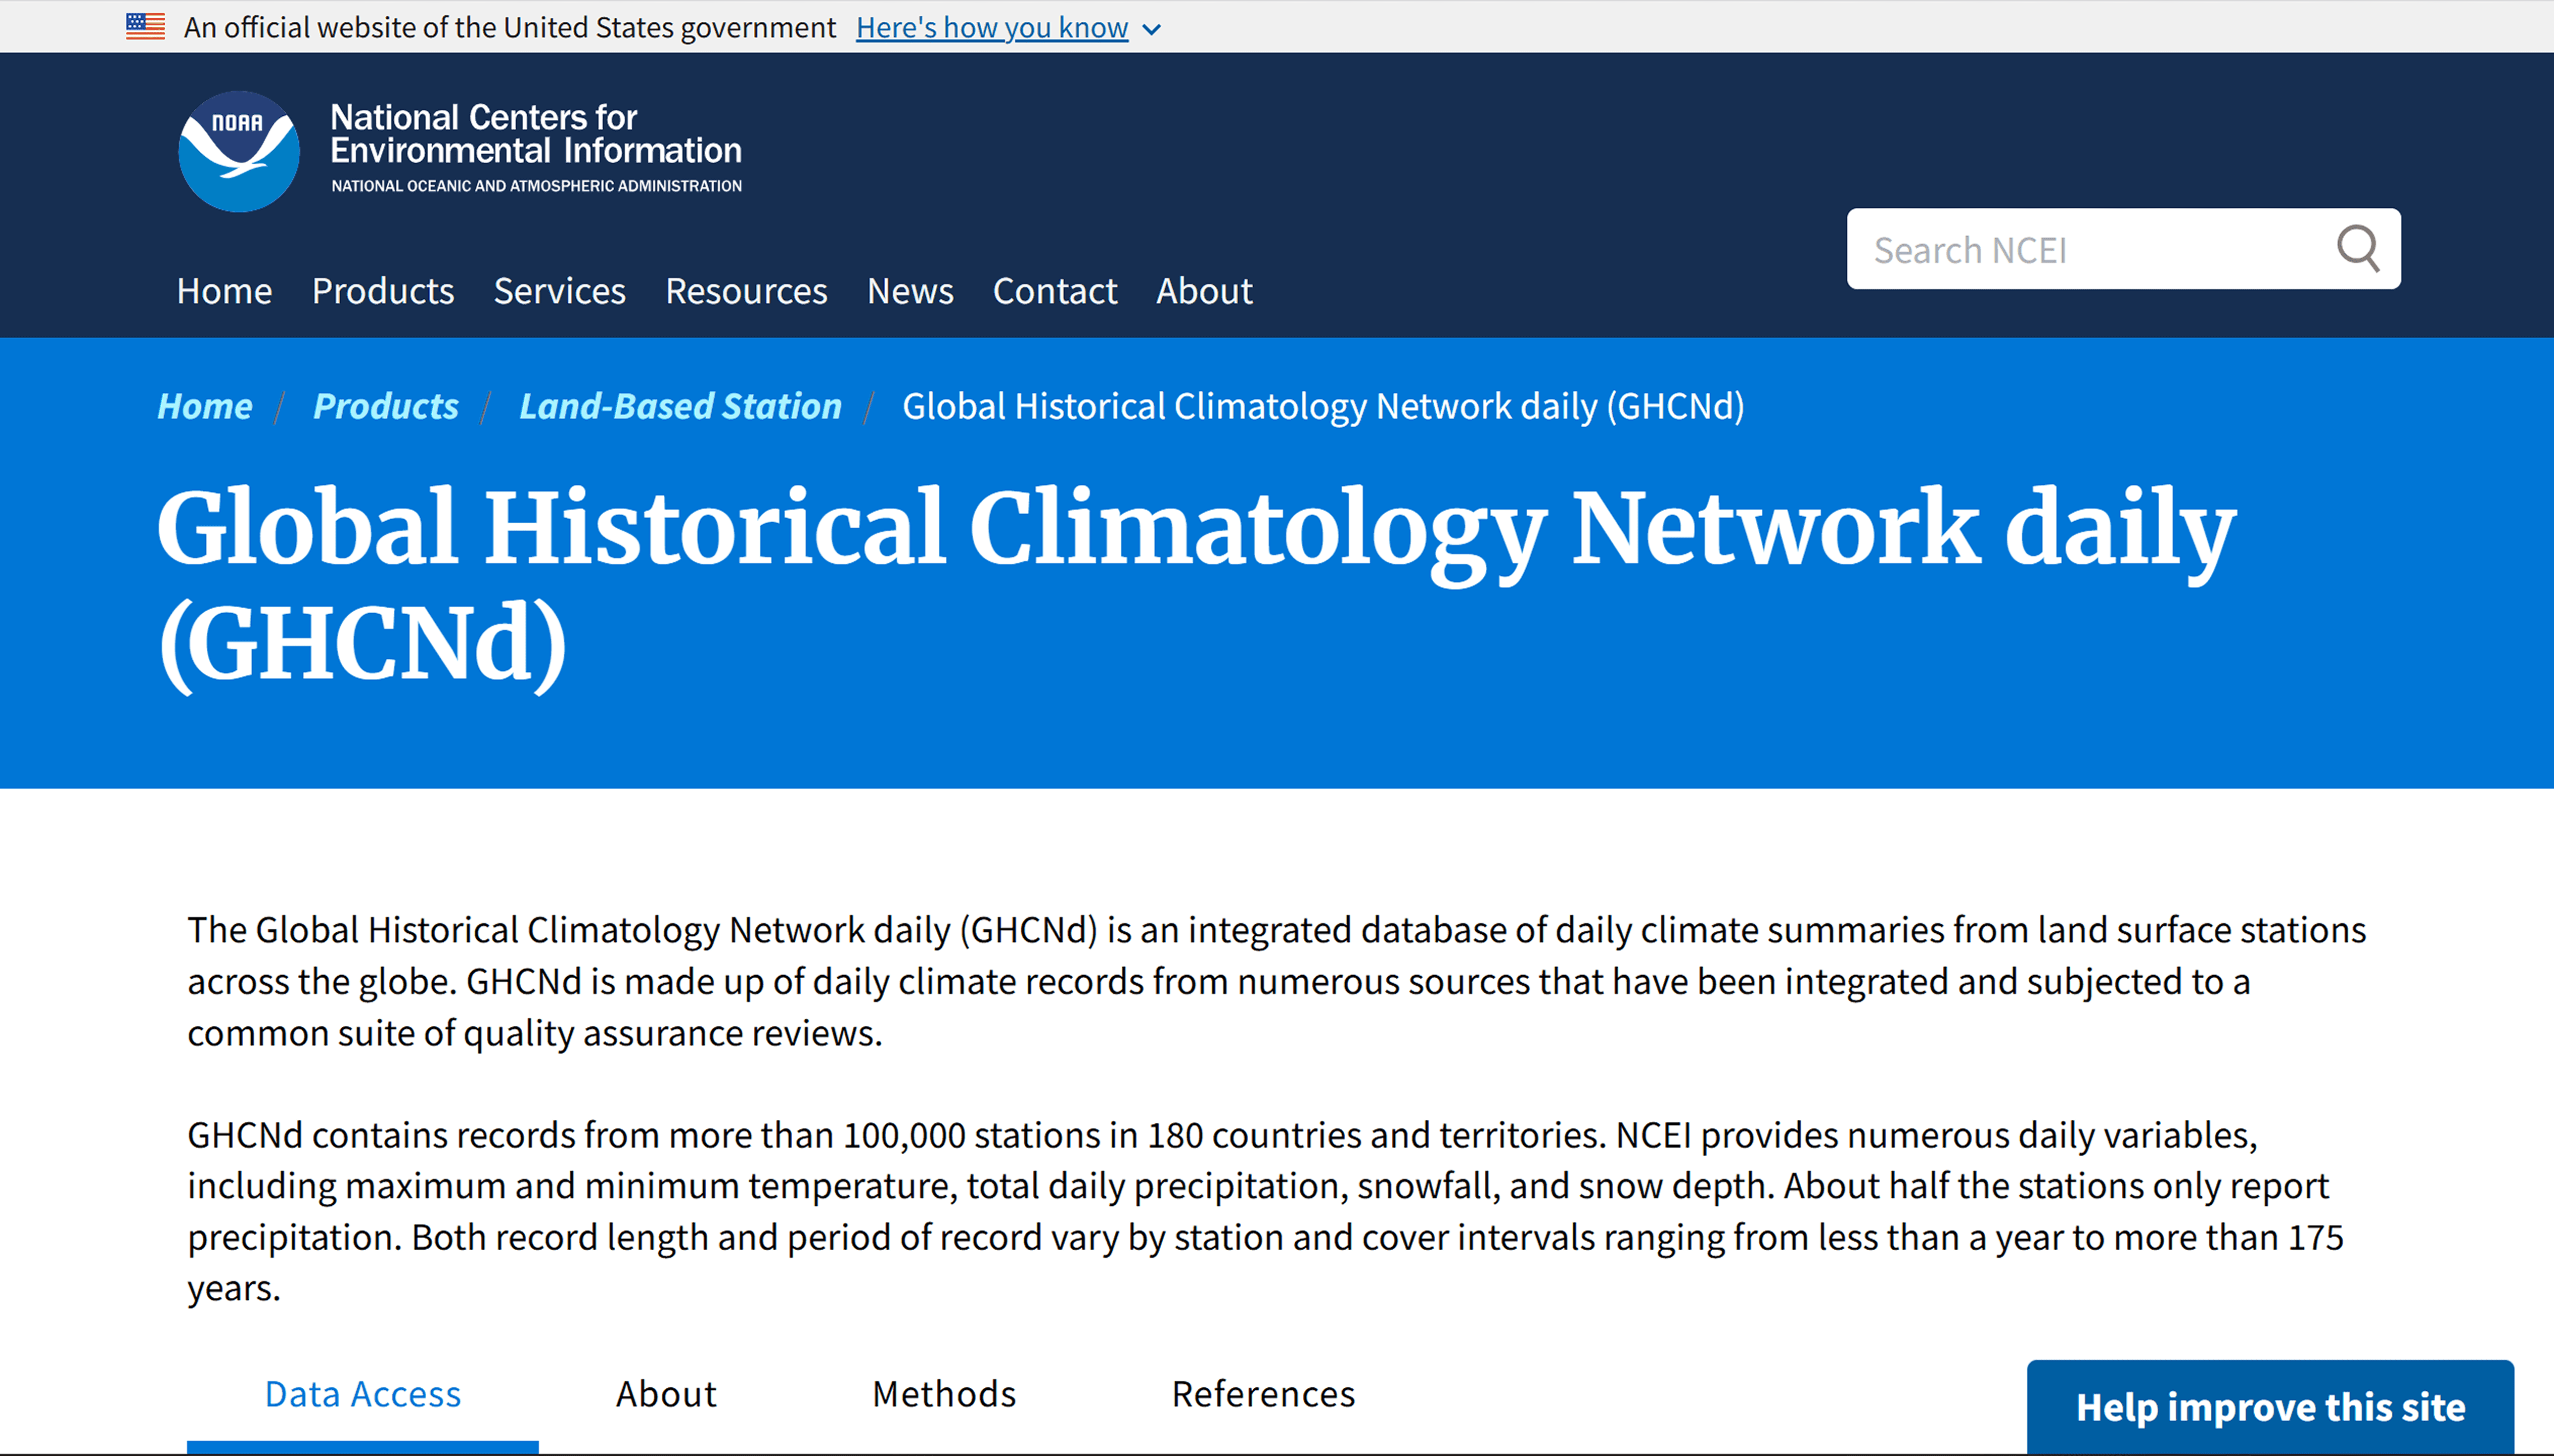
Data access page for global daily station observations, including dataset description, formats, and download options.
A global network of ground-based weather stations with historical and current observations. It is used for time series analysis, calculating climate norms, and estimating the frequency of extreme events.
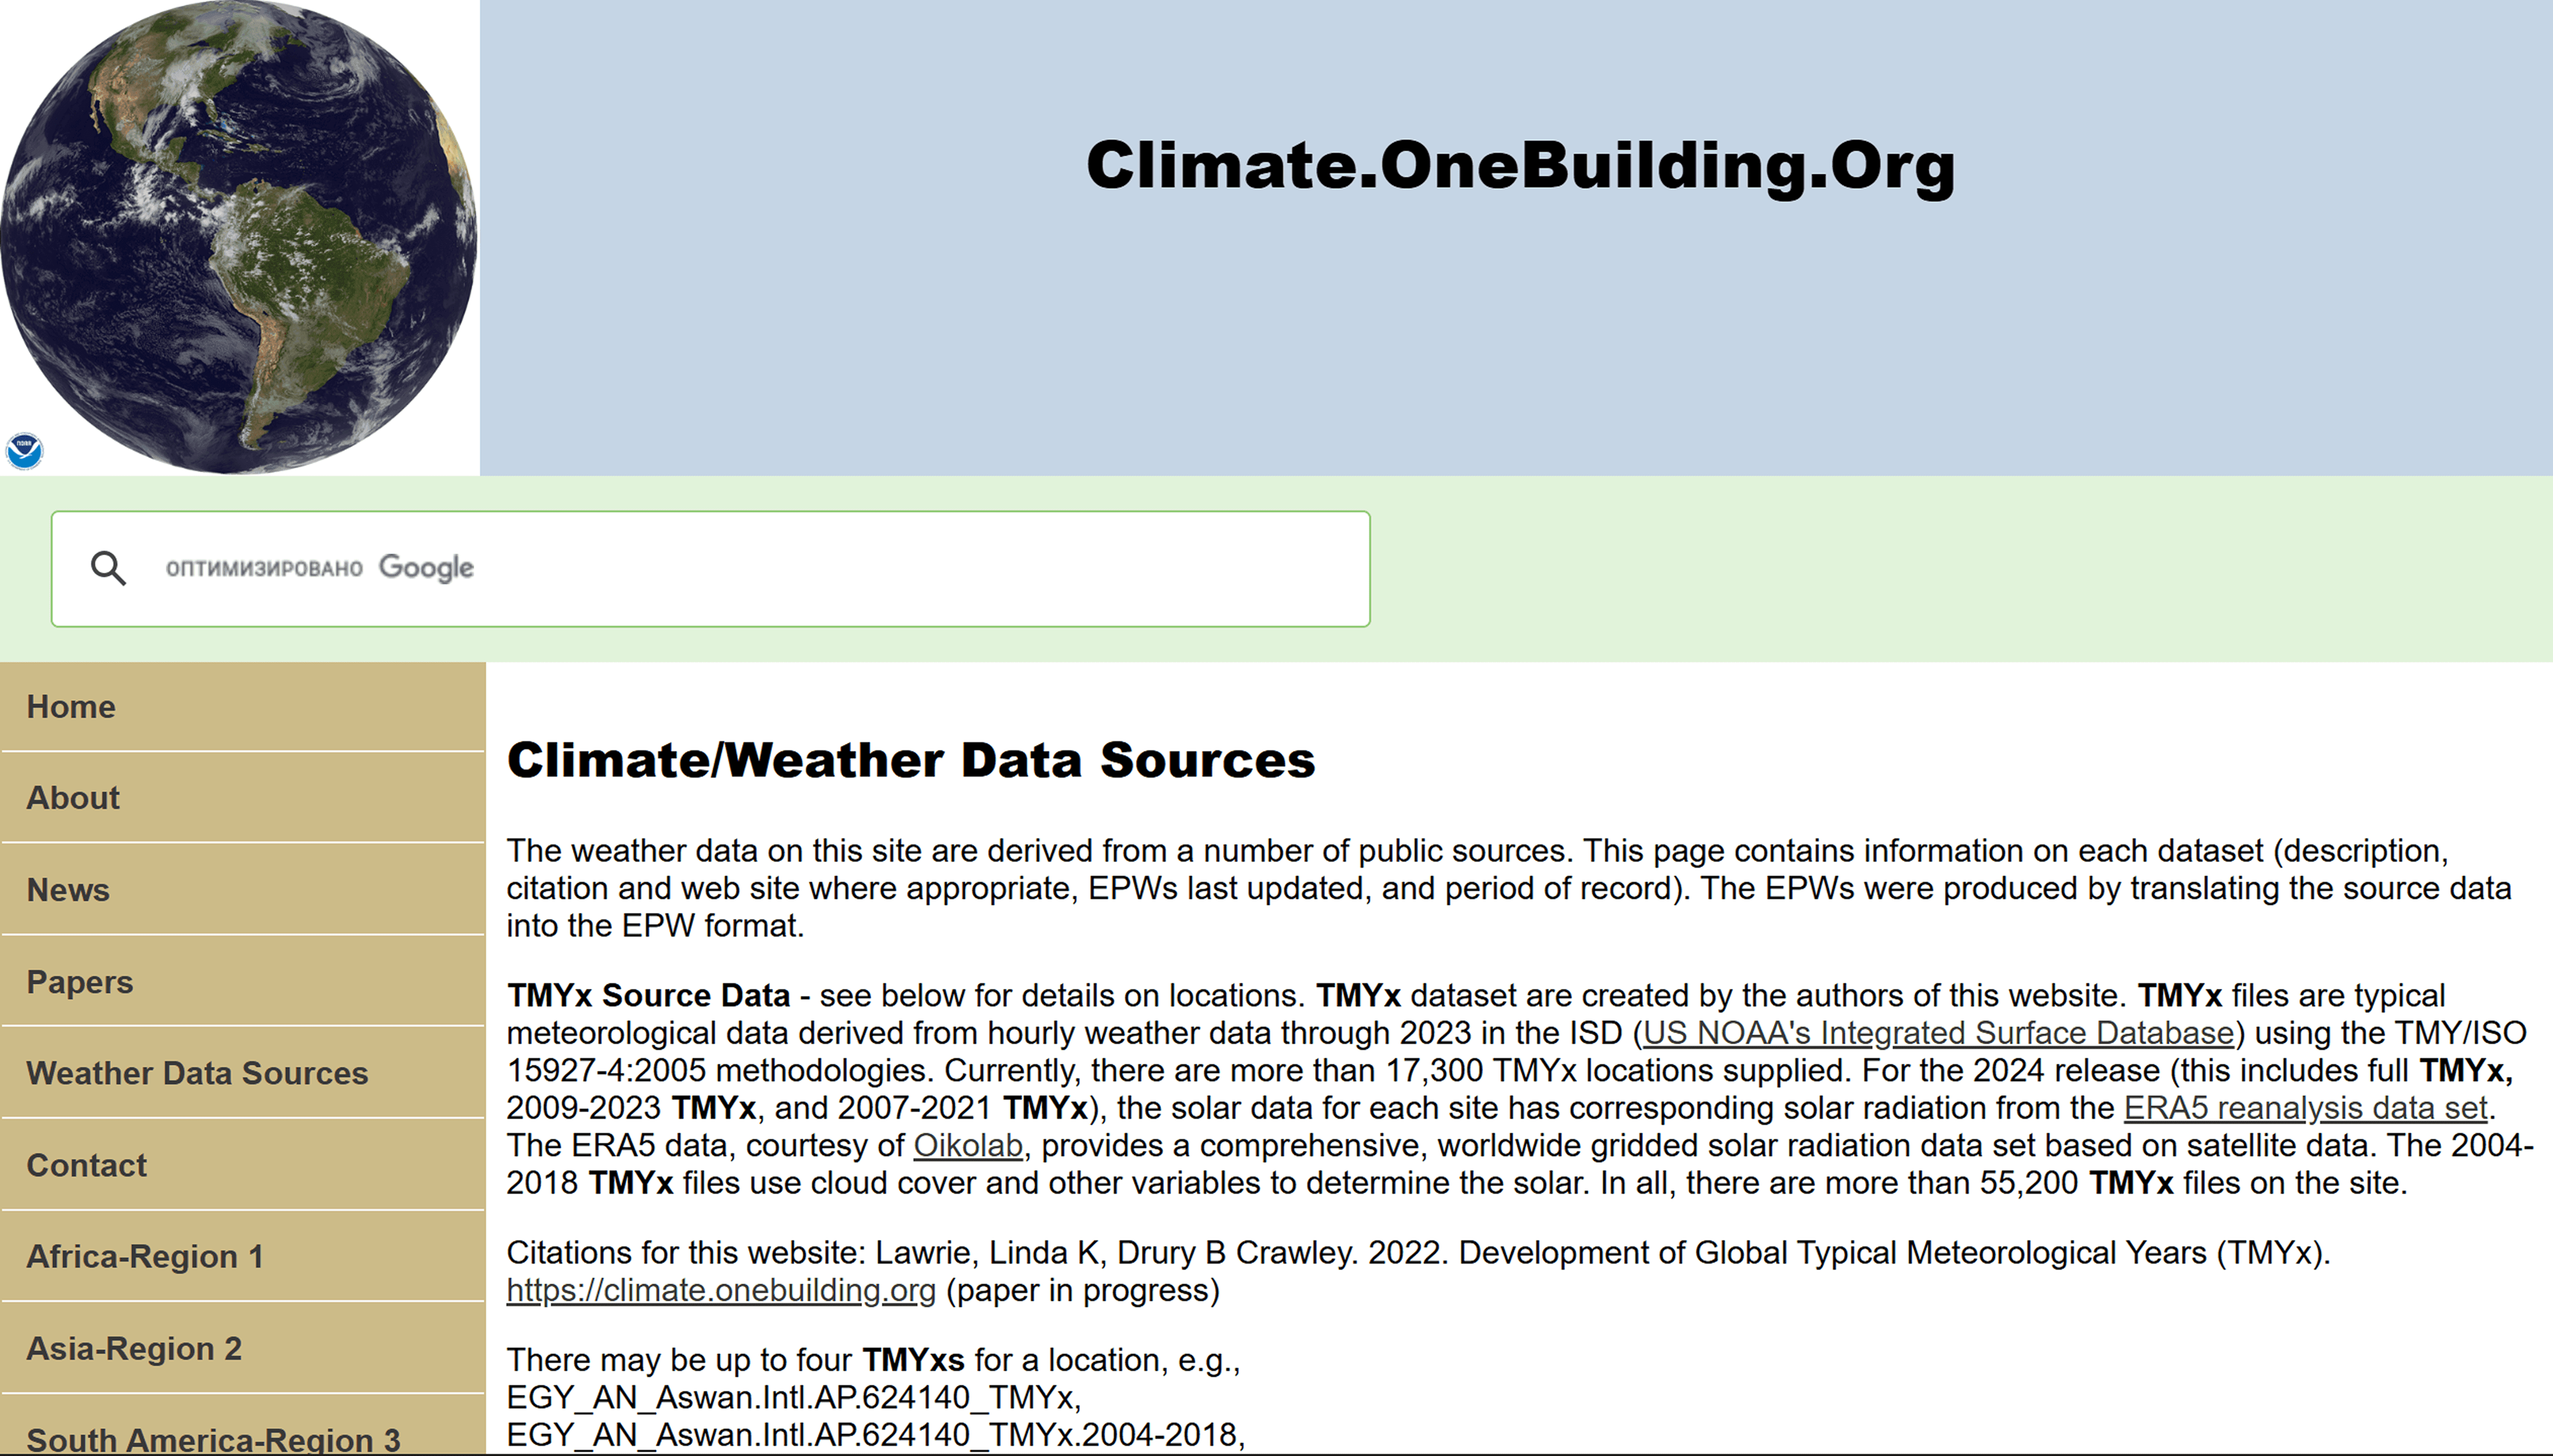
Repository interface listing TMYx weather files and downloadable climate data for thousands of locations worldwide.
The Typical Meteorological Year (TMYx) International Data Repository covers over 17,000 locations worldwide. It is used in energy modeling and building design.
Global sources ensure data comparability across countries and enable the analysis of climate processes on a global scale.
Regional and Highly Detailed Datasets
Regional datasets are used for more detailed analysis at the country, regional, or local level. They have a higher spatial resolution and are suitable for applied tasks.
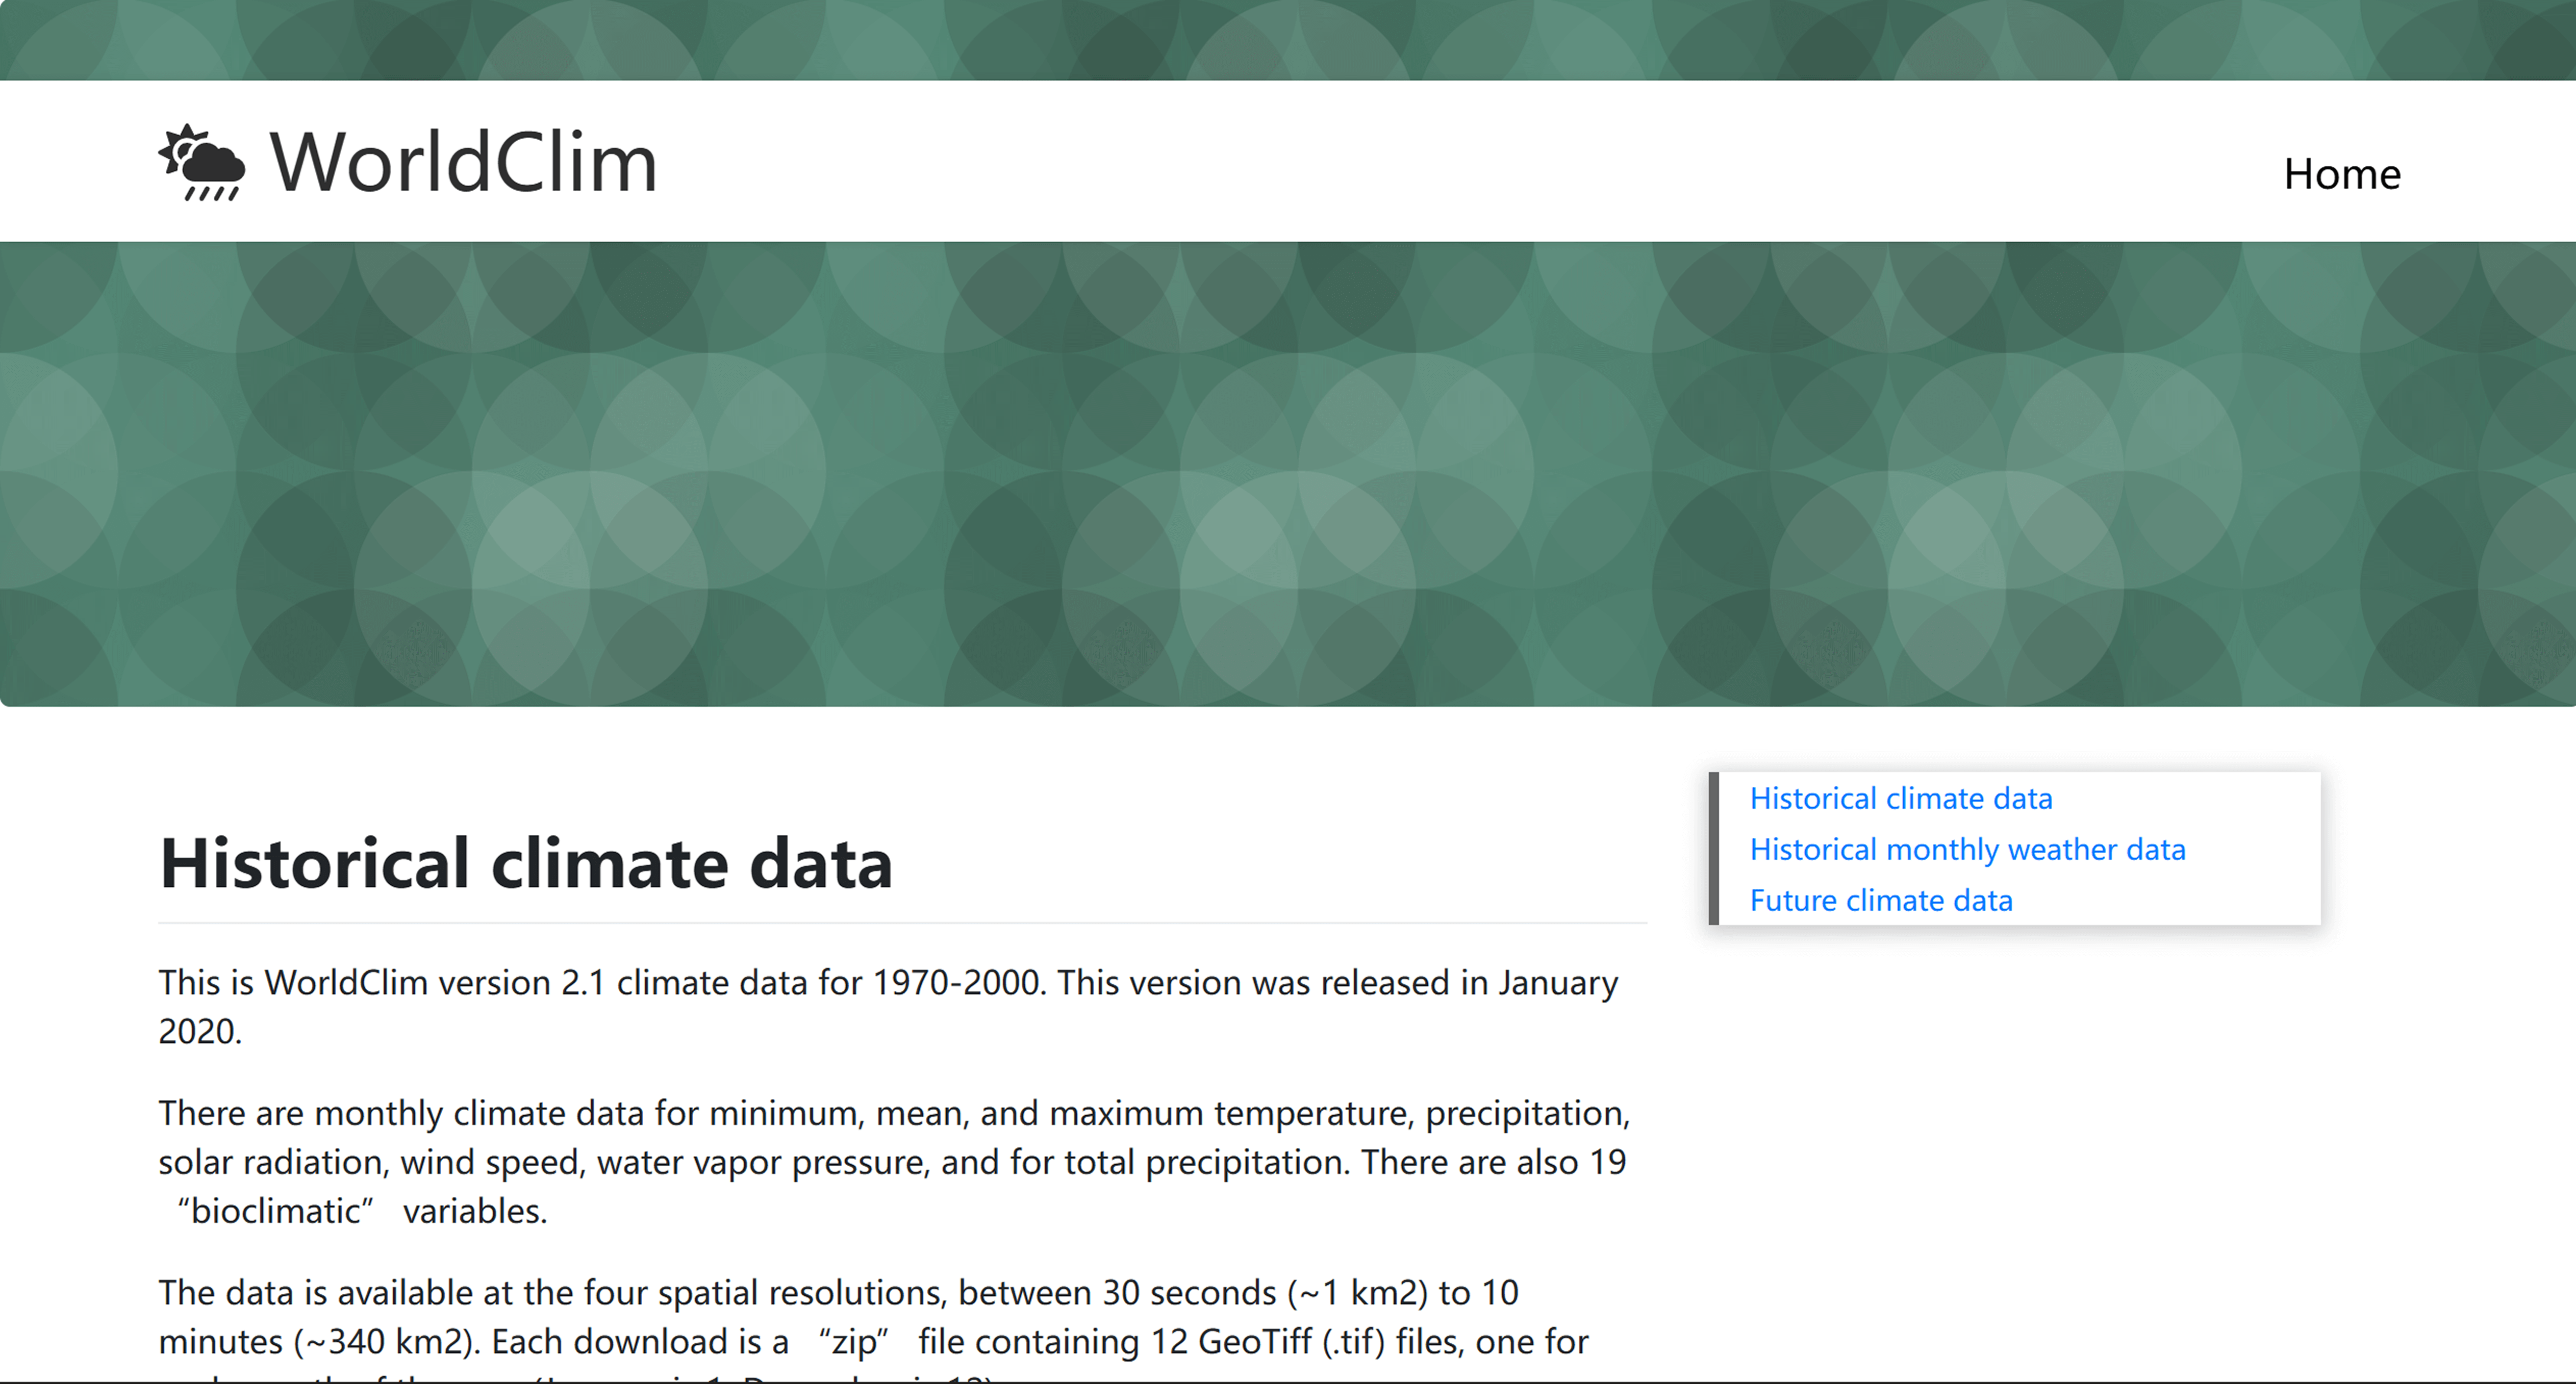
Download page for global monthly climate variables and bioclimatic indices with multiple spatial resolution options.
A set of monthly average climate variables for 1970–2000 with a resolution of up to 30 seconds (~1 km), including bioclimatic indices (BioClim). It is used in ecology, agroclimatic zoning, and species range modeling.
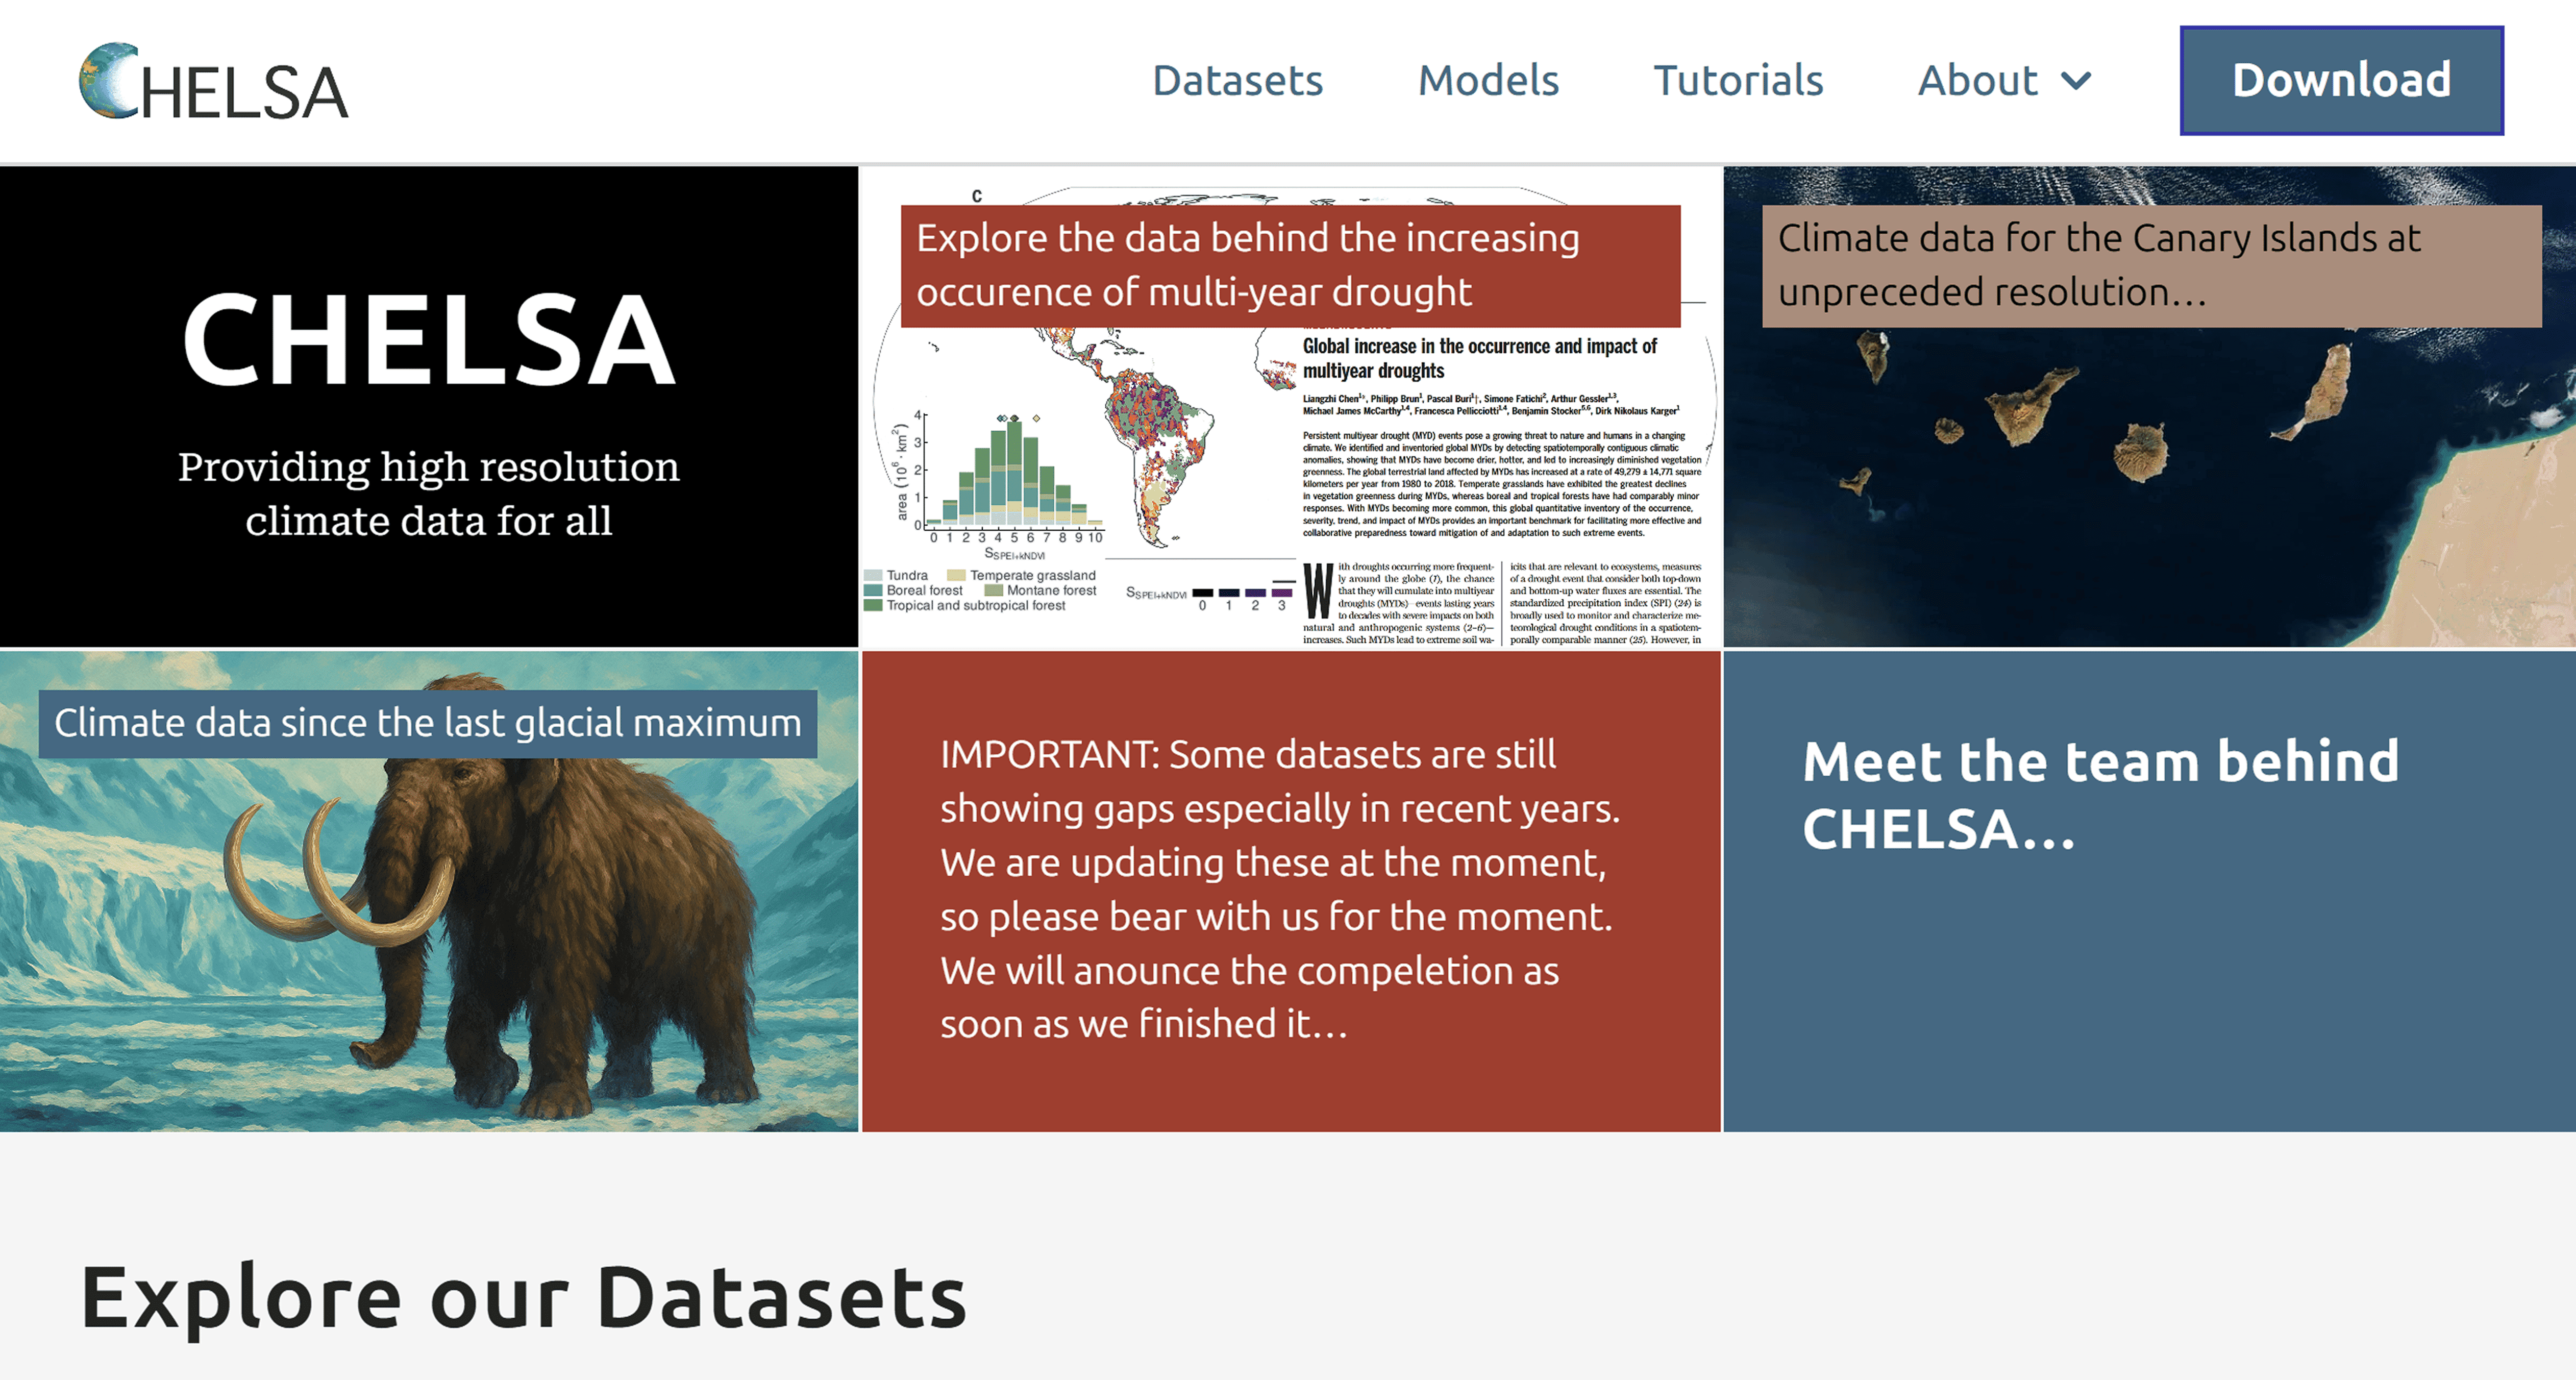
Access page for high-resolution climate layers and derived bioclimatic variables, including dataset documentation and coverage details.
Climate data for 1979–2013 with a resolution of 30 seconds (~1 km). It provides a more accurate representation of precipitation distribution, especially in mountainous regions. It is used for climate risk assessment, biodiversity analysis, and territorial planning.
Regional sources also include catalogs of weather stations and hydrological gauging stations, presented as vector data with attribute information (coordinates, operating periods, characteristics).
Climate Data Formats
Climate information can exist in various formats:
– Rasters (GeoTIFF, NetCDF, GRIB): for spatial models
– Vector data (station and observation point catalogs)
– Tabular formats (CSV, TXT): for time series
– Specialized energy formats (EPW, TMY)
The choice of format depends on the task—scientific analysis, mapping, or engineering modeling.
Comparison table of climate data sources
Source | Data type | Spatial resolution | Temporary covering | Format | Main application |
ERA5 (C3S) | Global Climate Reanalysis | up to 0.1° (~10 km) | 1940 – present | NetCDF, GRIB (rasters) | Climate modeling, trend analysis, industry assessments |
WorldClim | Downscale reanalysis + BioClim | up to 30″ (~1 km) | 1970–2000 | GeoTIFF (rasters) | Ecology, species range modeling, agroclimatic analysis |
CHELSA | Downscale reanalysis + BioClim | 30″ (~1 km) | 1979–2013 | GeoTIFF (rasters) | Mountainous regions, precipitation, biogeography |
Global Historical Climatology Network | Observations from weather stations | Point data | 19th century – present (depending on the station) | Tables (CSV) | Time series analysis, extreme events |
Climate OneBuilding | Typical meteorological year (TMYx) | Point data | Typical year (statistical sample) | EPW, CSV | Energy modeling, building design |
FAQ
What's the difference between climate and weather?
Weather describes short-term conditions, while climate describes statistical characteristics over a long period (usually ≥30 years according to the World Meteorological Organization).
Which data should I choose: global or regional?
Global reanalyses, such as ERA5, are suitable for analyzing global trends. High-resolution datasets such as WorldClim and CHELSA are suitable for local studies.
Can the data be used in commercial projects?
Most international climate databases are open for scientific and applied use, subject to licensing and proper citation.
Key Takeaways
Climate data are the foundation of scientific analysis and strategic planning.
Sources vary in scale: global ones are for general trends, while regional ones are for detailed tasks.
Open international databases ensure the accessibility and comparability of climate information.


