
In geographic information systems, spatial data is often divided into regular cells to make it easier to analyze and visualize. Such structures are called grid systems. The most common type is a square grid, which is widely used, for example, when working with raster data and satellite imagery.
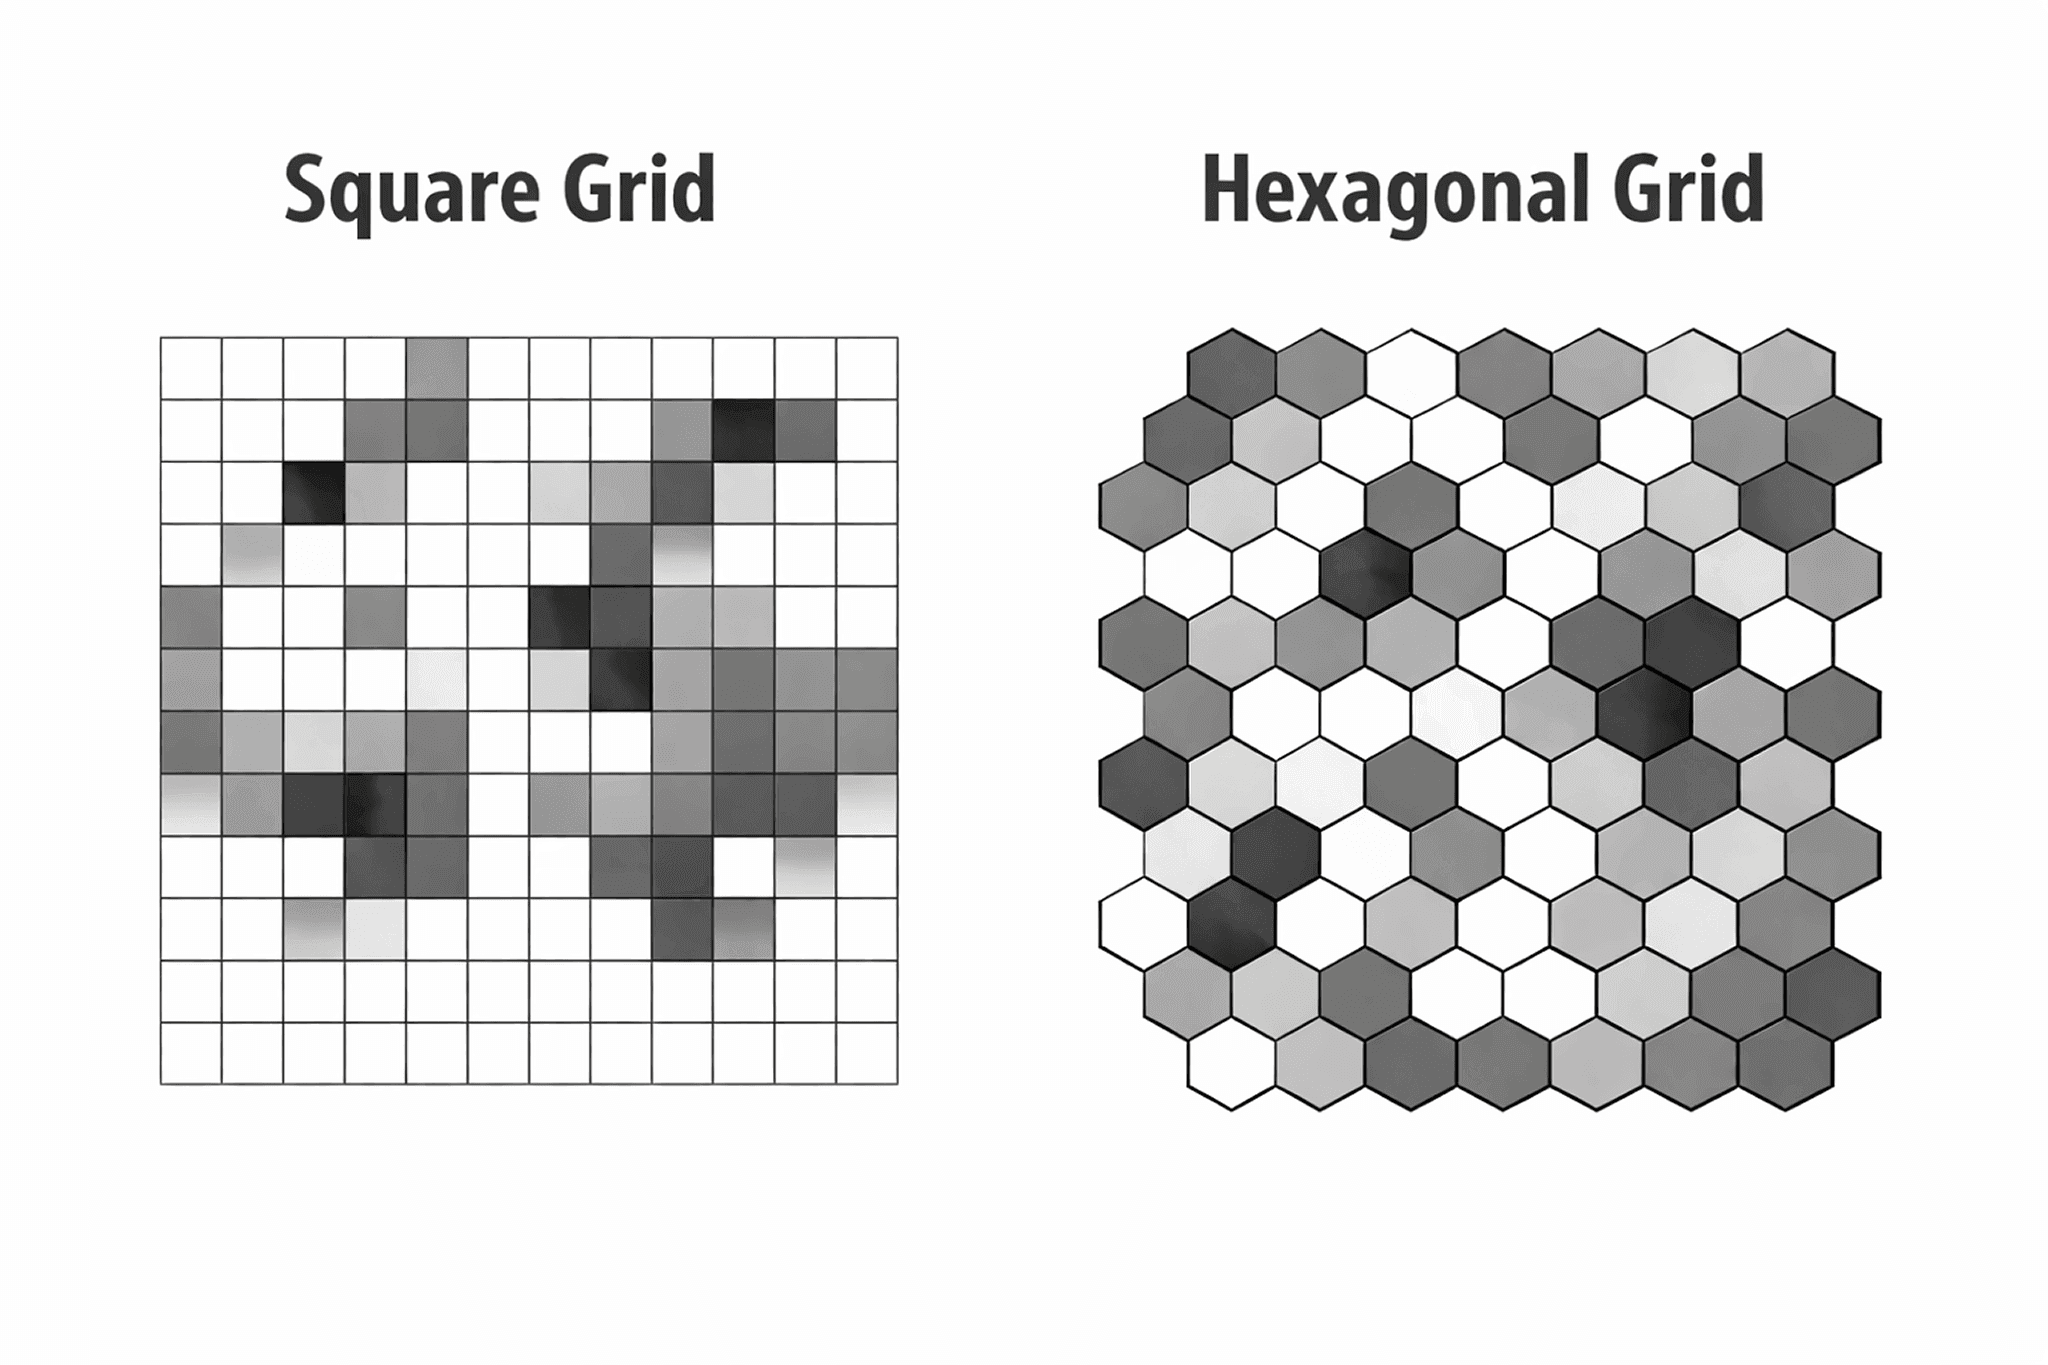
Square and hexagonal grids
However, in recent years, hexagonal grids, where the territory is divided into hexagonal cells, have become increasingly popular. Each cell represents a separate spatial unit that can be used to store and analyze data,for example, population density, environmental indicators, and movement statistics.
The main difference between a hexagonal grid and a square grid is the arrangement of adjacent cells. A square grid typically has four primary neighbors (or eight, if you include the diagonals). A hexagon, on the other hand, has six primary neighbors, and the distance to each cell is equal. This geometry makes hexagonal grids more convenient for spatial analysis.
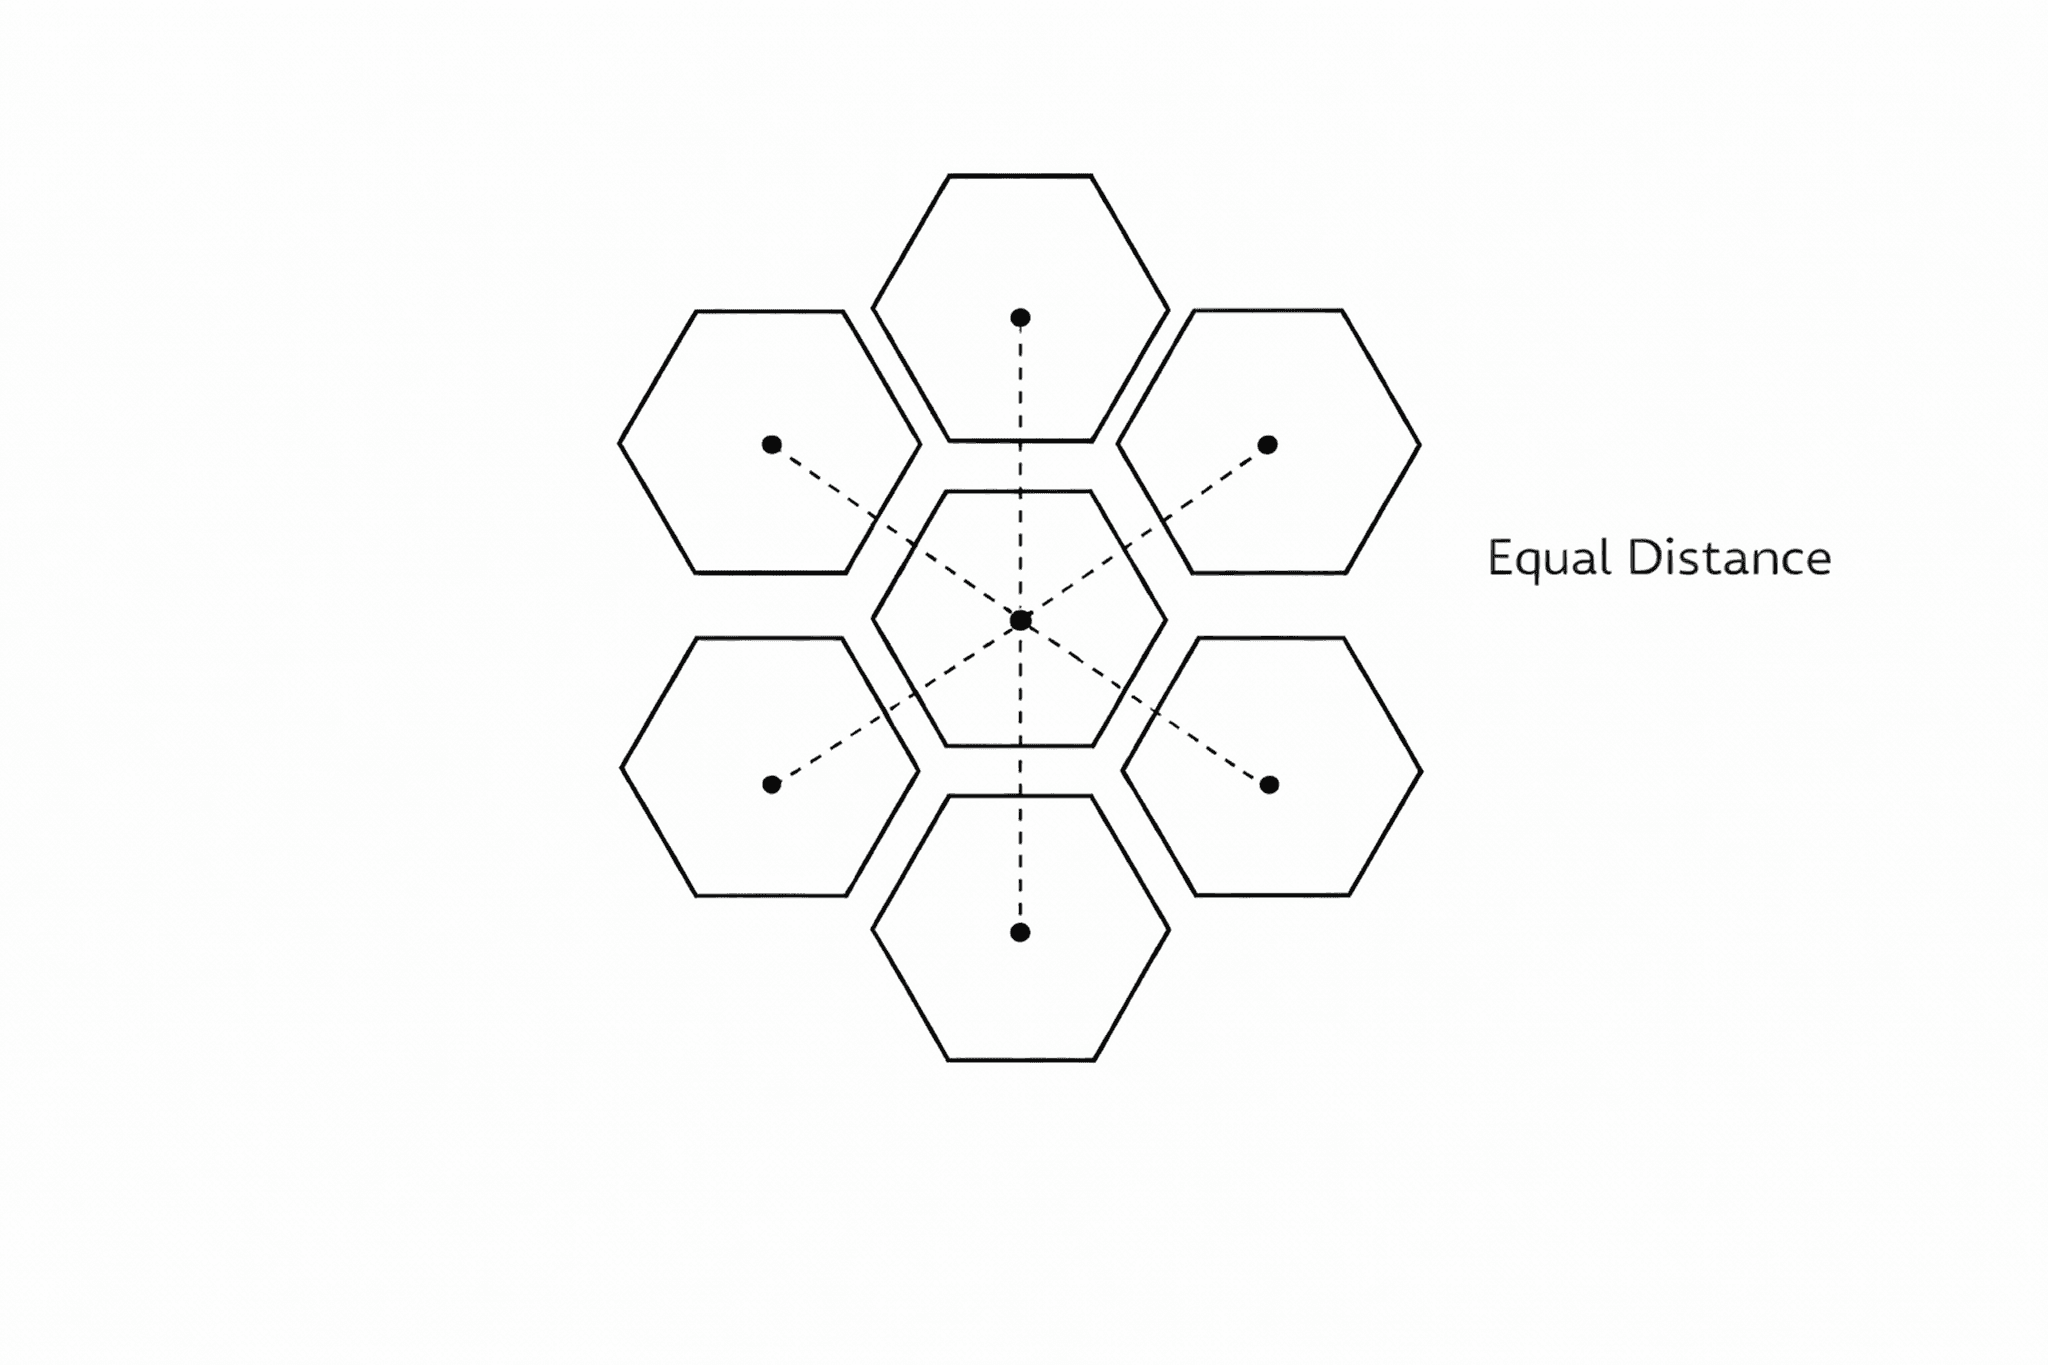
The advantage of a hexagon is equal distances between adjacent cells.
Therefore, today they are used in statistical data analysis, urban studies, environmental research and big geodata processing systems.
Advantages of Hexagonal Grids for Spatial Analysis
Hexagonal grids offer several important advantages over square grids when working with geodata.
First, the distance between the centers of adjacent cells is uniform. In a square grid, diagonal neighbors are farther apart than their horizontal or vertical neighbors. This can create distortions when analyzing spatial relationships.
Second, a hexagonal grid better captures spatial patterns. The hexagon's shape is closer to a circle than a square, allowing for a smoother representation of data distributions, such as population density or event concentrations.
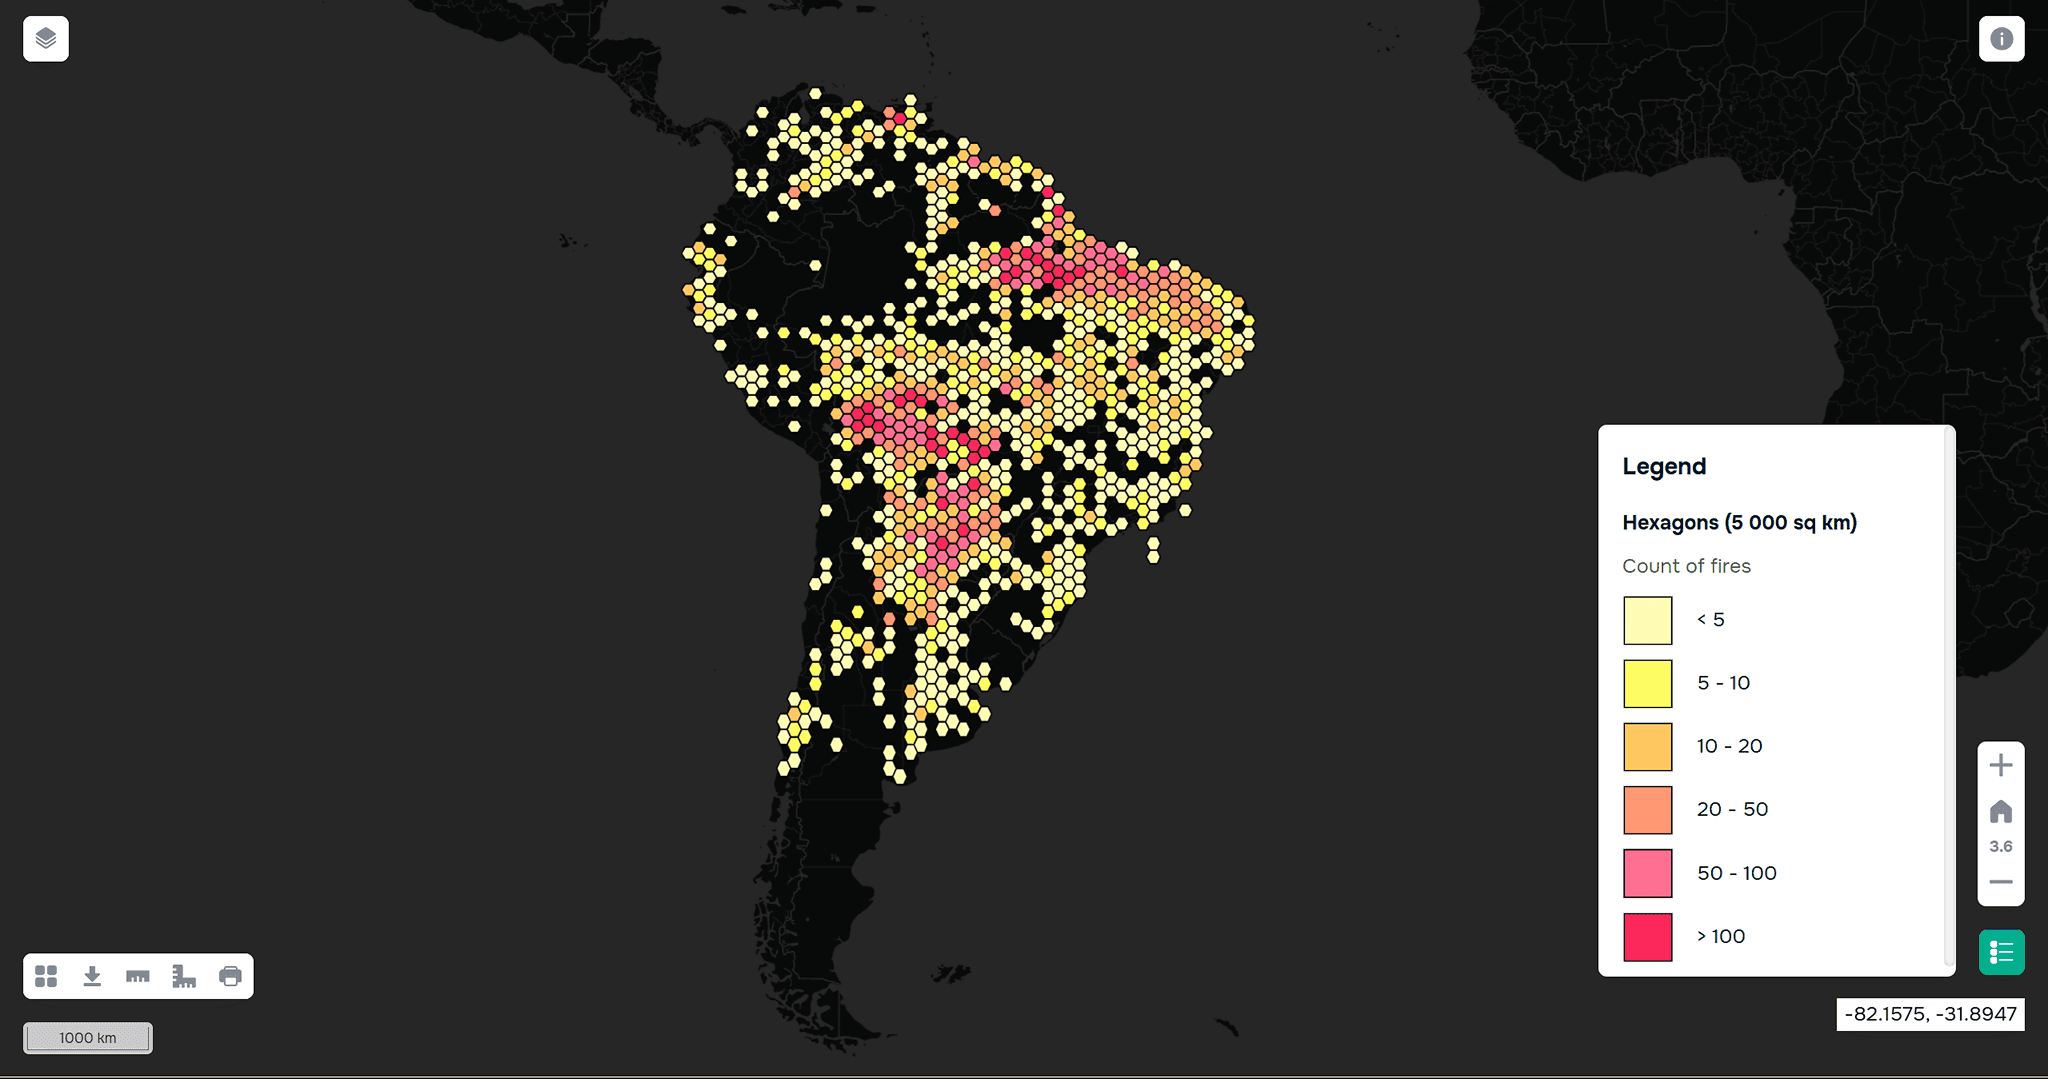
An example of spatial analysis of fire distribution in South America using hexagons
Another advantage is the reduction of directional distortion. Square grids often create artificial horizontal and vertical lines in data visualization. In a hexagonal grid, adjacent cells are distributed more evenly in all directions.
Because of these properties, hexagonal grids are often used for:
data density analysis
spatial information aggregation
visualization of statistical indicators
environmental and urban studies
They are especially useful for analyzing large geodatasets.
Comparison of hexagonal and square grids
Square grids are convenient because they work well with raster data and are easy to create in most GIS programs. However, their geometry can lead to uneven spacing between adjacent cells and directional distortion.

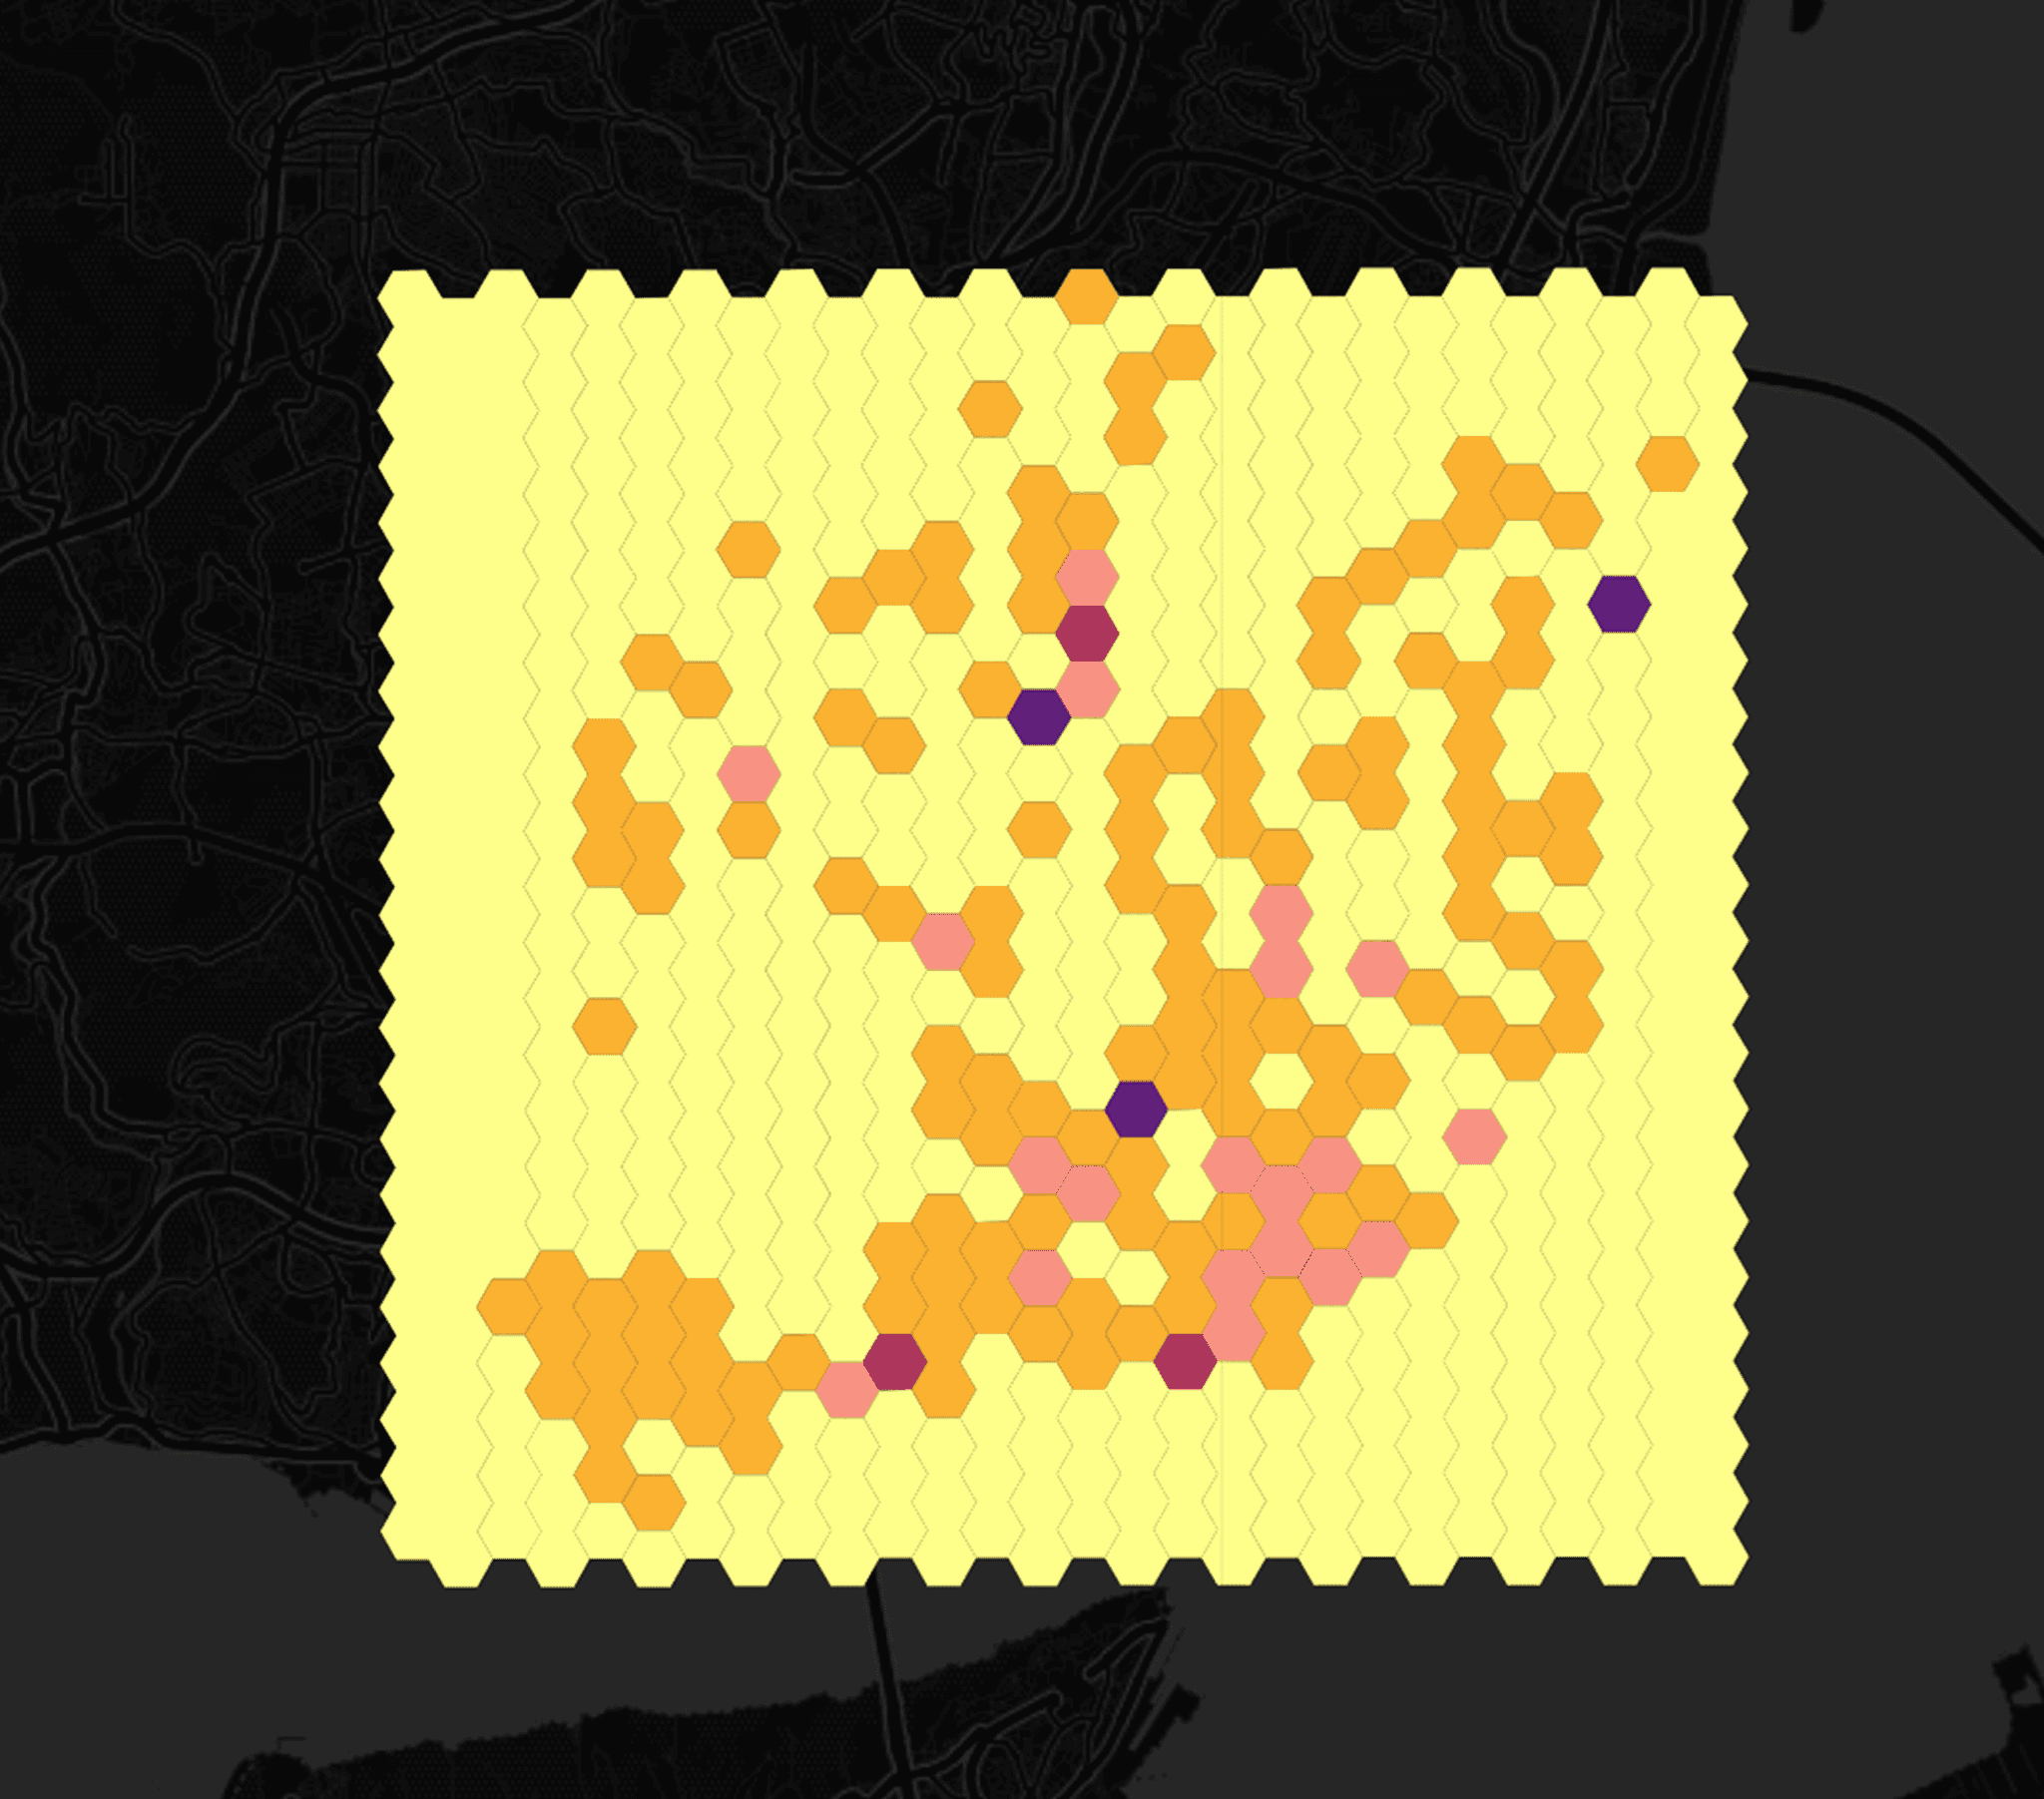
Comparison of spatial analysis of public transport stop distribution in Lisbon using hexagons and squares
Hexagonal grids, on the other hand, create a more balanced structure. Each cell has six equally spaced neighbors. This makes spatial calculations more accurate, and data visualizations often appear more natural.
Real-World Examples of Hexagonal Grid Applications
Hexagonal grids are used not only in GIS theory but also in real-world data analysis systems.
One of the most famous examples is the H3 spatial index developed by Uber. It is a global hexagonal grid system that divides the Earth's surface into cells of varying levels of detail.
Uber uses H3 to analyze massive amounts of geodata: for example, to estimate ride demand, analyze traffic flows, and optimally distribute vehicles across the city. By aggregating data into hexagonal cells, the system can quickly identify areas of high demand and improve service performance.
An interesting example of the hexagonal grid's use can also be found in the gaming industry. In the strategy game Civilization, the world map is based on a hexagonal grid. Starting with Civilization V, the developers abandoned square tiles.

An example of hexagon use in a game - Civilization 5. Source
This approach makes movement across the map more uniform and eliminates the diagonal distance problem typical of a square grid. Although this is a game mechanic, it clearly demonstrates the advantages of a hexagonal structure for spatial modeling.
Another example of the use of hexagons will be open data on the population of Kontur
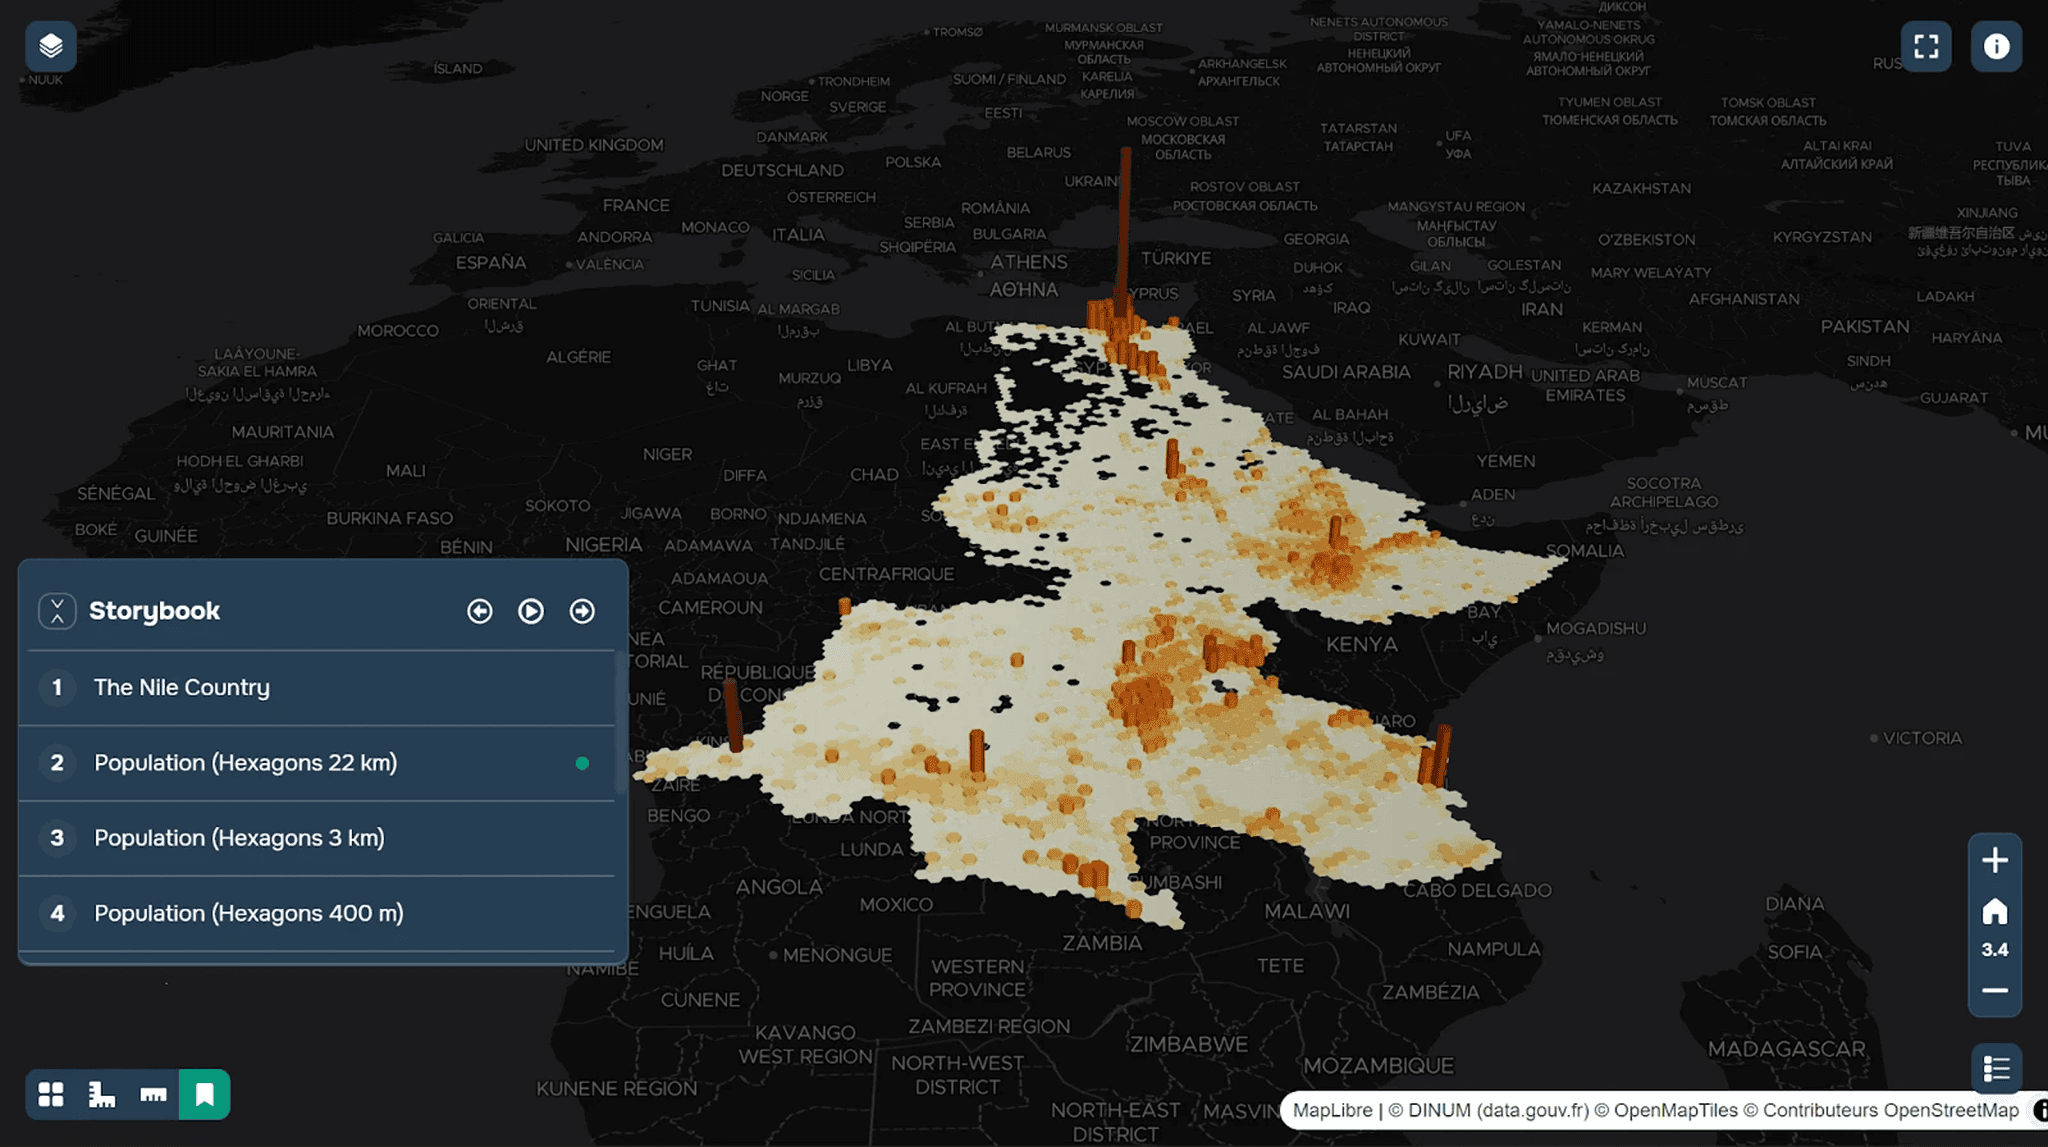
Settlement along the Nile River hexagons 22 km
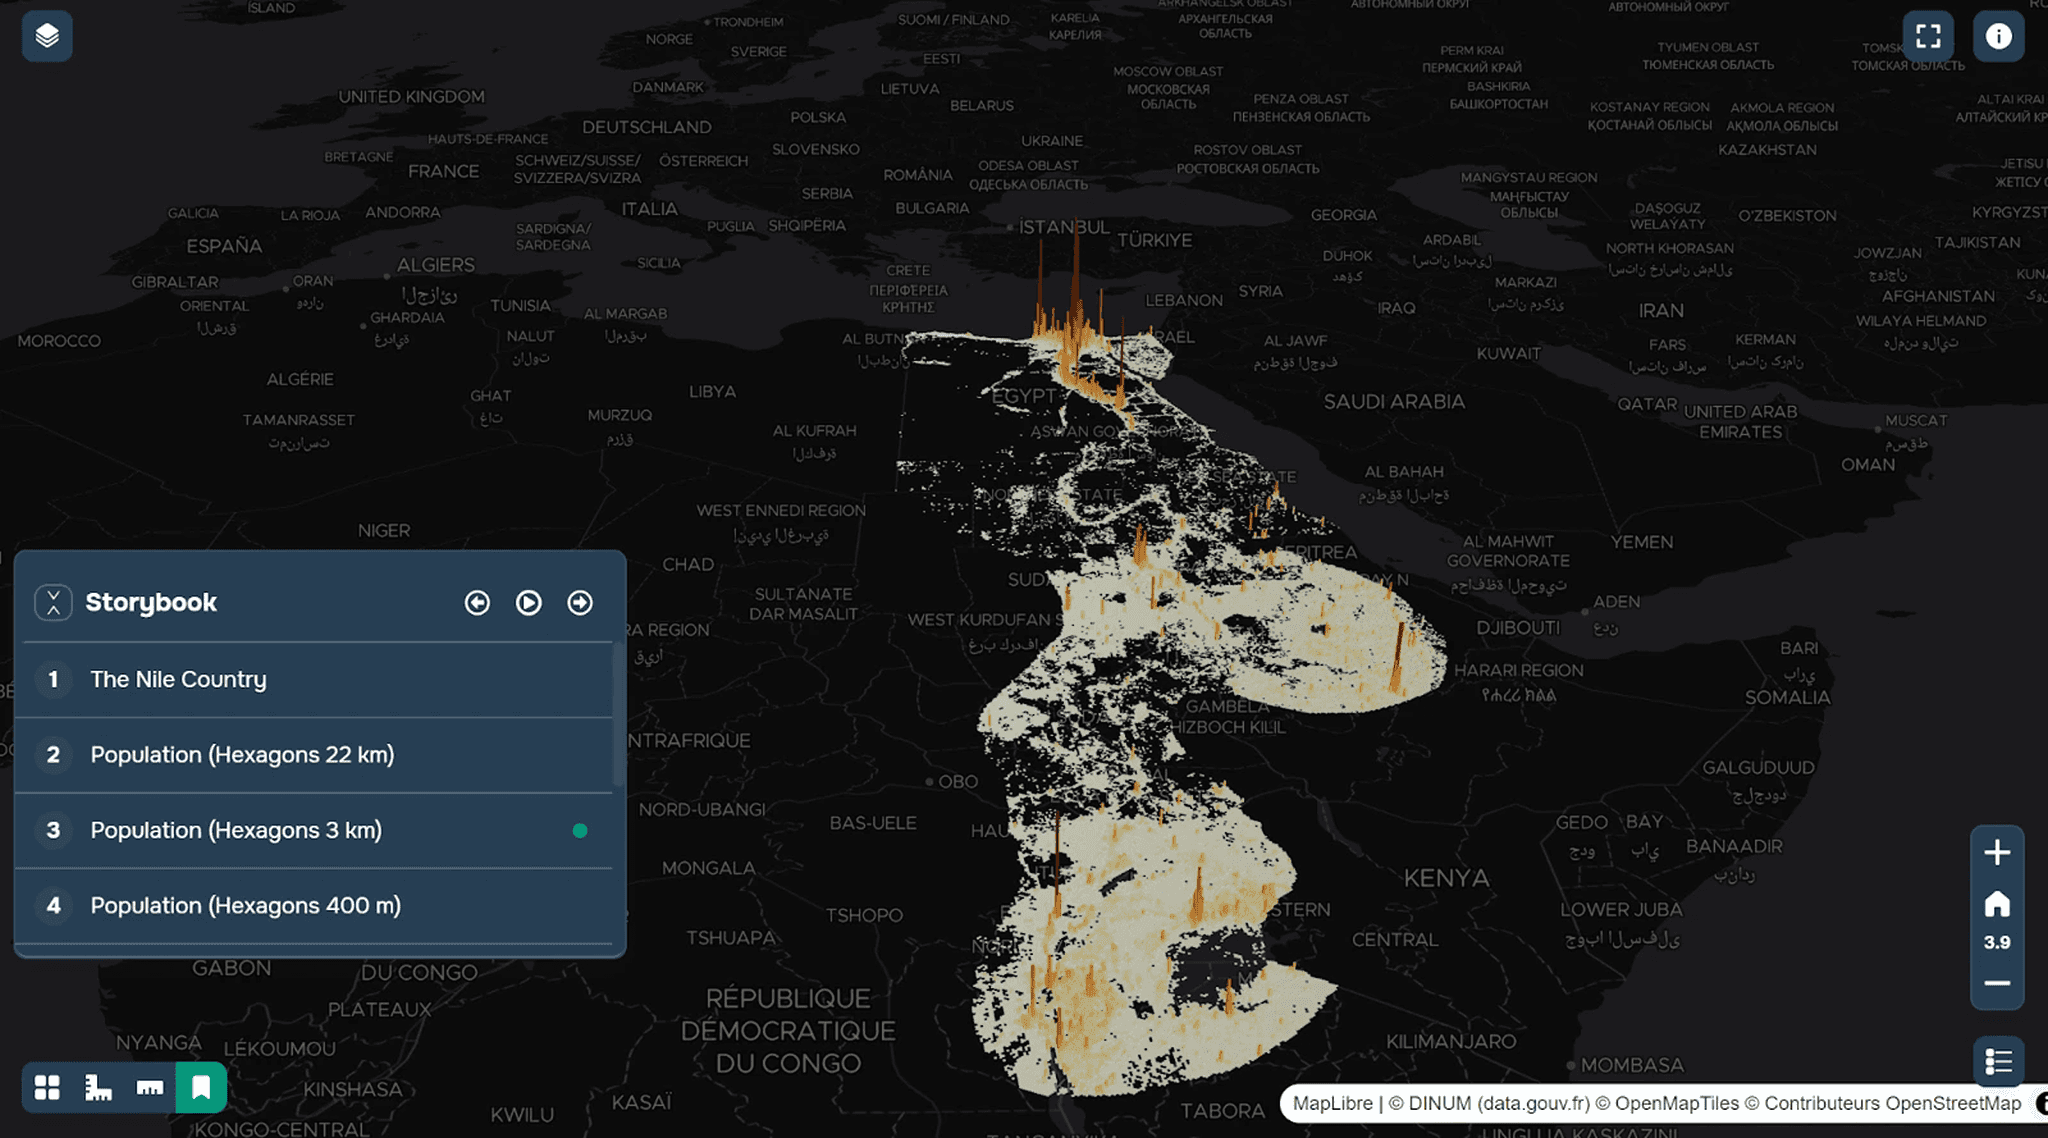
Settlement along the Nile River hexagons 3 km
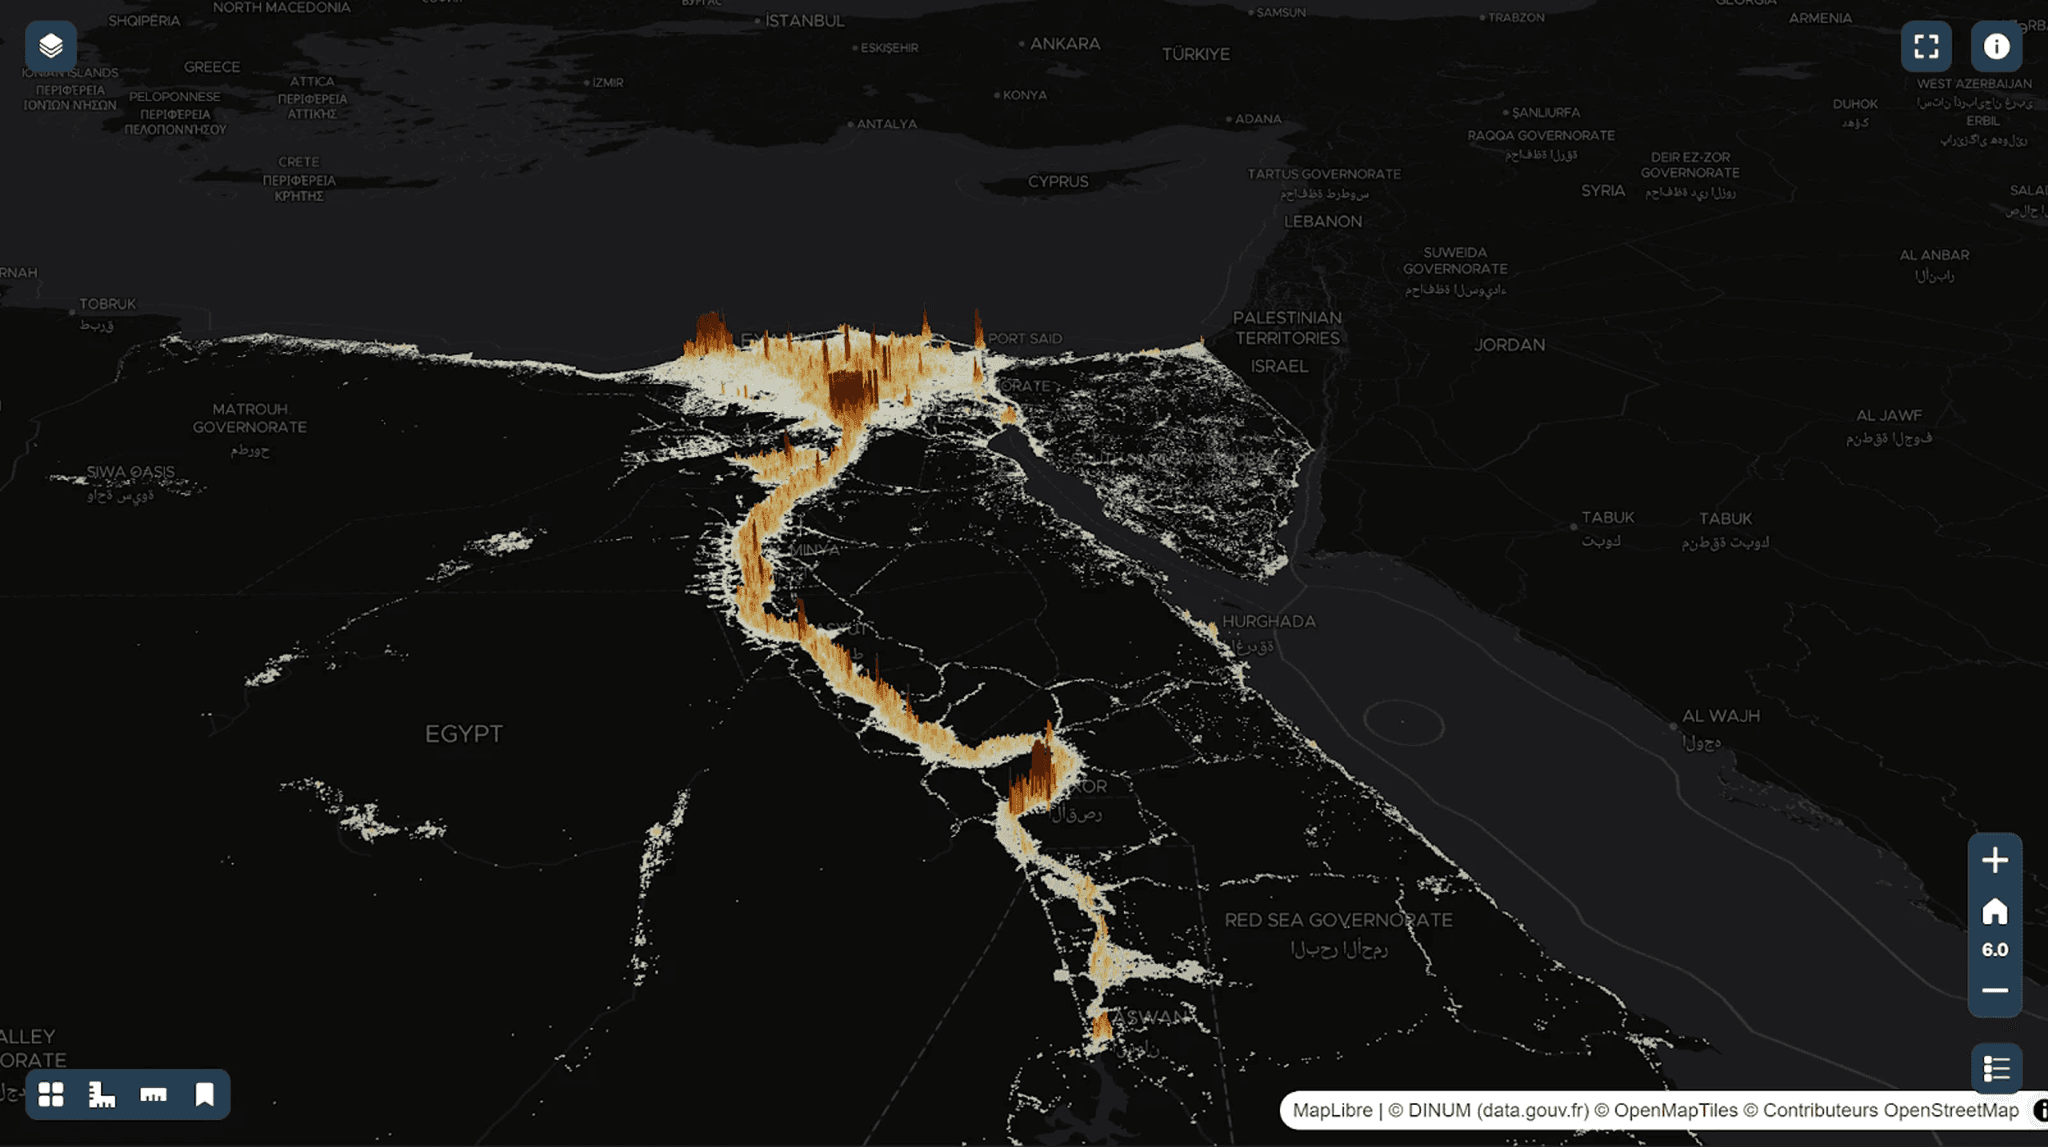
Settlement along the Nile River hexagons 400 m
FAQ
Why are hexagonal grids used in GIS instead of square grids?
Hexagonal grids provide equal distances between neighboring cells, which helps reduce spatial distortion and improves the accuracy of spatial analysis.
What types of data are commonly analyzed using hexagonal grids?
Hexagonal grids are often used to analyze population density, environmental indicators, mobility patterns, and other spatial statistics.
Where are hexagonal grids used outside of traditional GIS applications?
They are also used in transportation analytics, big data platforms, and even game design, such as the map structure in the Civilization series.
Key Takeaways
Hexagonal grids divide geographic space into cells that maintain equal distances between neighboring units, making spatial analysis more consistent.
Compared to square grids, hexagonal grids often represent spatial patterns more smoothly and reduce directional bias in data visualization.
They are widely used in modern geospatial analysis systems, including large-scale data platforms such as Uber’s H3 index.


