
Map projections are the foundation of any map. Because the Earth has a nearly spherical shape (more precisely, a geoid), it cannot be accurately depicted on a flat surface without distortion. A map projection is a mathematical method for transferring coordinates from the Earth's surface to a map plane. The choice of projection determines which map characteristics will be preserved and which will inevitably be distorted.
Why Projections Are Needed
When transferring a spherical surface to a flat surface, four main types of distortion arise:
area
shape
distance
direction
It is impossible to preserve all of these properties simultaneously. Therefore, each map projection is optimized for specific tasks. For example, some projections are better suited for navigation, while others are better suited for displaying global processes or statistical data.
This is why a large number of different projections are used in GIS and cartography.
History and Origin of Map Projections
The first map projections appeared in antiquity. One of the first known examples is the Ptolemaic projection, described in the 2nd century CE. The Mercator projection was first developed by the Greek scientist Claudius Ptolemy. His work laid the foundation for mathematical cartography.
Later, in the 16th century, one of the most famous projections was developed – the Mercator projection. It was proposed by the Flemish cartographer Gerardus Mercator in 1569. This projection preserves directions and angles, making it particularly useful for maritime navigation. However, it significantly distorts the size of territories closer to the poles.
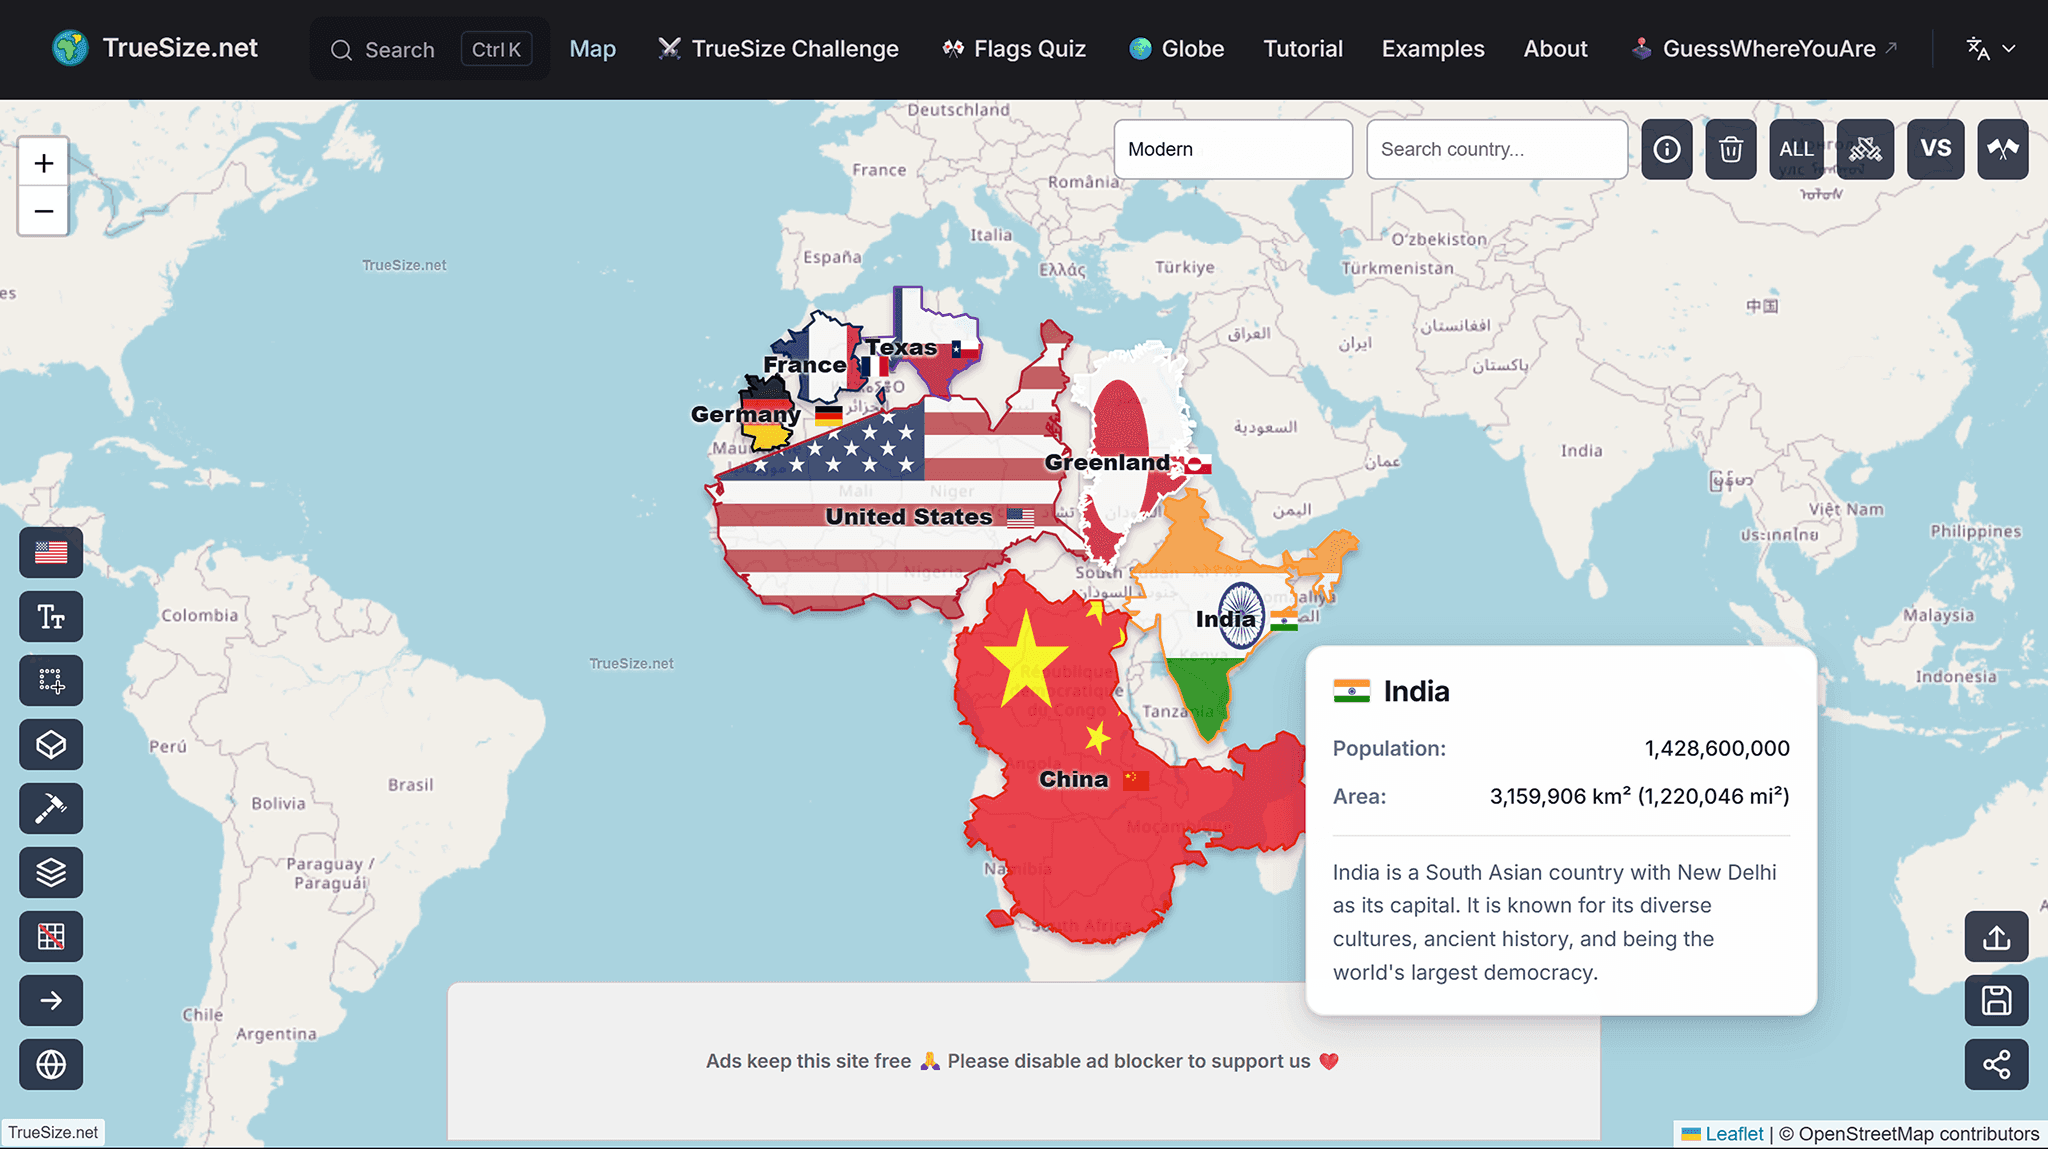
The TrueSize website shows the actual area of countries in comparison to each other.
You can see the actual areas of different countries here.
In the 18th and 19th centuries, developments in geodesy and mathematics led to the development of a large number of new projections. These include:
Lambert Conformal Conic: widely used in aviation and cartography in temperate latitudes
Albers Equal Area: used for maps where area conservation is important
Robinson projection: a compromise projection for world maps
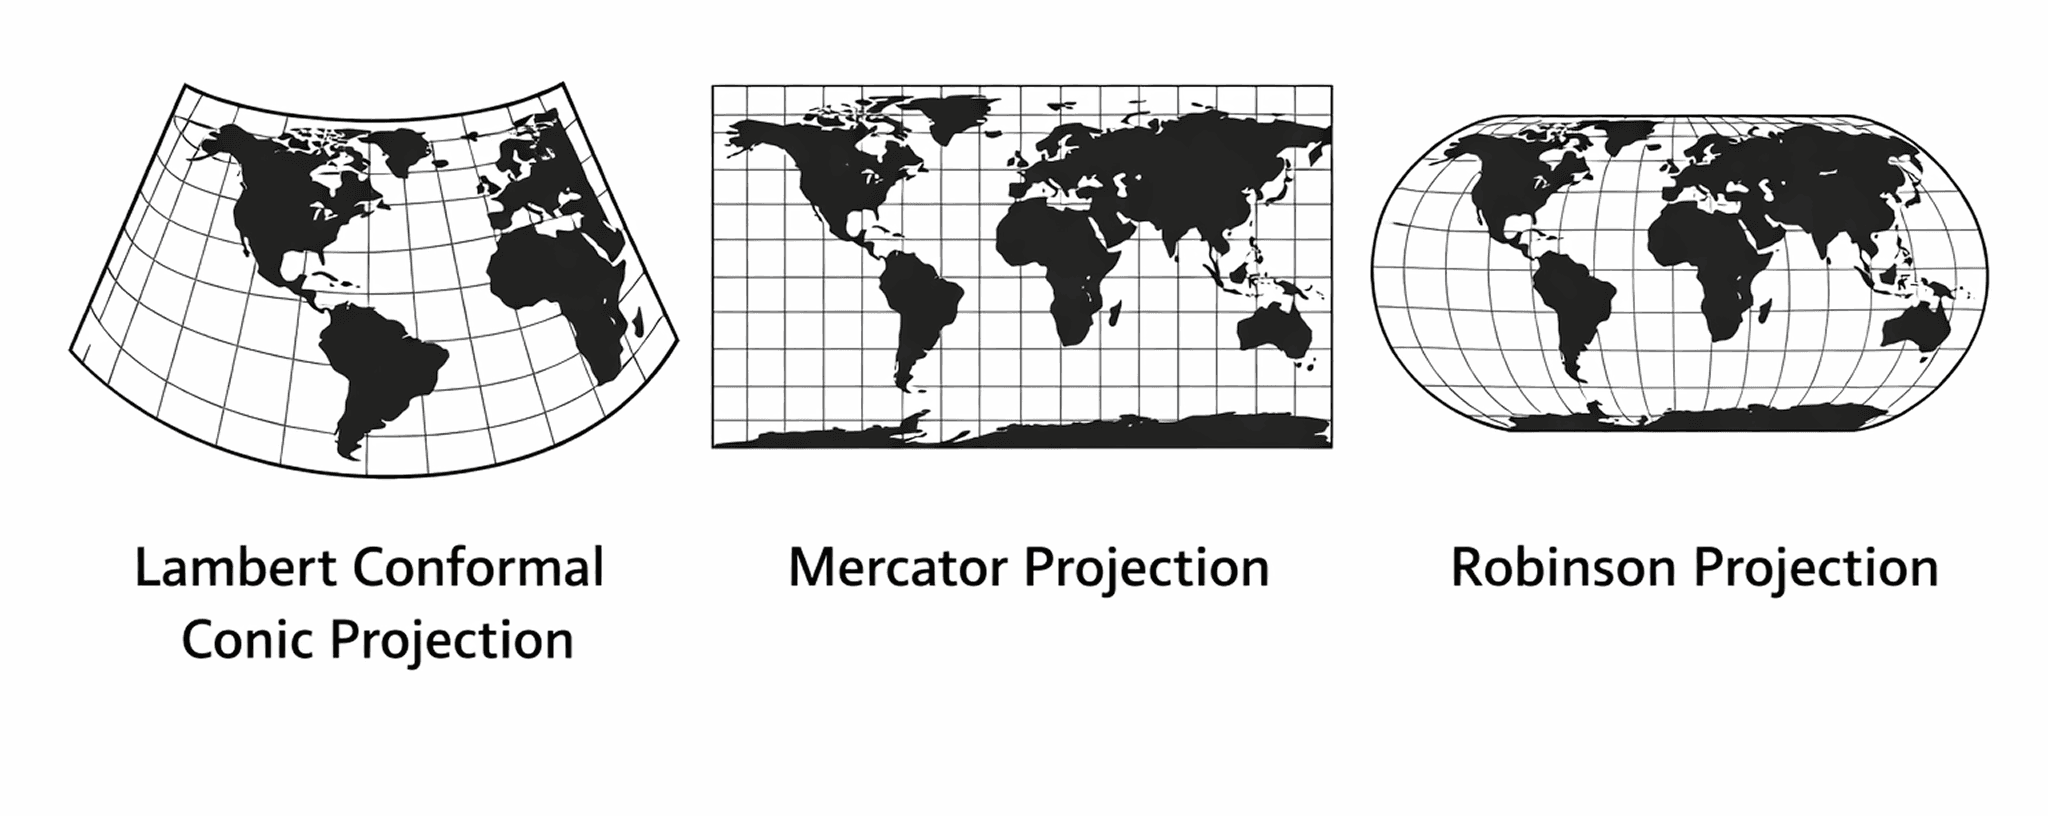
Comparison of map projections
Today, there are several hundred different map projections.
Main Types of Map Projections
Depending on their geometric model, projections are usually divided into three main groups.
Cylindrical Projections
In cylindrical projections, the Earth's surface is projected onto a cylinder. After unrolling the cylinder, a rectangular map is obtained.
The most famous example is the Mercator projection. It is widely used in web mapping (for example, in Google Maps and OpenStreetMap).
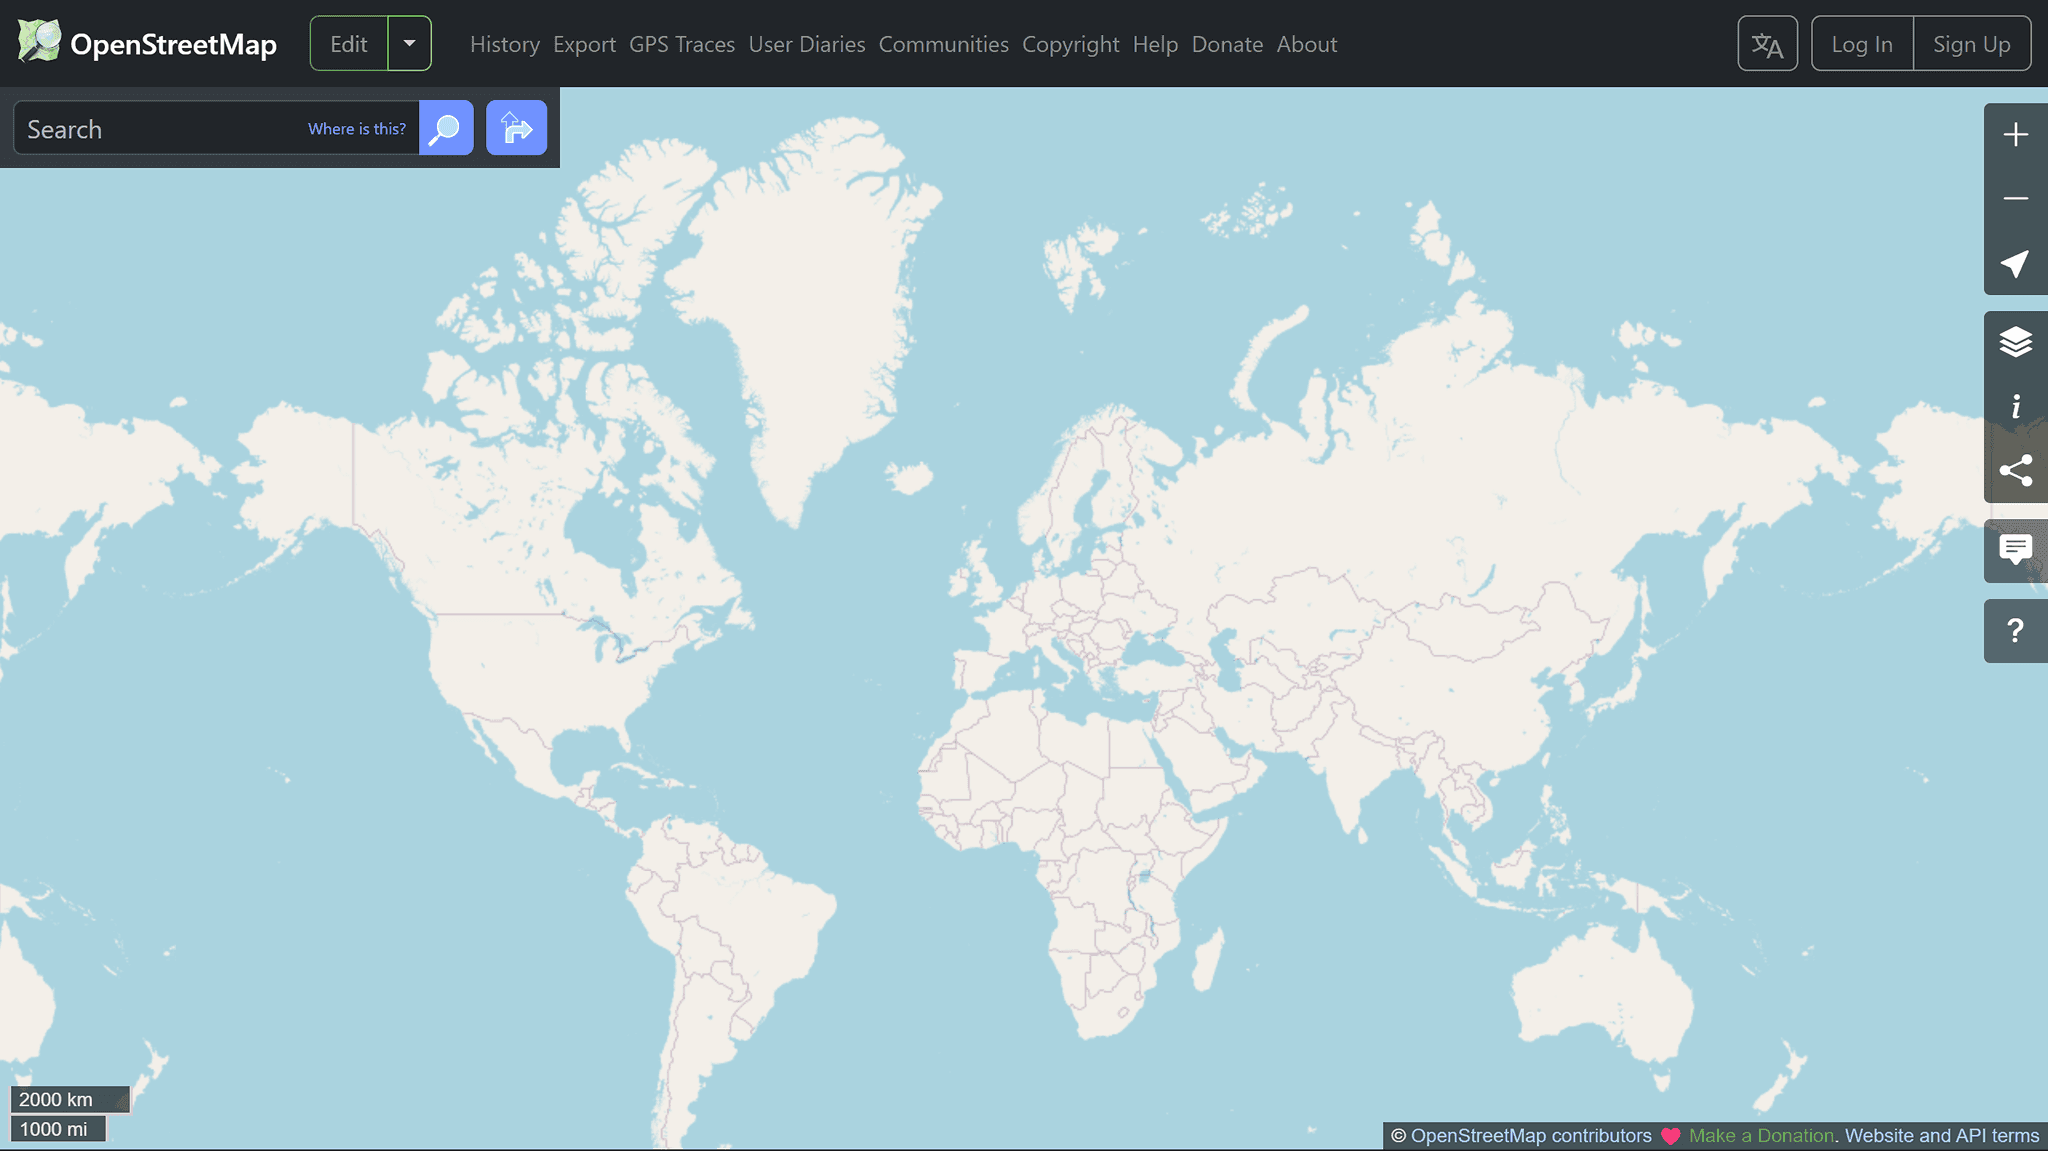
An example of using the Mercator projection on the OpenStreetMap.
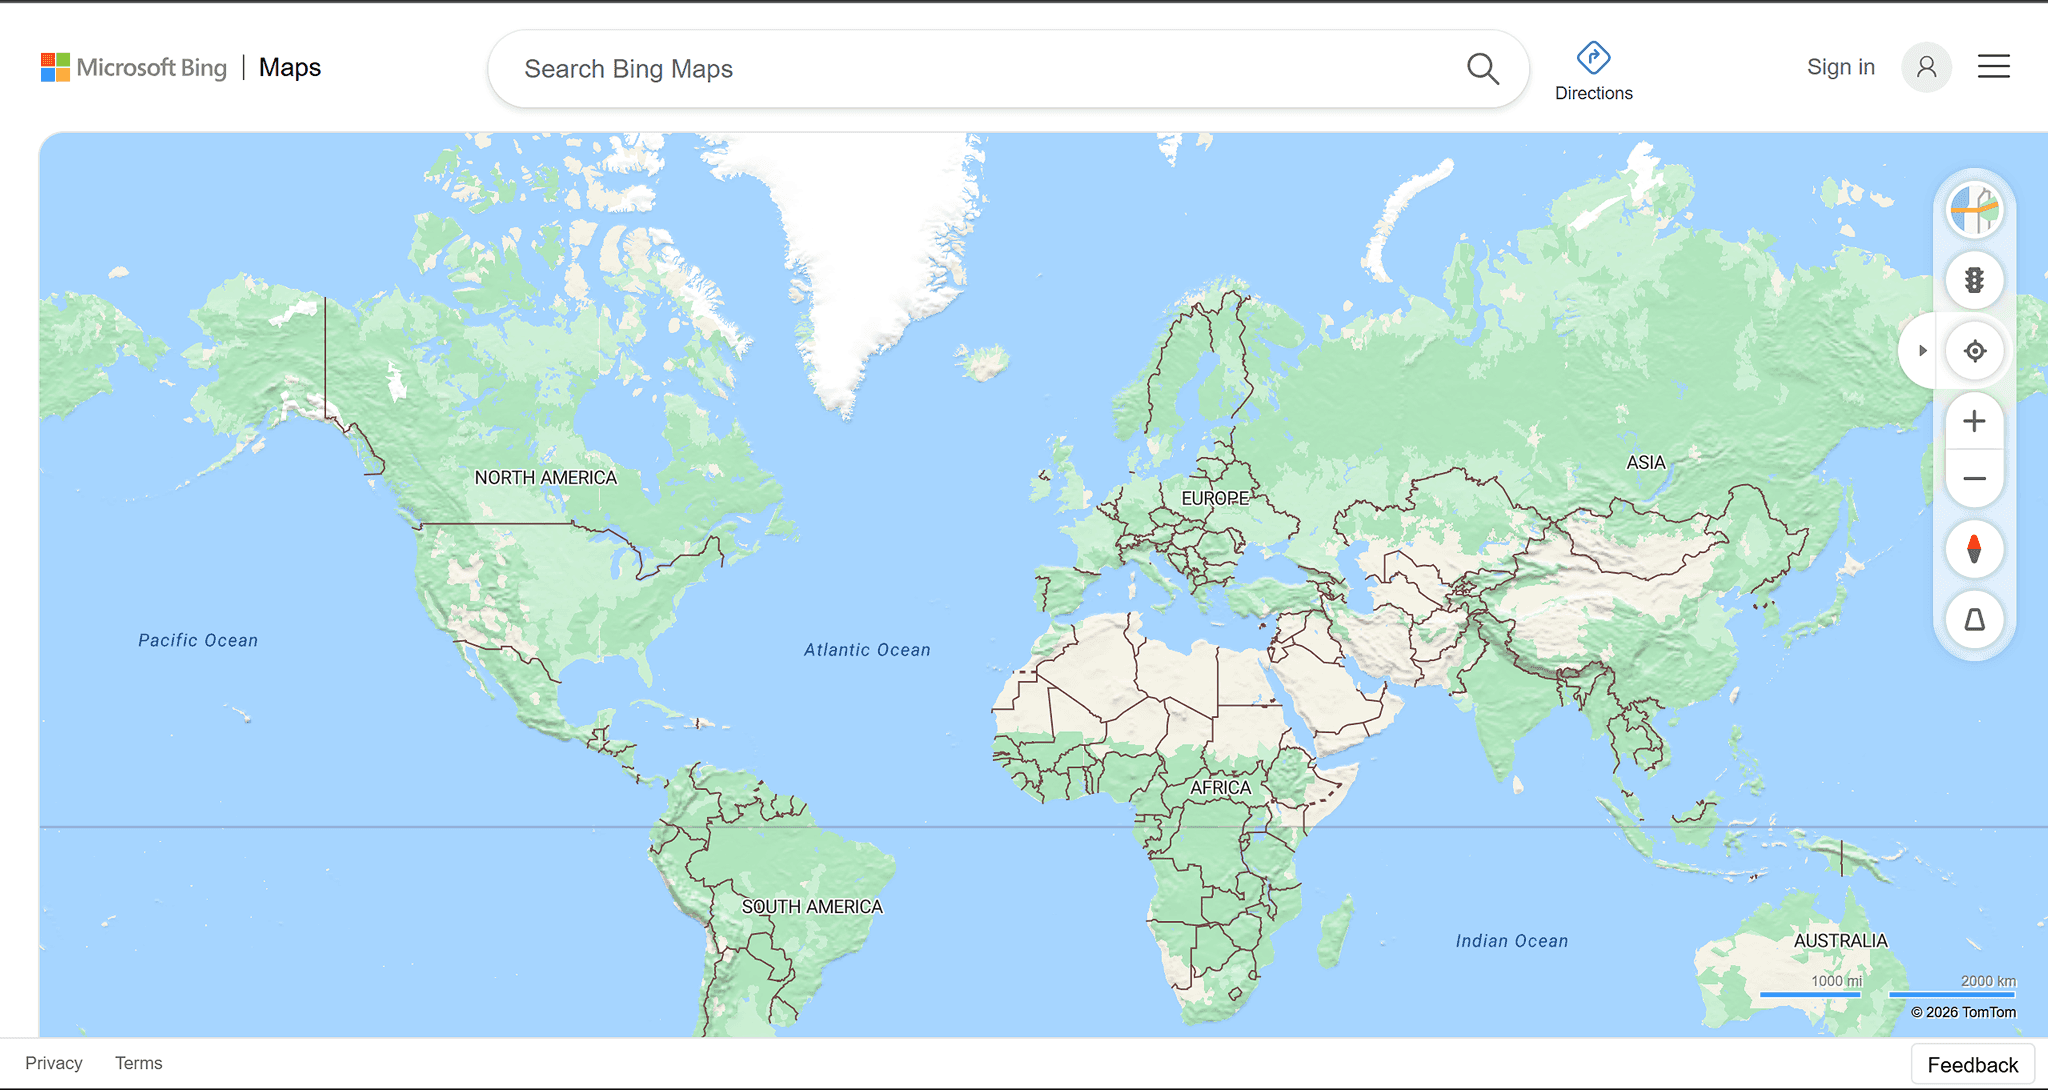
An example of using the Mercator projection on the Bing maps.
Applications:
marine navigation
web maps
global maps of the world
Conic Projections
In conic projections, the Earth's surface is projected onto a cone. These projections are well suited for mid-latitude regions. An example is the Lambert Conformal Conic, which is often used for national mapping systems.
Application:
national maps
aviation charts
regional studies
Azimuthal projections
Azimuthal projections are constructed by projecting the Earth's surface onto a plane tangent to a sphere at a single point.
They are often used for maps of polar regions or for displaying distances from a single central point.
Application:
polar maps
aviation
global geographic models
Projections in modern GIS
In geographic information systems, the choice of projection plays a key role in analyzing spatial data. For example:
metric projections (UTM) are often used for calculating distances
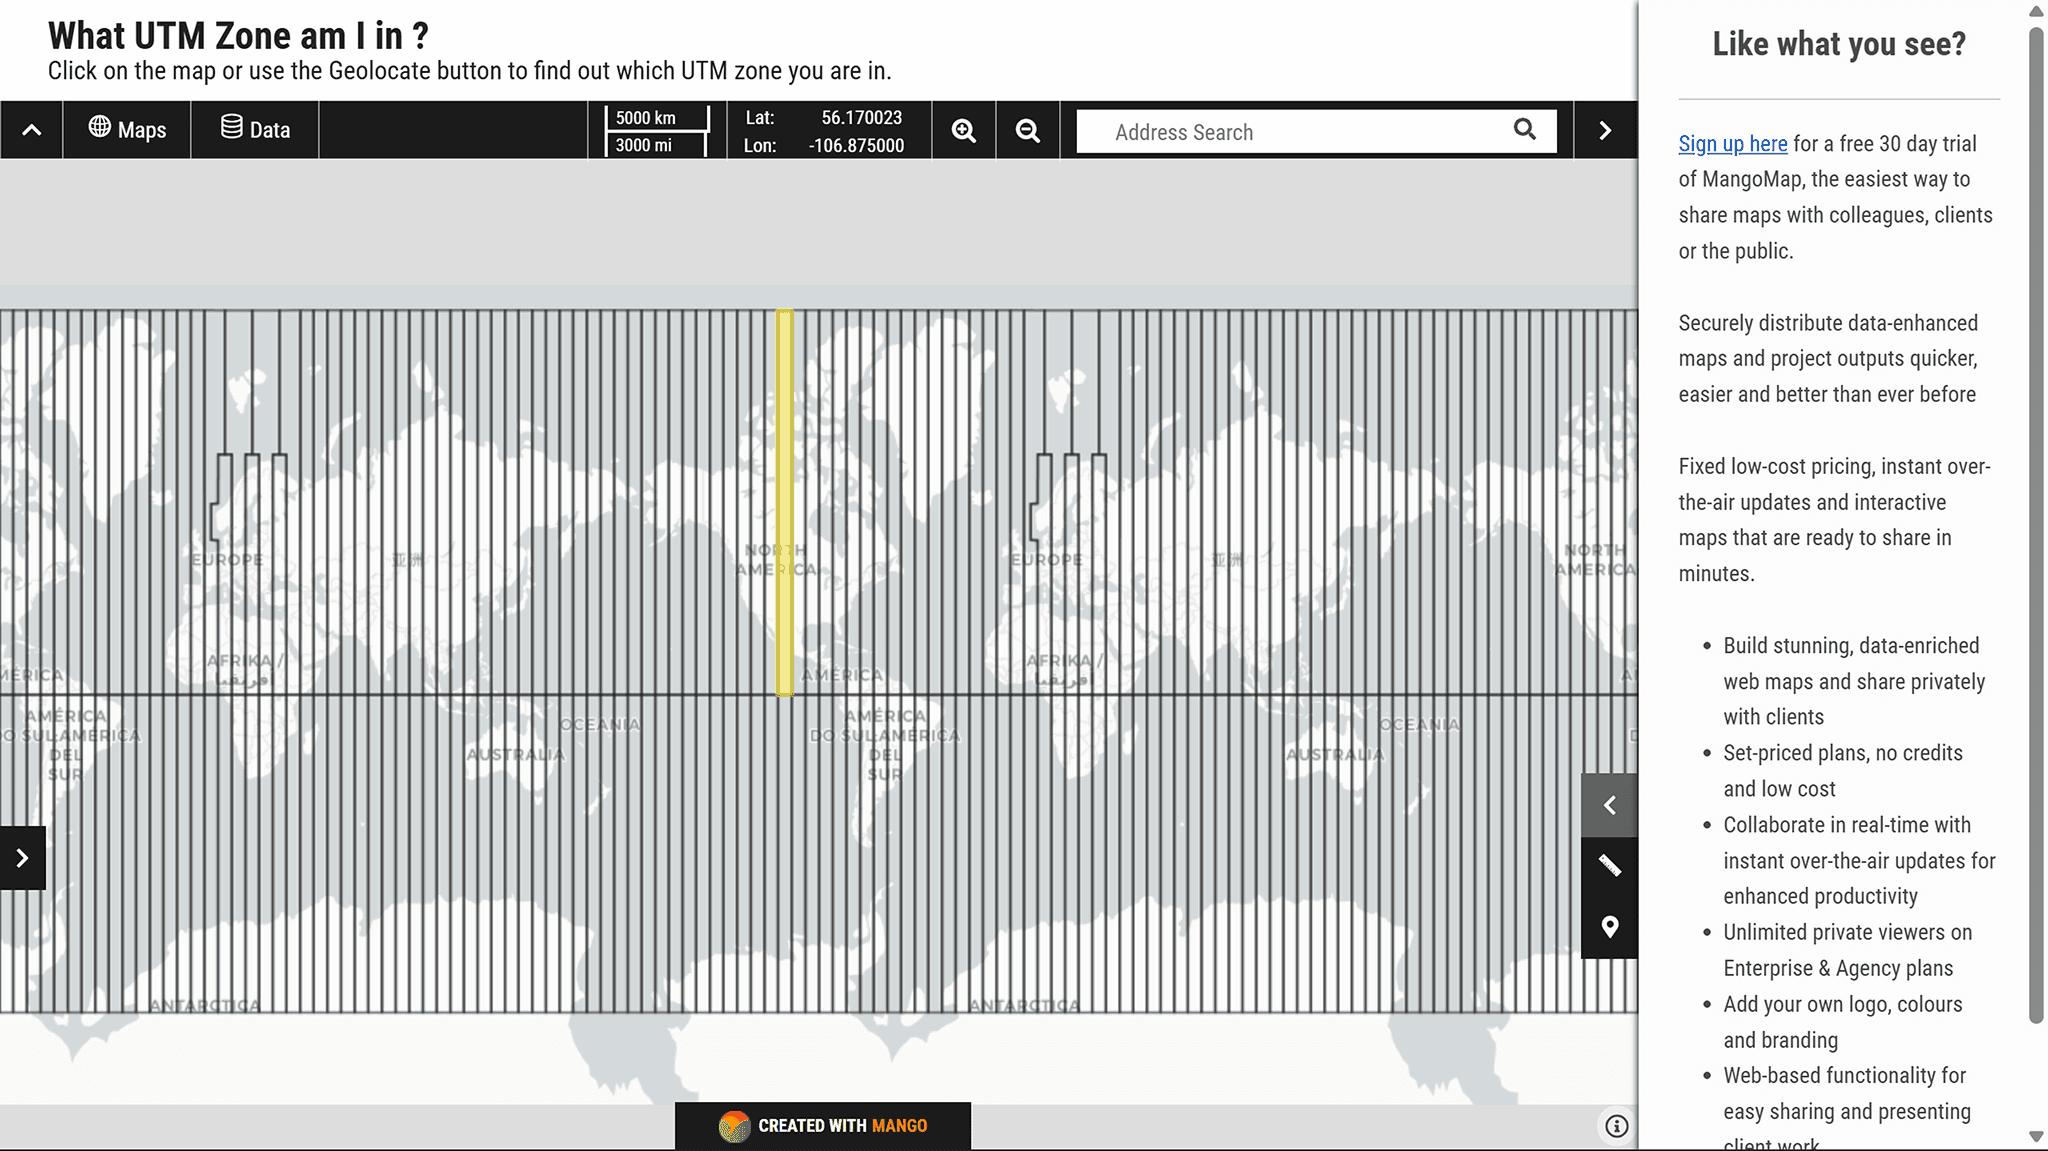
UTM zones on the Mangomap website.
You can determine the UTM zone on the website Mangomap.
equal-area projections are used to display global processes
conformal projections are used for navigation tasks
Most GIS platforms use coordinate systems based on EPSG standards, where each coordinate system and projection is assigned a unique code.
Useful Websites for Studying Map Projections
There are several interesting online resources that allow you to study and compare different map projections.
Projection Wizard – a tool for choosing the appropriate map projection for a specific area and taskEPSG.io – a database of coordinate systems and map projections used in GISPROJ – one of the main libraries for working with coordinate systems and projection transformationsNASA Earth Observatory projections page – an explanation of different map projections with examples
GISCARTA Projections
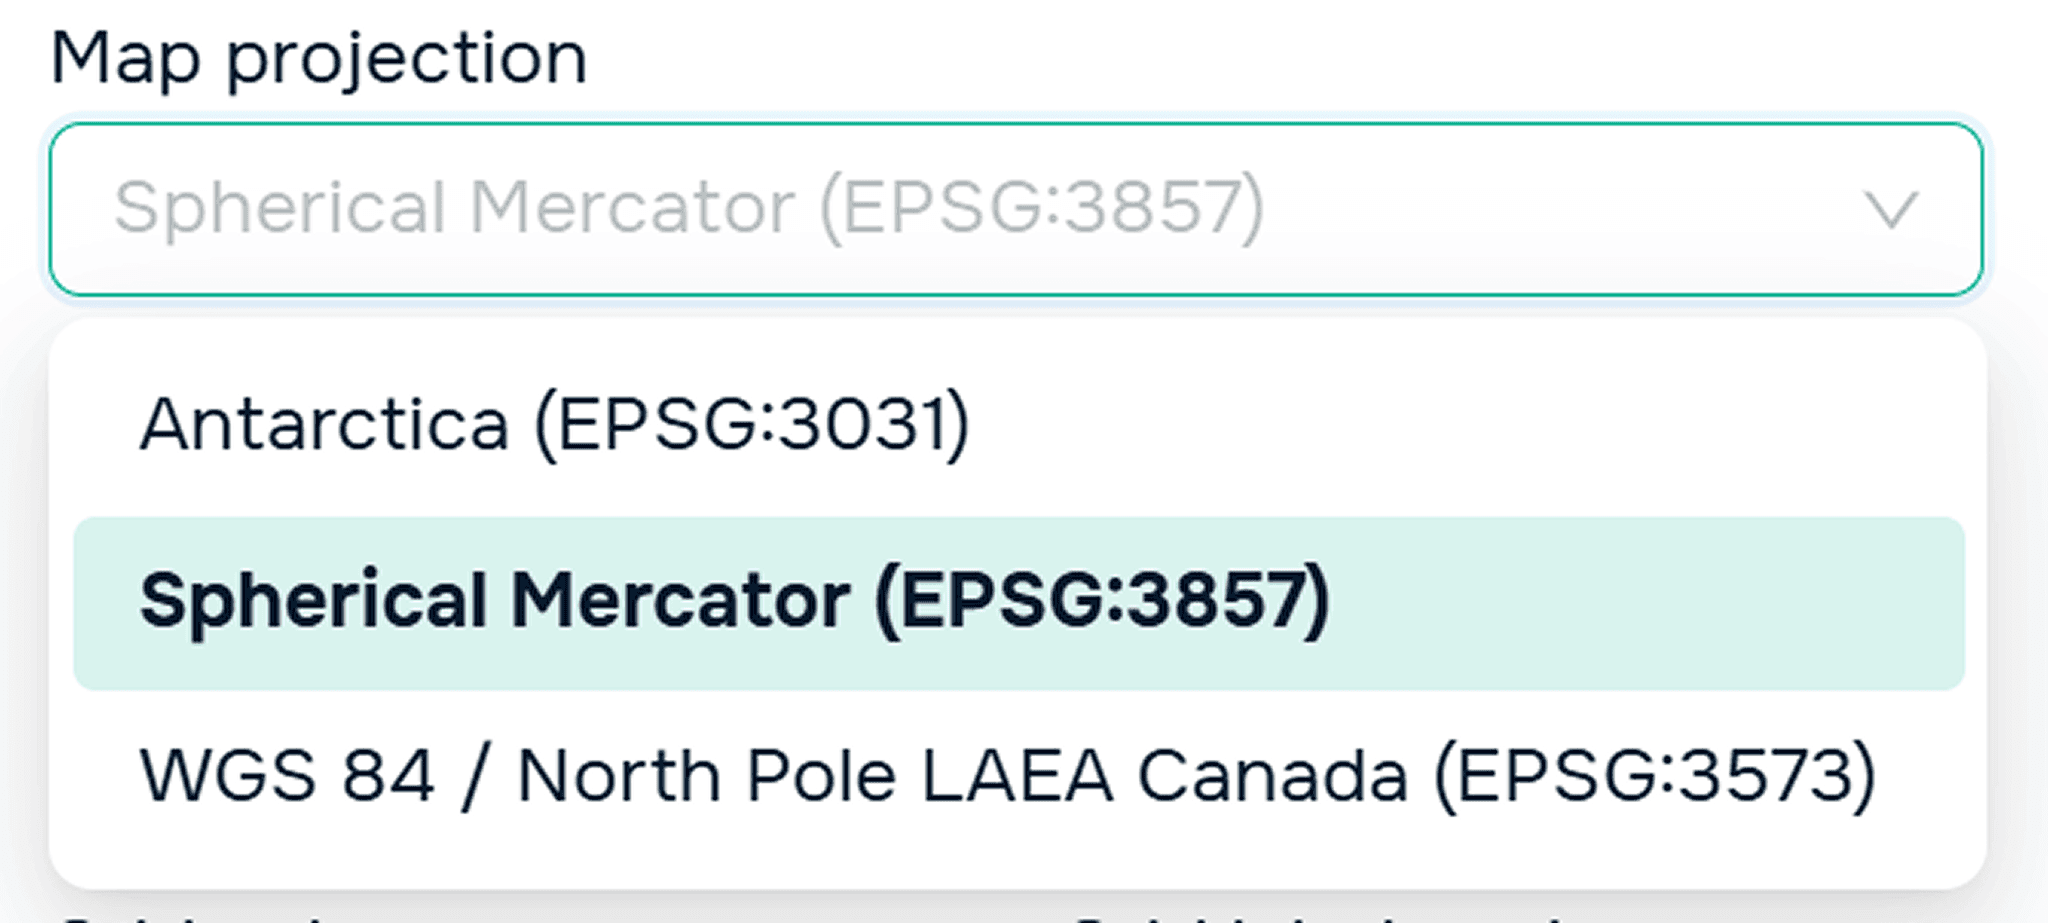
The following projections are available when creating projects on our platform:
– Antarctica (EPSG:3031)
– Spherical Mercator (EPSG:3857)
– North Pole LAEA Canada (EPSG:3573)
To configure a project's projection, go to the Settings section.
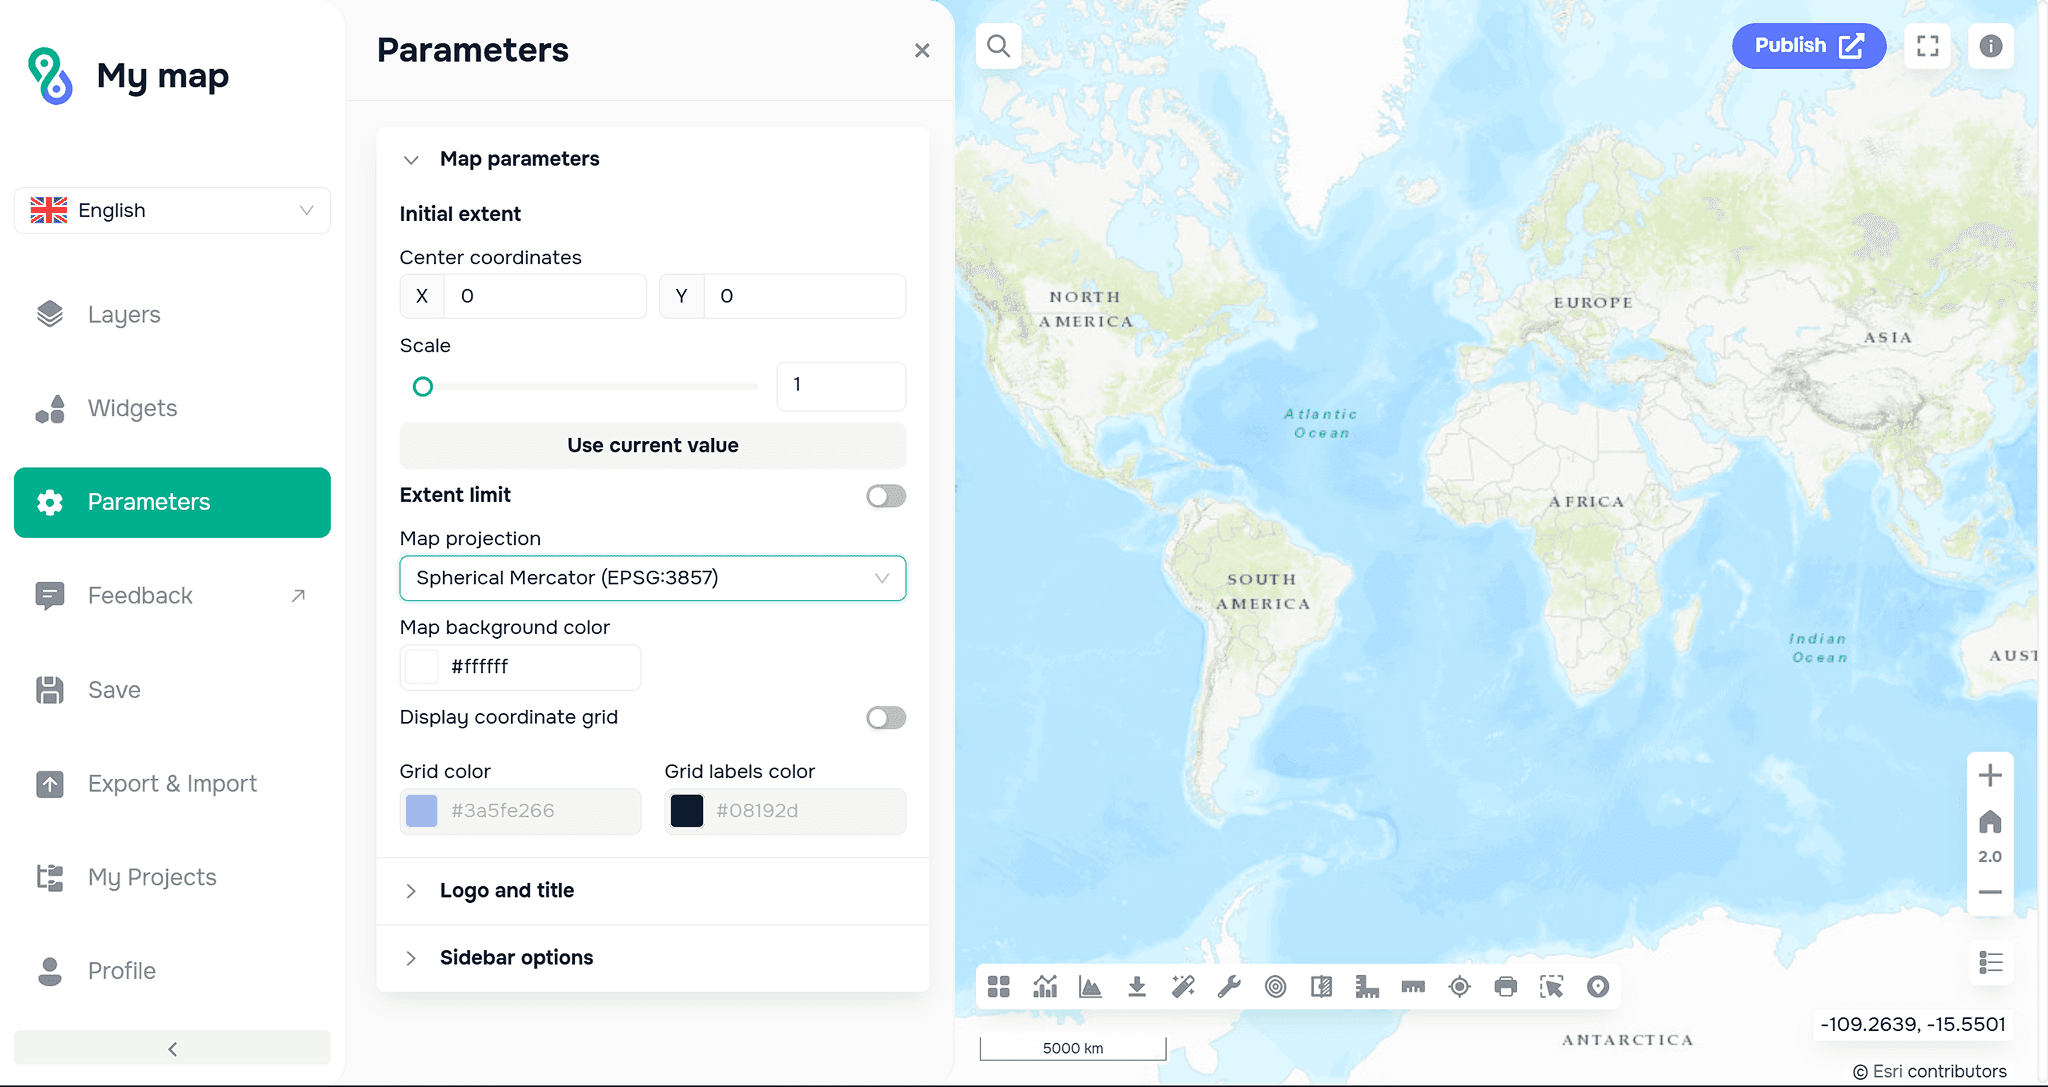
Then select the projection you are interested in.
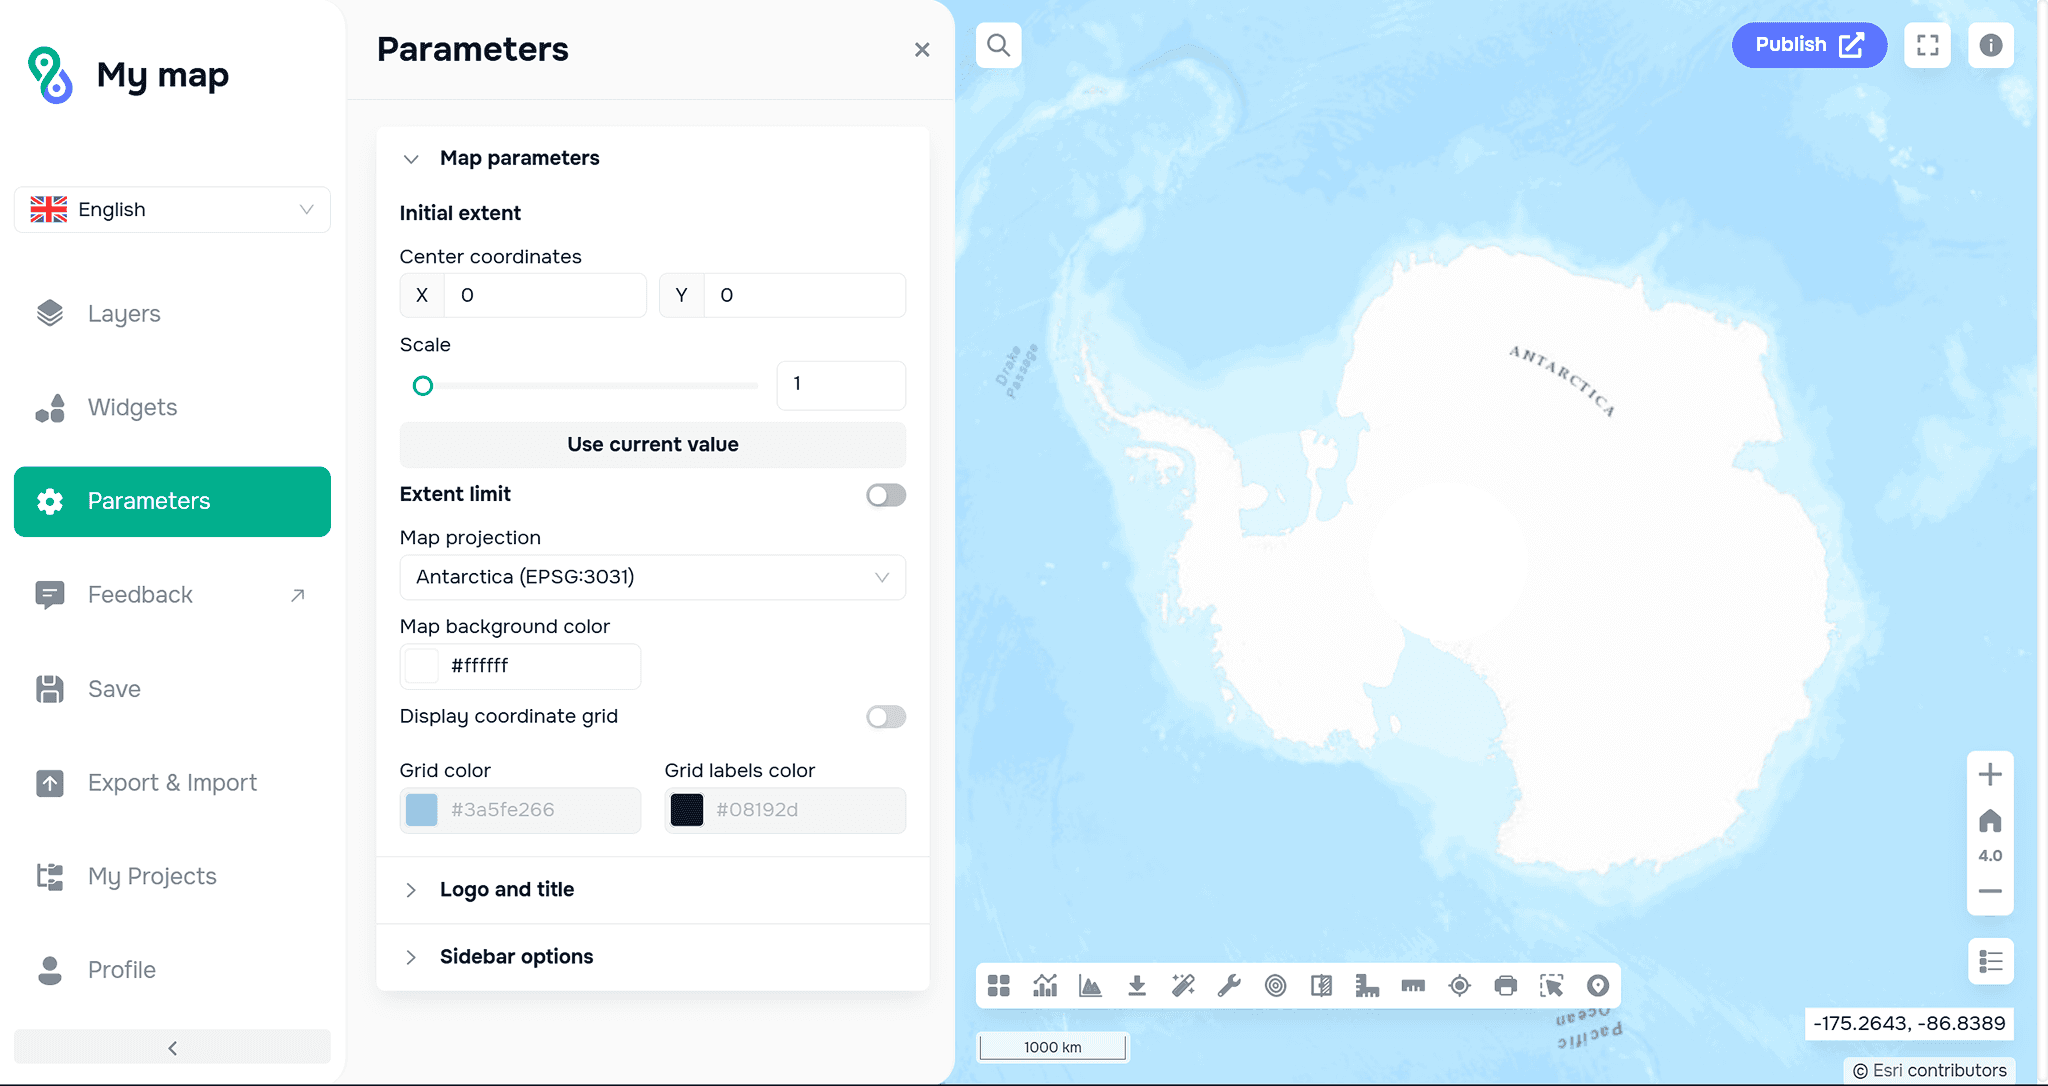
Example of Arctic projection on the GISCARTA.
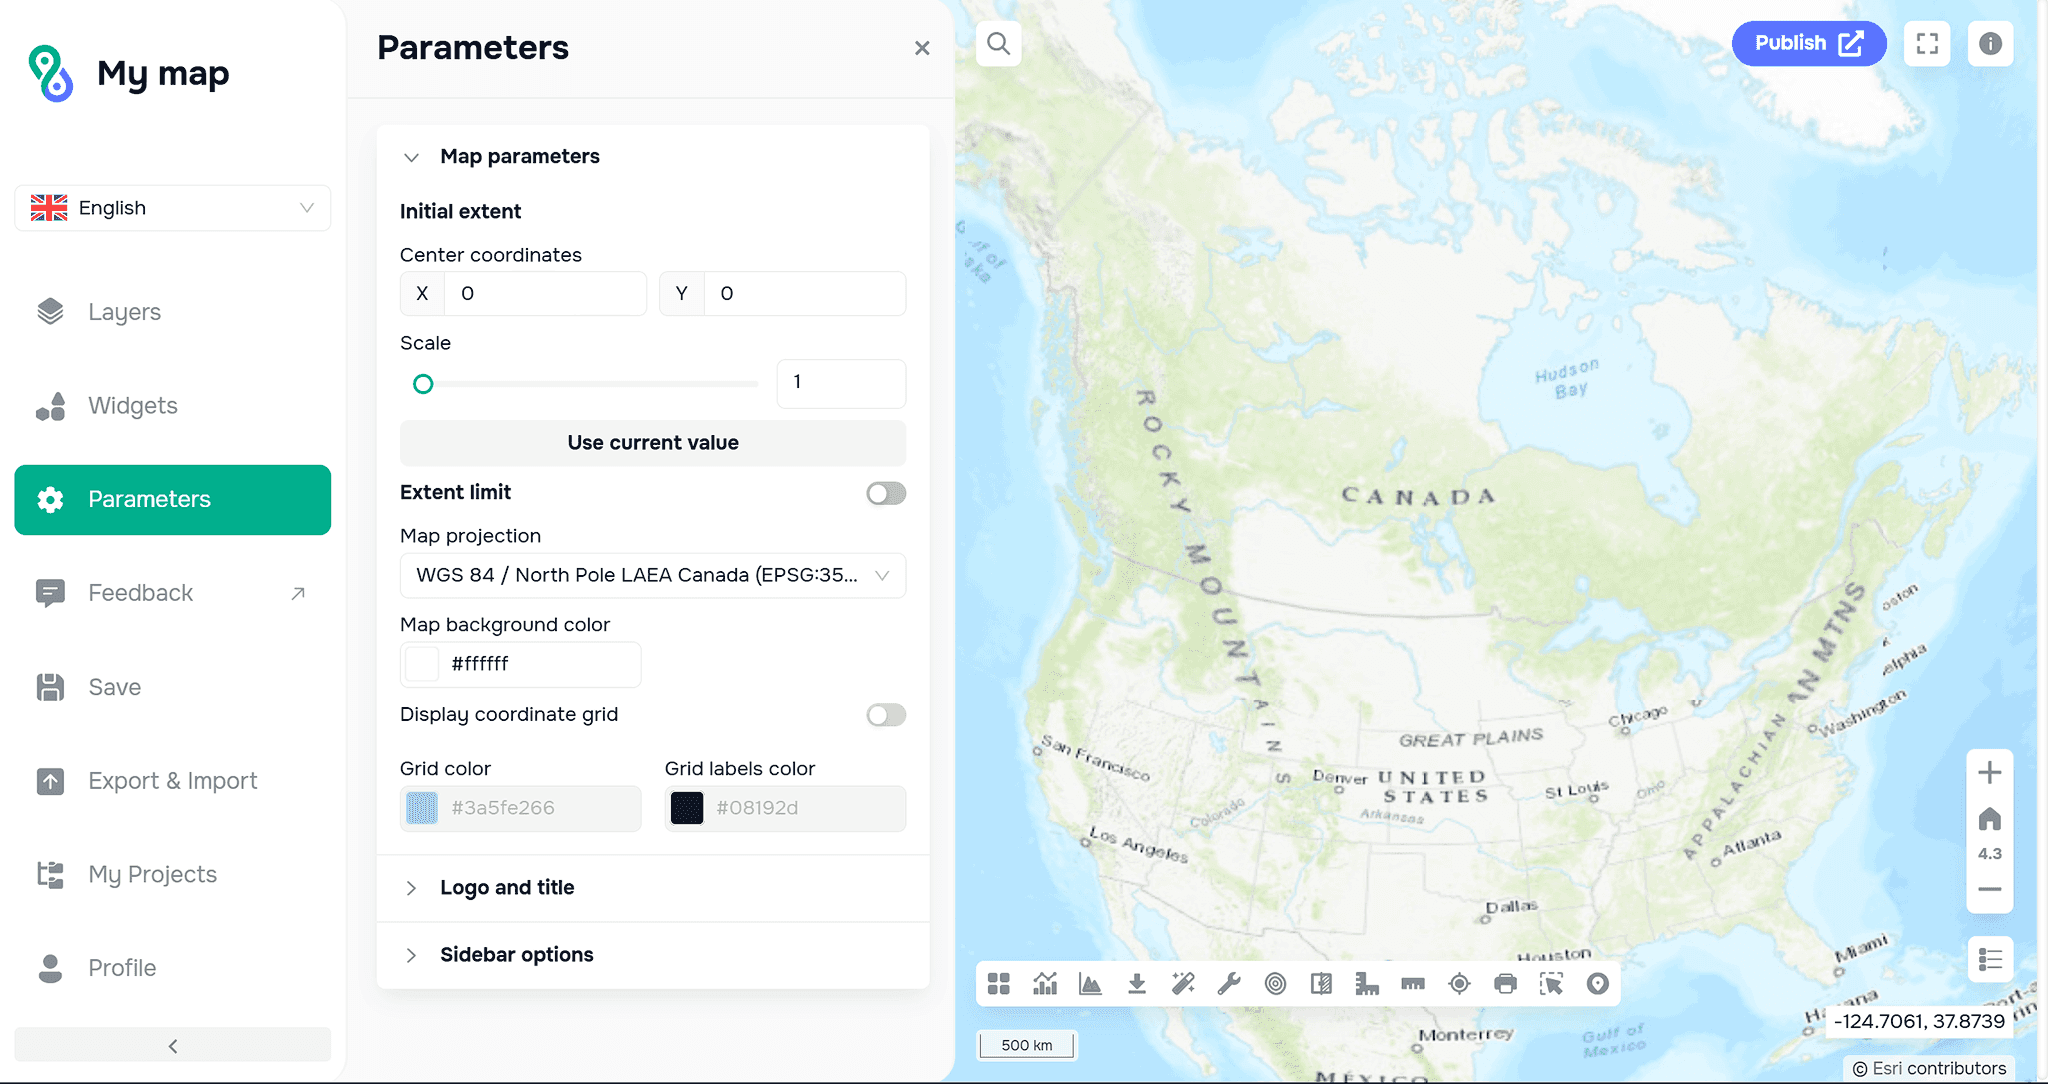
Example of North Pole LAEA Canada projection on the GISCARTA.
FAQ
Why do web maps usually use the Mercator projection?
Web mapping platforms use the Web Mercator projection (EPSG:3857) because it simplifies tile generation and allows maps to be easily displayed and zoomed at different scales.
What happens if the wrong projection is used in GIS analysis?
Using an inappropriate projection can lead to incorrect distance, area, or spatial analysis results, especially when working with large territories.
How do GIS platforms know which projection a dataset uses?
Most geospatial datasets include coordinate system information (for example, a .prj file or EPSG code), which GIS software reads to correctly display and transform the data.
Key Takeaways
Map projections are mathematical transformations that allow the spherical Earth to be represented on a flat map.
Different projections are designed for different tasks, such as navigation, regional mapping, or global statistical visualization.
In modern GIS workflows, projections are managed using coordinate system standards like EPSG codes.


