Raster and vector are the two ways GIS represents the world. A raster divides space into a regular grid and stores a value for every cell; a vector stores discrete objects as coordinates with attributes. Almost every project uses both, so the practical question is which model fits which phenomenon, and what happens at the points where the two meet.
Raster vs Vector Data: What Is the Difference?
The difference is what carries the information. In a raster, position is implicit: the grid origin, the cell size and the row and column number define where a cell is, and the stored value describes what is there. In a vector dataset, position is explicit: every point, vertex and polygon boundary has its own coordinates, and the attributes live in a table linked to the geometry.
Raster vs Vector Data
Feature | Raster | Vector |
Data model | Regular grid of cells | Points, lines and polygons |
Position | Implicit, from origin and cell size | Explicit coordinates |
Attributes | One value per cell in each band | Table with any number of fields |
Spatial detail | Limited by cell size | Limited by coordinate precision |
Boundaries | Stepped along cell edges | Exact lines |
Continuous phenomena | Natural fit | Approximated by contours or TIN |
Discrete objects | Approximated | Natural fit |
Topology | Not stored | Supported by several formats |
Size behaviour | Grows with the square of resolution | Grows with the number of vertices |
Typical analysis | Map algebra, terrain, classification | Overlay, buffers, joins, networks |
Common formats | GeoTIFF and COG, NetCDF, Zarr, JPEG 2000 | GeoPackage, shapefile, GeoJSON, PostGIS |
Typical data | Imagery, elevation, climate, land cover | Parcels, roads, utilities, addresses |
What Is Raster Data?
A raster is a matrix of cells with a defined origin, cell size and coordinate system. Each cell holds a number: reflectance in a satellite band, elevation in metres, a land-cover class code, a temperature. Files usually contain several bands, so one dataset can carry the spectral channels of an image or the time steps of a climate series.
Two properties determine how a raster behaves in practice. The first is the data type, which sets both the range of values and the file size: an 8-bit band holds values from 0 to 255, while a 32-bit float band takes four times the space and carries decimals. The second is the NoData value, which marks cells outside the area of interest so they are excluded from statistics and analysis.
What Is Vector Data?
Vector data describes objects with boundaries: a point for a well, a line for a pipeline, a polygon for a parcel. The geometry is a list of coordinates, so an object can be positioned as precisely as the survey allows, and it is independent of any grid.
The attribute table is what makes vector data expressive. One polygon can carry dozens of fields of different types, be joined to external tables, and be queried by any combination of them. Formats such as GeoPackage and PostGIS add topology rules, constraints and indexes, which is why cadastral, utility and infrastructure data is almost always vector.
Resolution, Accuracy and Size
For rasters, cell size determines everything. Halving it quadruples the number of cells, so moving a regional dataset from 10 m to 5 m turns a 1 GB file into 4 GB, and from 10 m to 1 m into a hundredfold increase. Choosing the coarsest cell size that still answers the question is the single most effective way to keep a raster project manageable.
Vector size depends on geometric complexity rather than on the area covered. A country boundary digitized from a 1:1,000,000 map and the same boundary from a cadastral survey occupy very different amounts of space, although both describe the same country. This is also why simplification is the standard tool for publishing vector data on the web: dropping vertices that are invisible at the display scale can cut a file by an order of magnitude.
Accuracy is worth separating from resolution in both models. A 1 m raster is not automatically accurate to a metre, and a polygon drawn with ten decimal places is not accurate to a millimetre. In both cases the limit is set by the source data, not by the way it is stored.
What Each Model Does Well in Analysis
Rasters are built for continuous surfaces and for operations applied cell by cell. Map algebra combines layers arithmetically, slope and aspect are derived from an elevation model, distance surfaces, viewsheds, hydrological networks and least-cost paths all follow from the grid structure. The cost is that everything must share the same grid, so layers are usually resampled to a common cell size and alignment before analysis.
Vector analysis works with objects and their relationships: intersections, buffers, spatial joins, routing along a network, and aggregation by administrative boundaries. Results keep exact geometry and full attribute tables, which is what reporting and legal work require.
Most real workflows cross between the two. Zonal statistics summarize raster values inside vector polygons, which is how average rainfall per district or mean slope per parcel is computed, and it is usually more efficient than converting one model into the other.
Conversion Between the Models
Rasterization converts vectors to a grid, which is typically done to use polygons as a mask or as an input to raster analysis. Its cost is the boundary: a smooth parcel edge becomes a staircase, and small or narrow features can disappear if they do not cover a cell centre.
Vectorization goes the other way, turning classified rasters into polygons for land-cover maps or contour lines from elevation. The output inherits the grid: boundaries follow cell edges and the polygon count can be enormous unless the raster is generalized first. Neither operation recovers detail that the source does not have, which is why conversion should be treated as a step in an analysis, not as a way to improve data.

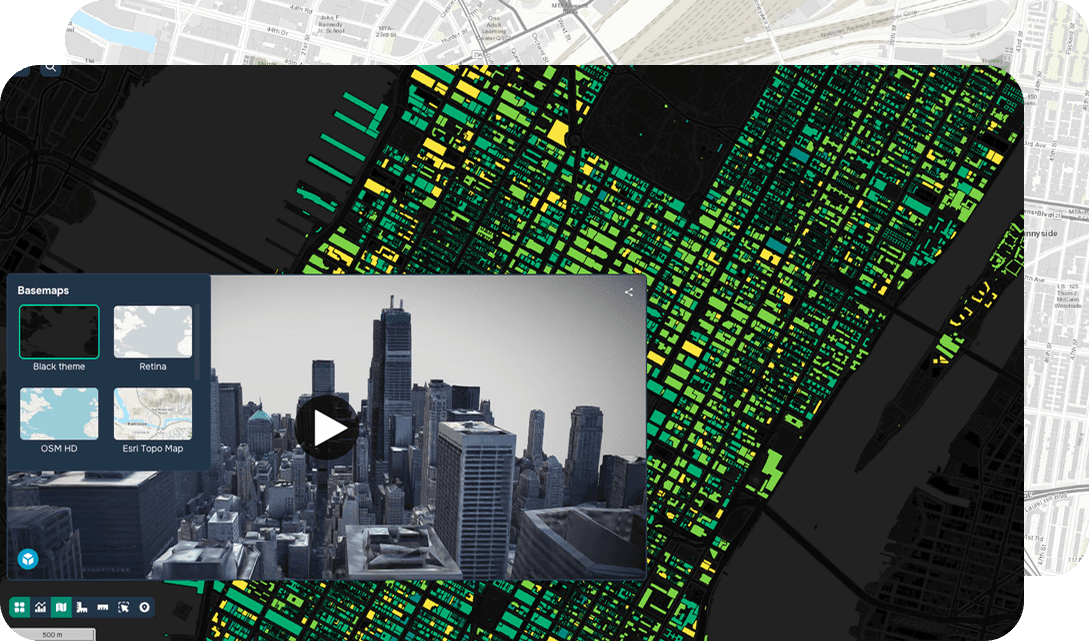
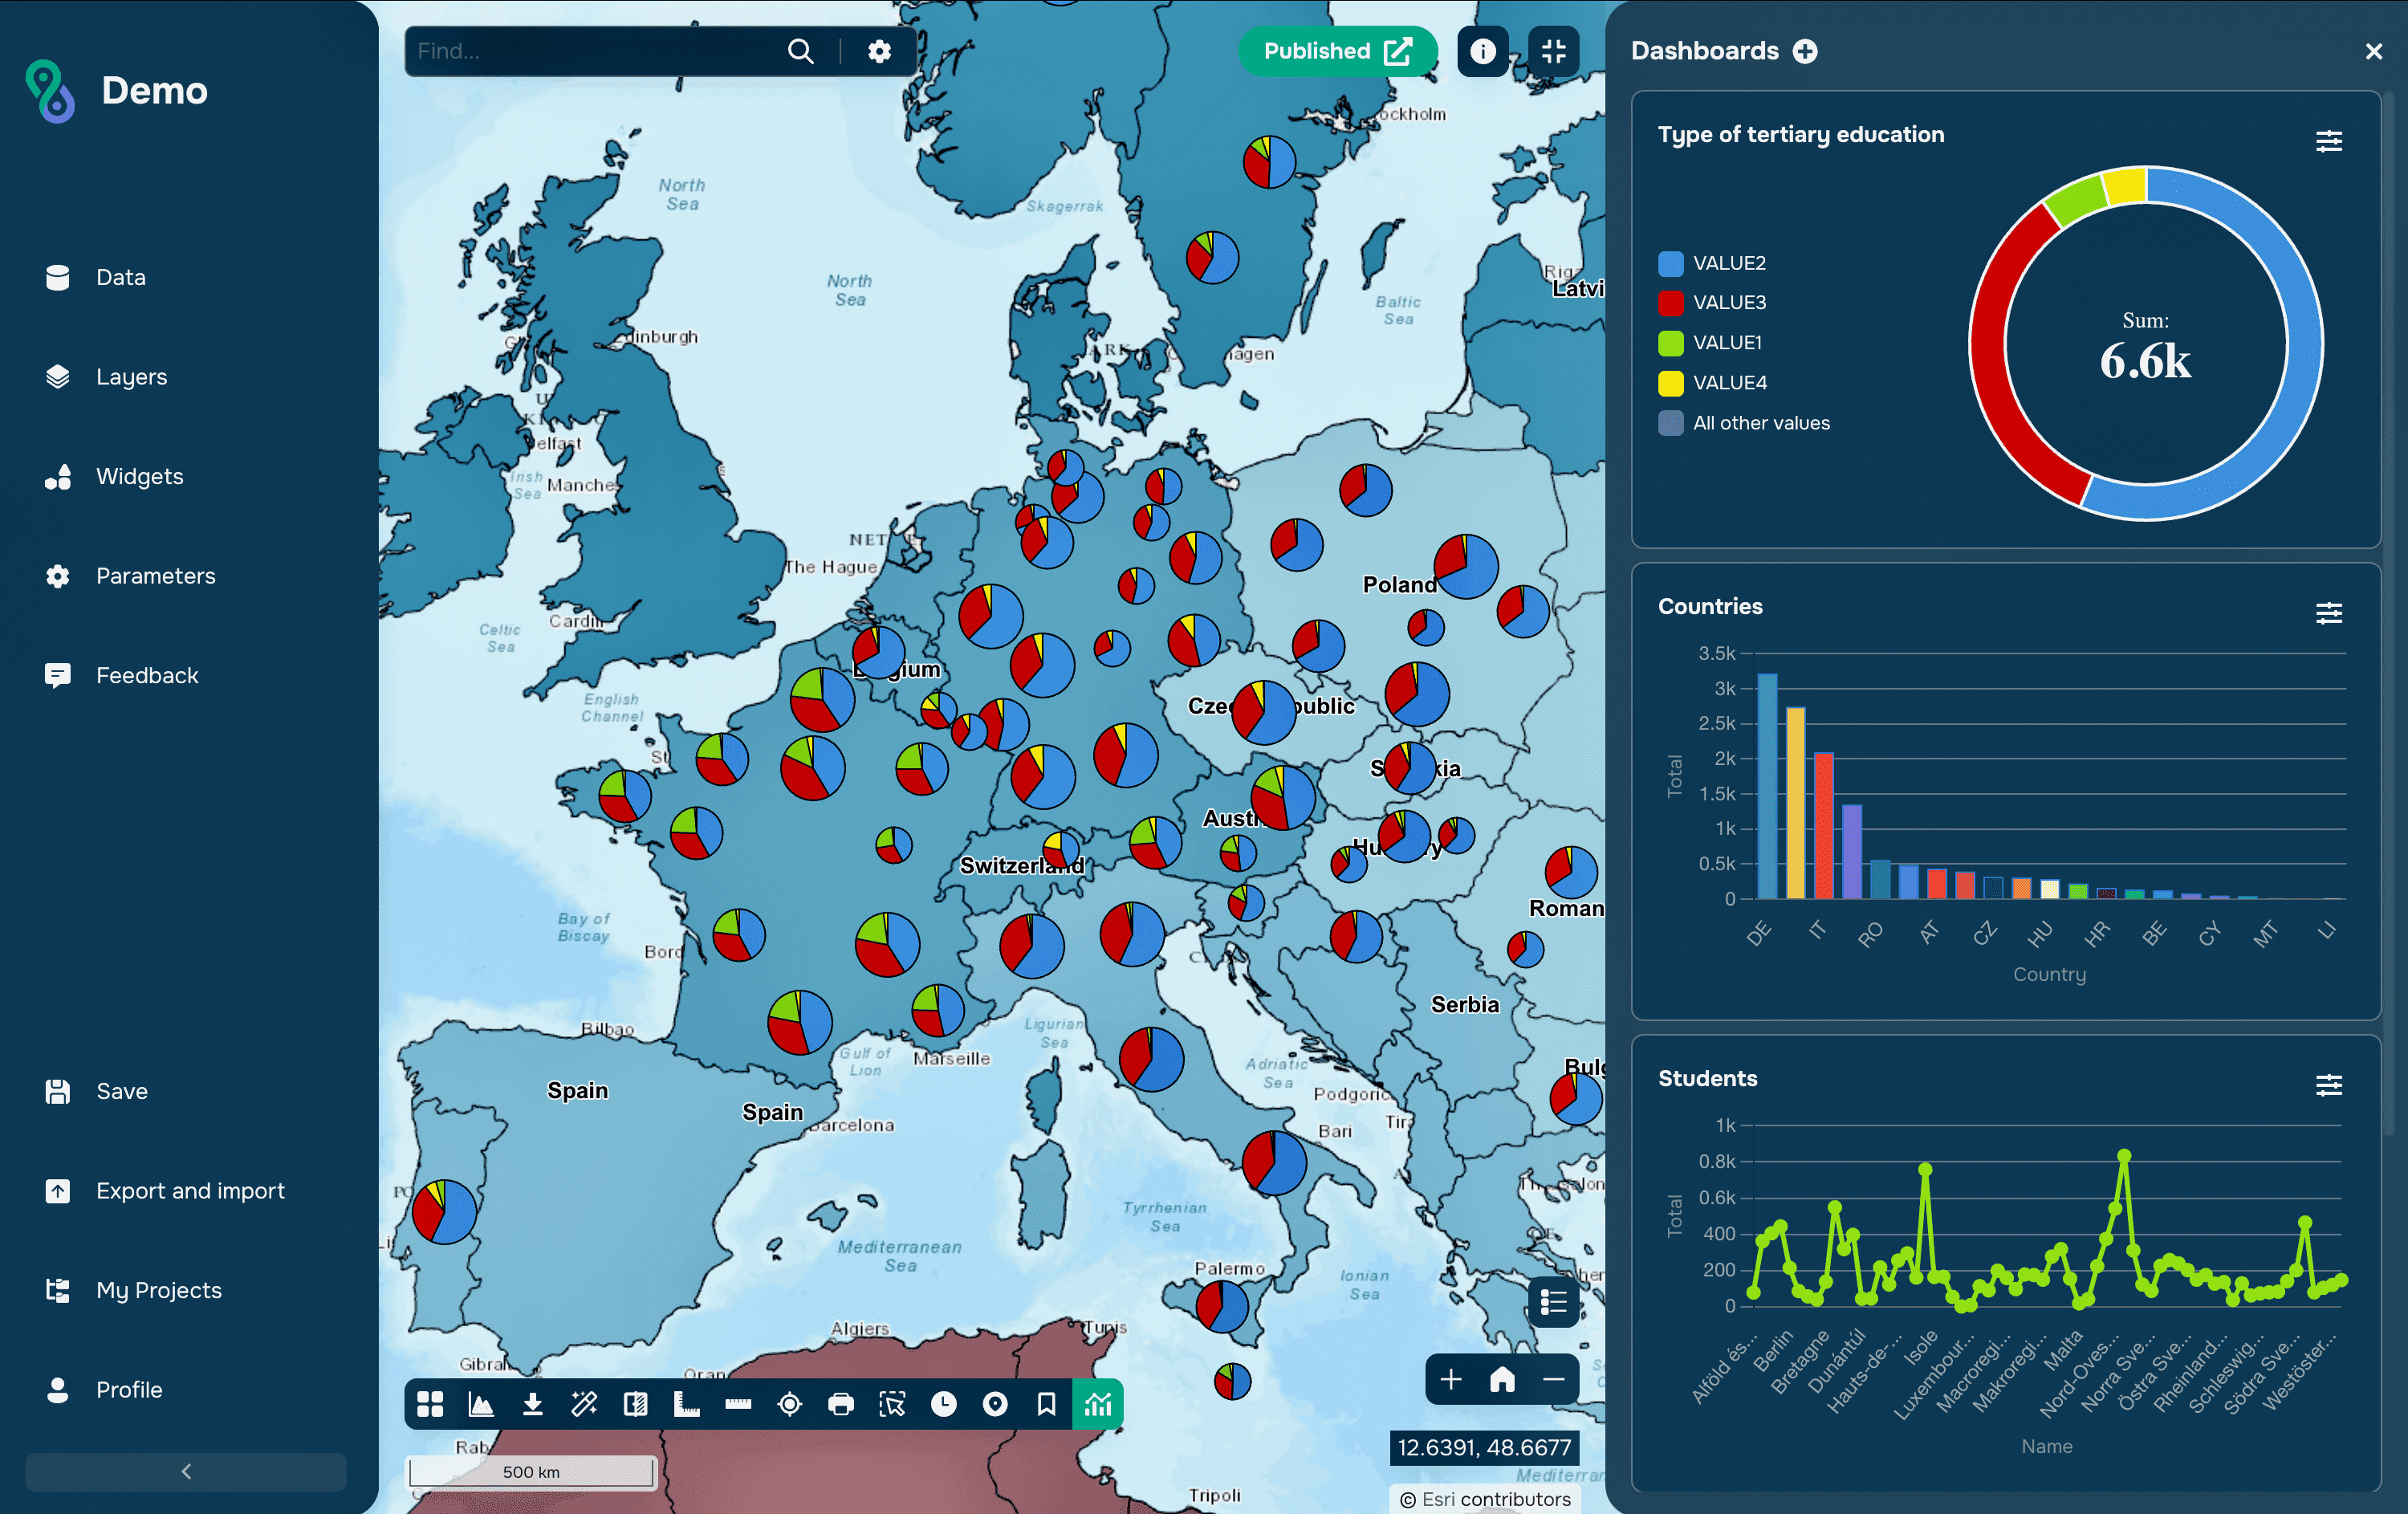
Vector and Raster Layers in GISCARTA
Formats and Cloud Workflows
For rasters, GeoTIFF remains the common ground, and its cloud-optimized variant became an OGC standard in July 2023. A COG is an ordinary GeoTIFF with internal tiling and overviews arranged so a client can request only the byte ranges it needs, which lets applications display and analyze imagery straight from object storage. Scientific and multidimensional data more often uses NetCDF or Zarr.
On the vector side the same shift happened with different formats: GeoPackage for local work, PostGIS for shared editing, vector tiles for display, and FlatGeobuf or GeoParquet for large datasets read over a network. The common principle in both cases is partial reading, so a client fetches the area it needs instead of the whole file.
Common Mistakes
The most expensive mistake is choosing a cell size by habit rather than by purpose. A 30 cm orthophoto used as a backdrop for a regional map costs storage, processing time and rendering speed while adding nothing that is visible at that scale.
A second is converting vectors to raster for convenience and then treating the result as authoritative. Once a parcel boundary has become a staircase of cells, the original line cannot be recovered, and area calculations shift by the amount of the rounding.
A third is analysing rasters on misaligned grids. When layers have different cell sizes, origins or coordinate systems, software resamples them silently, and the result depends on a resampling method nobody chose. Aligning grids explicitly, and using nearest neighbour for categorical data rather than bilinear interpolation, avoids both the silent errors and invented class codes.
FAQs
Which model is better?
Neither. Continuous phenomena such as elevation, temperature and imagery belong in rasters; discrete objects with attributes and boundaries belong in vectors. The mismatch shows up immediately when the wrong one is chosen.
Can vector data be used for terrain?
Yes. Contours and TIN surfaces are vector representations of terrain, and a TIN adapts its density to the relief. Raster elevation models are nevertheless more common because most terrain analysis tools expect a grid.
Does raster data have attributes?
Each cell has a value, and categorical rasters can also have an attribute table linking class codes to names and additional fields. Continuous rasters store only the number, with metadata describing units.
Why does a raster take so much more space than a vector layer of the same area?
Because it stores a value for every cell, including empty ones, while a vector layer stores only the objects that exist. This is also why compression, tiling and a suitable data type matter so much for rasters.
Should imagery be converted to vector for a web map?
Usually not. Imagery is served as raster tiles or as a COG, and vectorizing it produces a heavy and less accurate result. Vectorization makes sense only when the objects themselves, such as land-cover polygons, are the deliverable.
Key Takeaways
Raster and vector are two answers to the same question, and each is precise about a different thing. A raster is precise about what is everywhere, at the cost of a fixed cell size and files that grow quickly. A vector is precise about where an object is and what is known about it, at the cost of describing continuous surfaces only through approximations.
In practice a project holds both, and the skill is in the boundary between them: keeping imagery, elevation and climate as rasters, keeping objects and their attributes as vectors, and combining them through zonal statistics and sampling rather than converting one model into the other whenever a tool demands it.