For most of its history GIS answered questions about a state of the world that had already been recorded: a survey, a census, an image acquired last month. Real-time GIS answers questions about what is happening now. The shift is not only technical; it changes what a map is for, how data is stored, and what it means for a result to be correct.
What Is Real-Time GIS?
Real-time GIS is the continuous ingestion, processing and display of location data as events arrive, rather than in scheduled batches. A vehicle reports its position every few seconds, a water-level sensor sends a reading every minute, an aircraft transponder broadcasts continuously, and the map reflects the latest value without anyone opening a file.
The practical definition is about latency relative to the decision. Dispatching an ambulance needs positions that are seconds old; monitoring groundwater can be considered real time at hourly updates. Building for lower latency than the decision requires adds cost without adding value.
Batch GIS vs Real-Time GIS
Feature | Traditional GIS | Real-time GIS |
Update cycle | Scheduled: hours to years | Continuous: seconds to minutes |
Core question | What is there | What is happening now |
Data unit | Dataset or layer | Event or observation |
Architecture | Files and databases | Message brokers and stream processors |
Analysis | Run on demand | Runs continuously on each event |
Client update | Layer refresh or reload | Push over WebSocket or MQTT |
Storage | Complete datasets | Recent state, aggregates, archive |
Typical volume | Fewer, larger files | Many small messages |
Typical failure | Data is out of date | Gaps, latency, duplicate or late events |
Typical products | Maps and reports | Dashboards, alerts, geofences |
Value over time | Stable for years | Often decays within minutes |
Where Live Data Comes From
Fleet and asset tracking is the largest source: GNSS receivers in vehicles, machinery and field devices reporting position, speed and status. Public transport agencies publish the same kind of data through GTFS-Realtime, which carries vehicle positions, trip updates and service alerts in a format most journey planners already consume.
Sensor networks cover the environment and infrastructure: water level, air quality, soil moisture, traffic counts, structural monitoring, meters and SCADA points in utilities. Aviation and shipping add ADS-B and AIS, two of the few global live feeds that are openly accessible, and crowdsourced reports, connected-vehicle telemetry and rapid-revisit satellite tasking fill the rest.
How Data Reaches the Map
The transport layer is what distinguishes a real-time system from a fast refresh. MQTT dominates on the device side because it is lightweight enough for constrained hardware and follows a publish and subscribe model, so a client receives only the topics it asked for. Kafka handles the high-volume middle of the pipeline, keeping an ordered, replayable log of events so a consumer that falls behind can catch up rather than lose data.
Toward the browser, WebSockets and server-sent events push updates to the client, which avoids the polling pattern where a map requests the same layer every few seconds and receives mostly unchanged data. Polling still has a place for low-frequency feeds, where a request every minute is simpler than maintaining a persistent connection.
Processing the Stream
Analysis in a streaming system runs on each event rather than on a table. The common operations are filtering, which discards events that do not matter before they reach storage; geofencing, which tests whether a moving object entered, left or is dwelling inside an area; and windowed aggregation, which computes counts and averages over a moving interval such as the last five minutes.
Track-aware processing is what separates this from ordinary spatial analysis. Events belong to a track identified by a vehicle or sensor ID, and derived values such as speed, heading, distance since the last stop or an incident-free interval depend on the previous event in that track. This is why streaming platforms require a track identifier for most of their tools, and why events arriving out of order need explicit handling.
Storing What Streams
Real-time systems usually keep three layers of data with different lifetimes. The current state holds one record per tracked object and is what most maps display; a recent history window of hours or days supports playback and short-term analysis; and an archive keeps downsampled or aggregated data for long-term study.
Retention has to be designed before the feed is switched on. A thousand vehicles reporting every five seconds generate around seventeen million records a day, and storing every point at full resolution for years rarely answers a question that a summary would not. The usual approach is to thin the archive by time or distance, keeping full detail only for incidents and for periods under investigation.
Standards and Tools
On the open side, the OGC SensorThings API is the reference standard for sensor data: a REST data model with an MQTT extension for subscriptions, published in versions 1.0 and 1.1 with the STAplus extension added in 2023 and version 2.0 in development. FROST-Server is the most widely deployed open-source implementation, and a typical open stack pairs it or Kafka with PostGIS and a client built on MapLibre or deck.gl.
In the Esri ecosystem the landscape changed in 2026. ArcGIS Velocity, previously available only as an ArcGIS Online extension, was released for self-hosted ArcGIS Enterprise on Windows and Linux with ArcGIS Enterprise 12.1. ArcGIS GeoEvent Server was deprecated at the same time: its final release is planned with ArcGIS Enterprise 12.3 in 2027, and it will be removed at version 12.4, expected in November 2027. Organizations still running GeoEvent workflows have a defined but finite runway to migrate.
Visualizing Live Data
The first problem is that update frequency and useful frame rate are different things. Redrawing thousands of moving symbols as fast as messages arrive burns resources without helping anyone read the map, so clients typically buffer updates, redraw on a fixed interval and interpolate movement between reports.
The second is that a live map has to show its own reliability. A symbol for a vehicle that last reported ten minutes ago looks identical to one that reported a second ago unless staleness is encoded deliberately, through fading, an explicit age label or removal after a timeout. Operators trust a map that admits when it does not know.
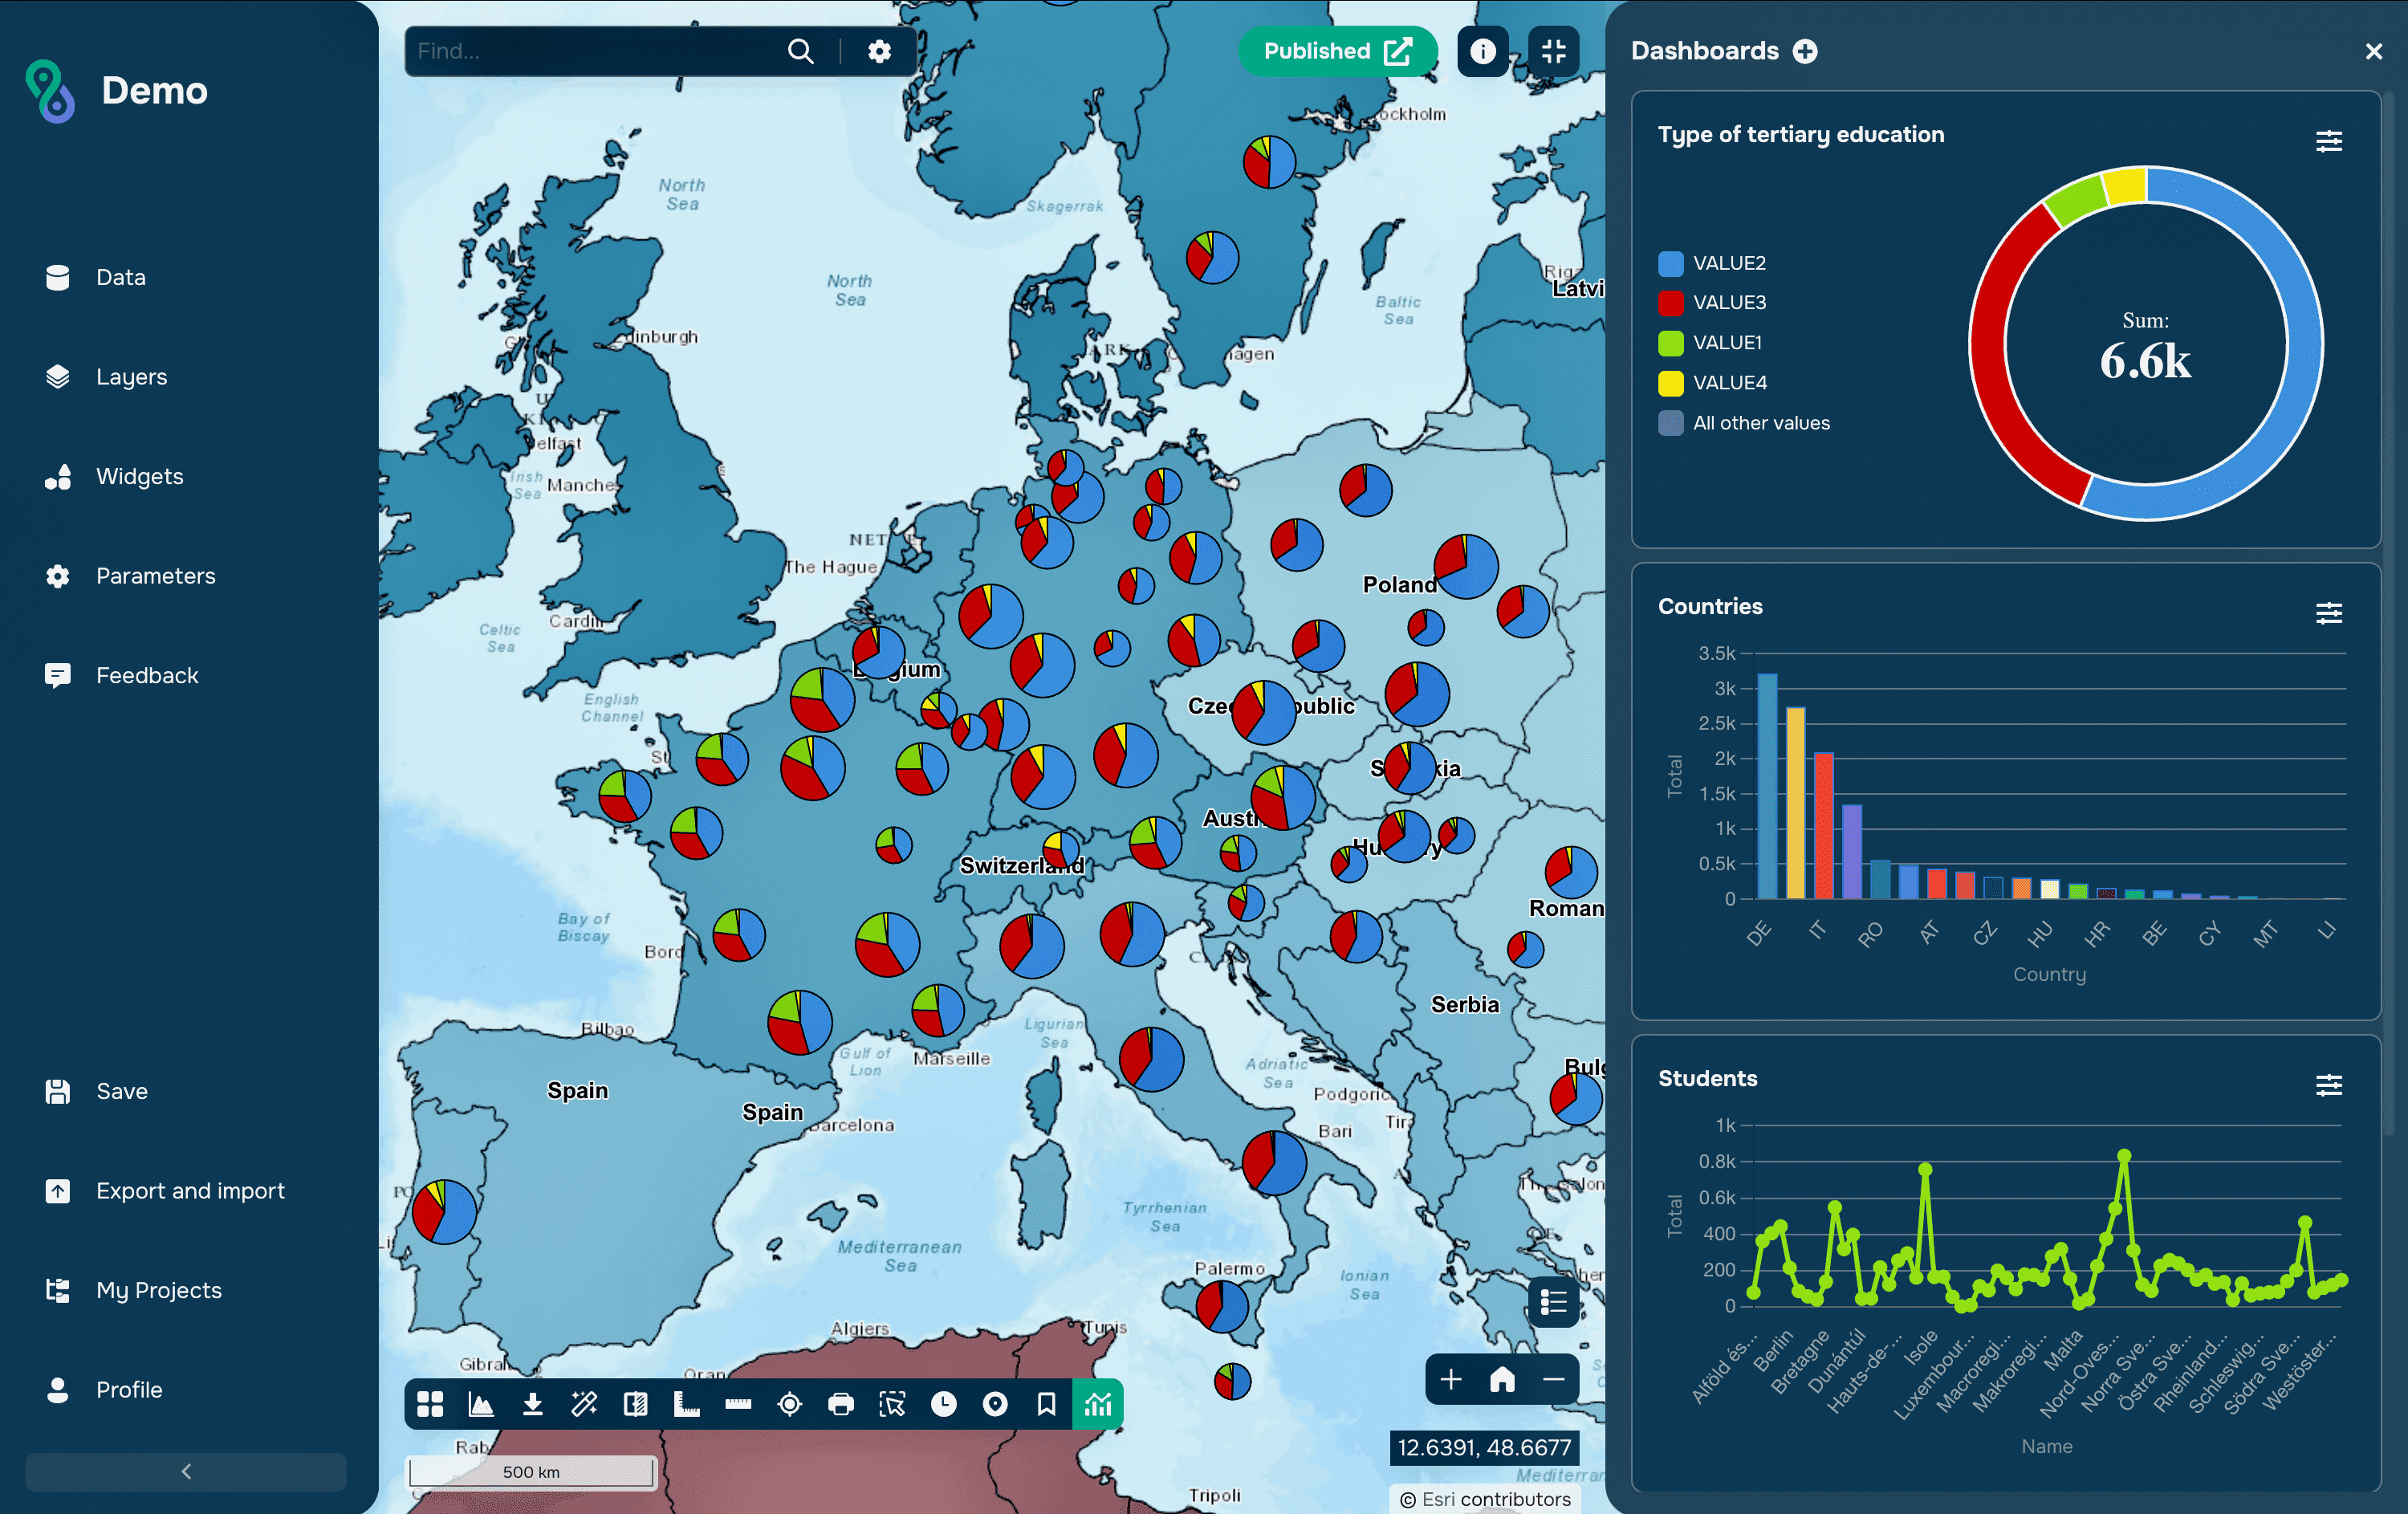
The third is density. At city scale, individual points become a solid mass, so clustering, heat surfaces or aggregation to segments and zones usually communicate more than raw positions, with individual objects revealed on zoom or on selection.
Common Mistakes
The most common mistake is streaming everything at the highest available rate because the hardware allows it. Ingest, storage and alert volume all scale with that decision, and reducing the reporting interval to what the decision actually needs is usually the single largest cost saving available.
The second is treating the last received position as the current position. Between reports, a vehicle has moved; during a network outage it may have moved a long way. Any analysis that is based on live tracks should carry the time of the observation alongside the position, and treat old data as an estimate.
The third is alert design. Geofences that fire on every boundary crossing produce noise that operators quickly learn to ignore, and a dwell time requirement, hysteresis around the boundary or a minimum interval between notifications turns an alarm stream into something a person can act on.
FAQs
Does real-time GIS require a special platform?
Not necessarily. Low-volume feeds can be handled with a database, a scheduled job and a web map. Dedicated streaming platforms become necessary when event rates, continuous analytics or guaranteed delivery exceed what a polling architecture can sustain.
How much latency is acceptable?
It depends on the decision the map supports. Emergency response works in seconds, fleet operations in tens of seconds, environmental monitoring in minutes or hours. The requirement should be stated explicitly, because it determines the whole architecture.
What happens to events that arrive out of order?
They have to be handled deliberately. Streaming platforms order events by an event-time field rather than arrival time and accept a defined lateness window, after which very late events are either discarded or routed to a separate correction process.
Can real-time data be used for official reporting?
Usually only after validation. Live feeds contain gaps, duplicates and sensor errors, so figures for reporting are normally produced from a cleaned archive, while the live view serves operations.
Is a dashboard the same as real-time GIS?
No. A dashboard is one way of displaying results and may refresh from a static source. Real-time GIS refers to the pipeline behind it, where events are ingested and analyzed continuously as they arrive.
Key Takeaways
Live data changes the map from a record into an instrument. Instead of describing a state that was surveyed, it shows a situation that is still developing, which makes latency, gaps and staleness part of the data quality question rather than technical details. A real-time map is only as trustworthy as its ability to show what it does not currently know.
What makes such systems work is restraint in design: reporting intervals matched to decisions, retention planned before the first event arrives, alerts that fire rarely enough to be read, and visualization that aggregates rather than drawing everything. The technology is now accessible from both open-source and commercial directions, and the harder part is deciding which questions genuinely need an answer measured in seconds.