
Emergencies are always spatial events. Fires, floods, earthquakes, or man-made disasters occur in specific locations, spread across a territory, and affect specific population groups. In such situations, it's important to understand not only what happened, but also where it's happening, how the situation is developing, and which areas are at risk. This is where geographic information systems become a tool for analysis and decision-making.
GIS are used at all stages of emergency management: from risk assessment to response and recovery. They help identify potential hazard zones, assess damage, plan evacuations, and optimally allocate resources.
GIS allows you to combine various data sources and present them in a single spatial system. This transforms disparate information into a clear picture that informs decision-making.
Data and International Monitoring Portals
The effectiveness of emergency management directly depends on the availability and timeliness of data. In recent years, international platforms that provide pre-processed information and maps have become key.
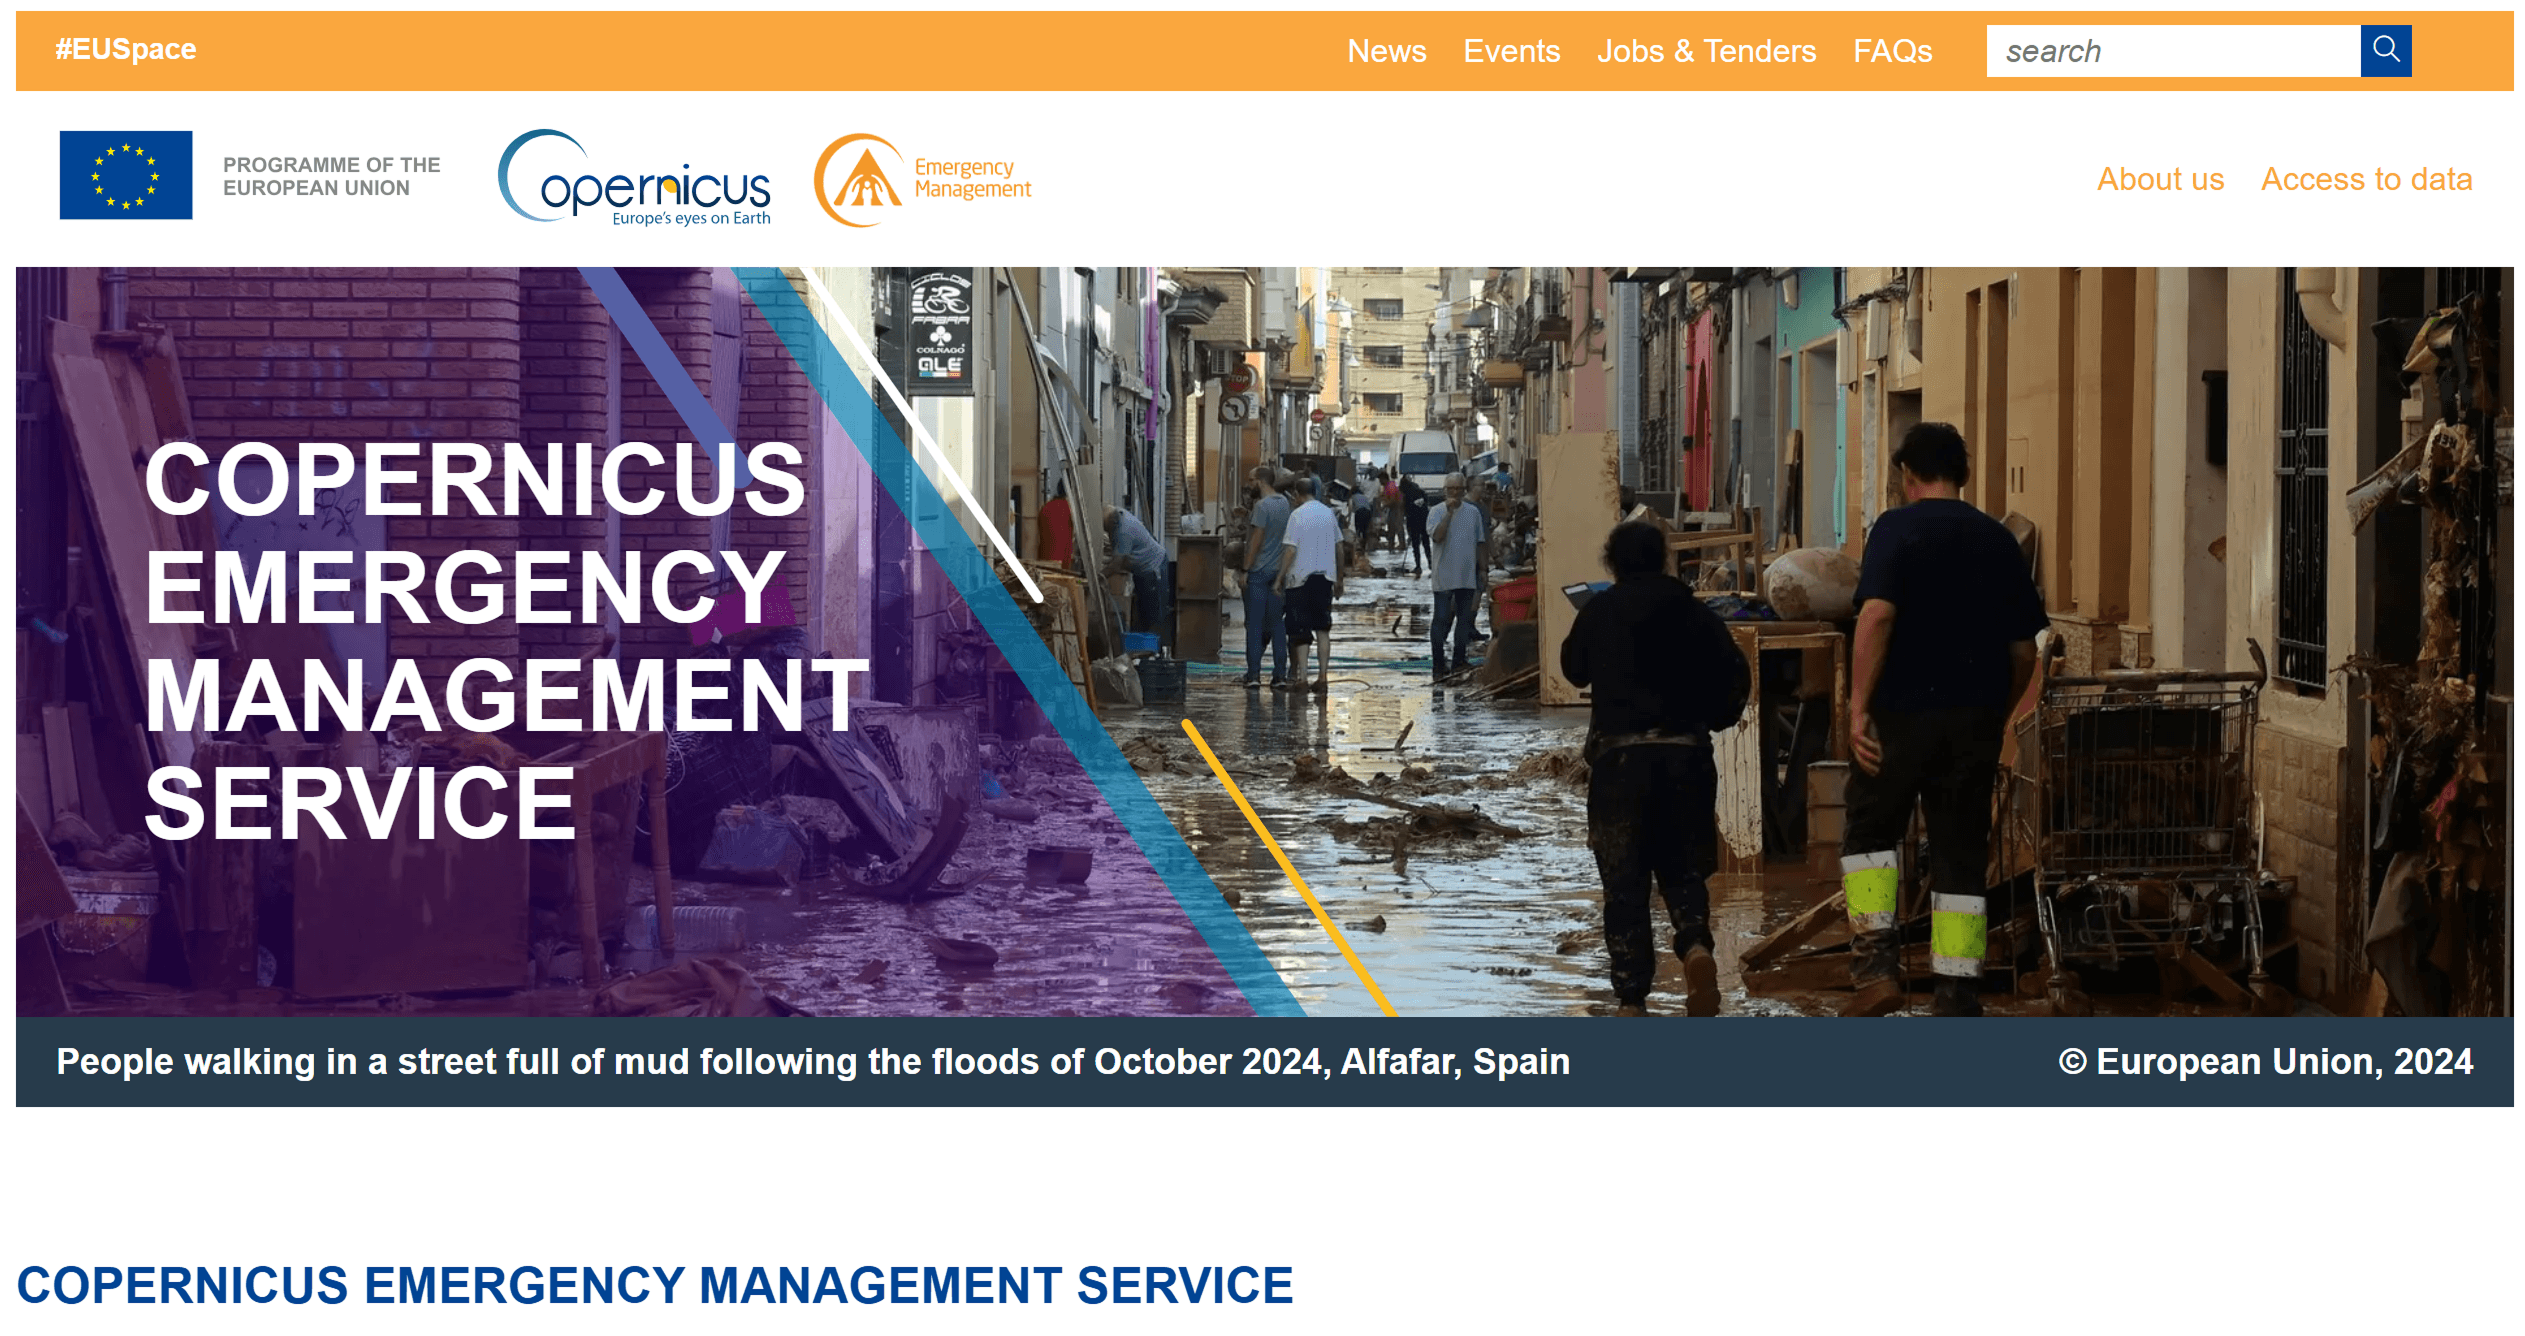
Copernicus Emergency Management Service: Provides maps and analytical products for floods, fires, and humanitarian crises. Used by states and international organizations.
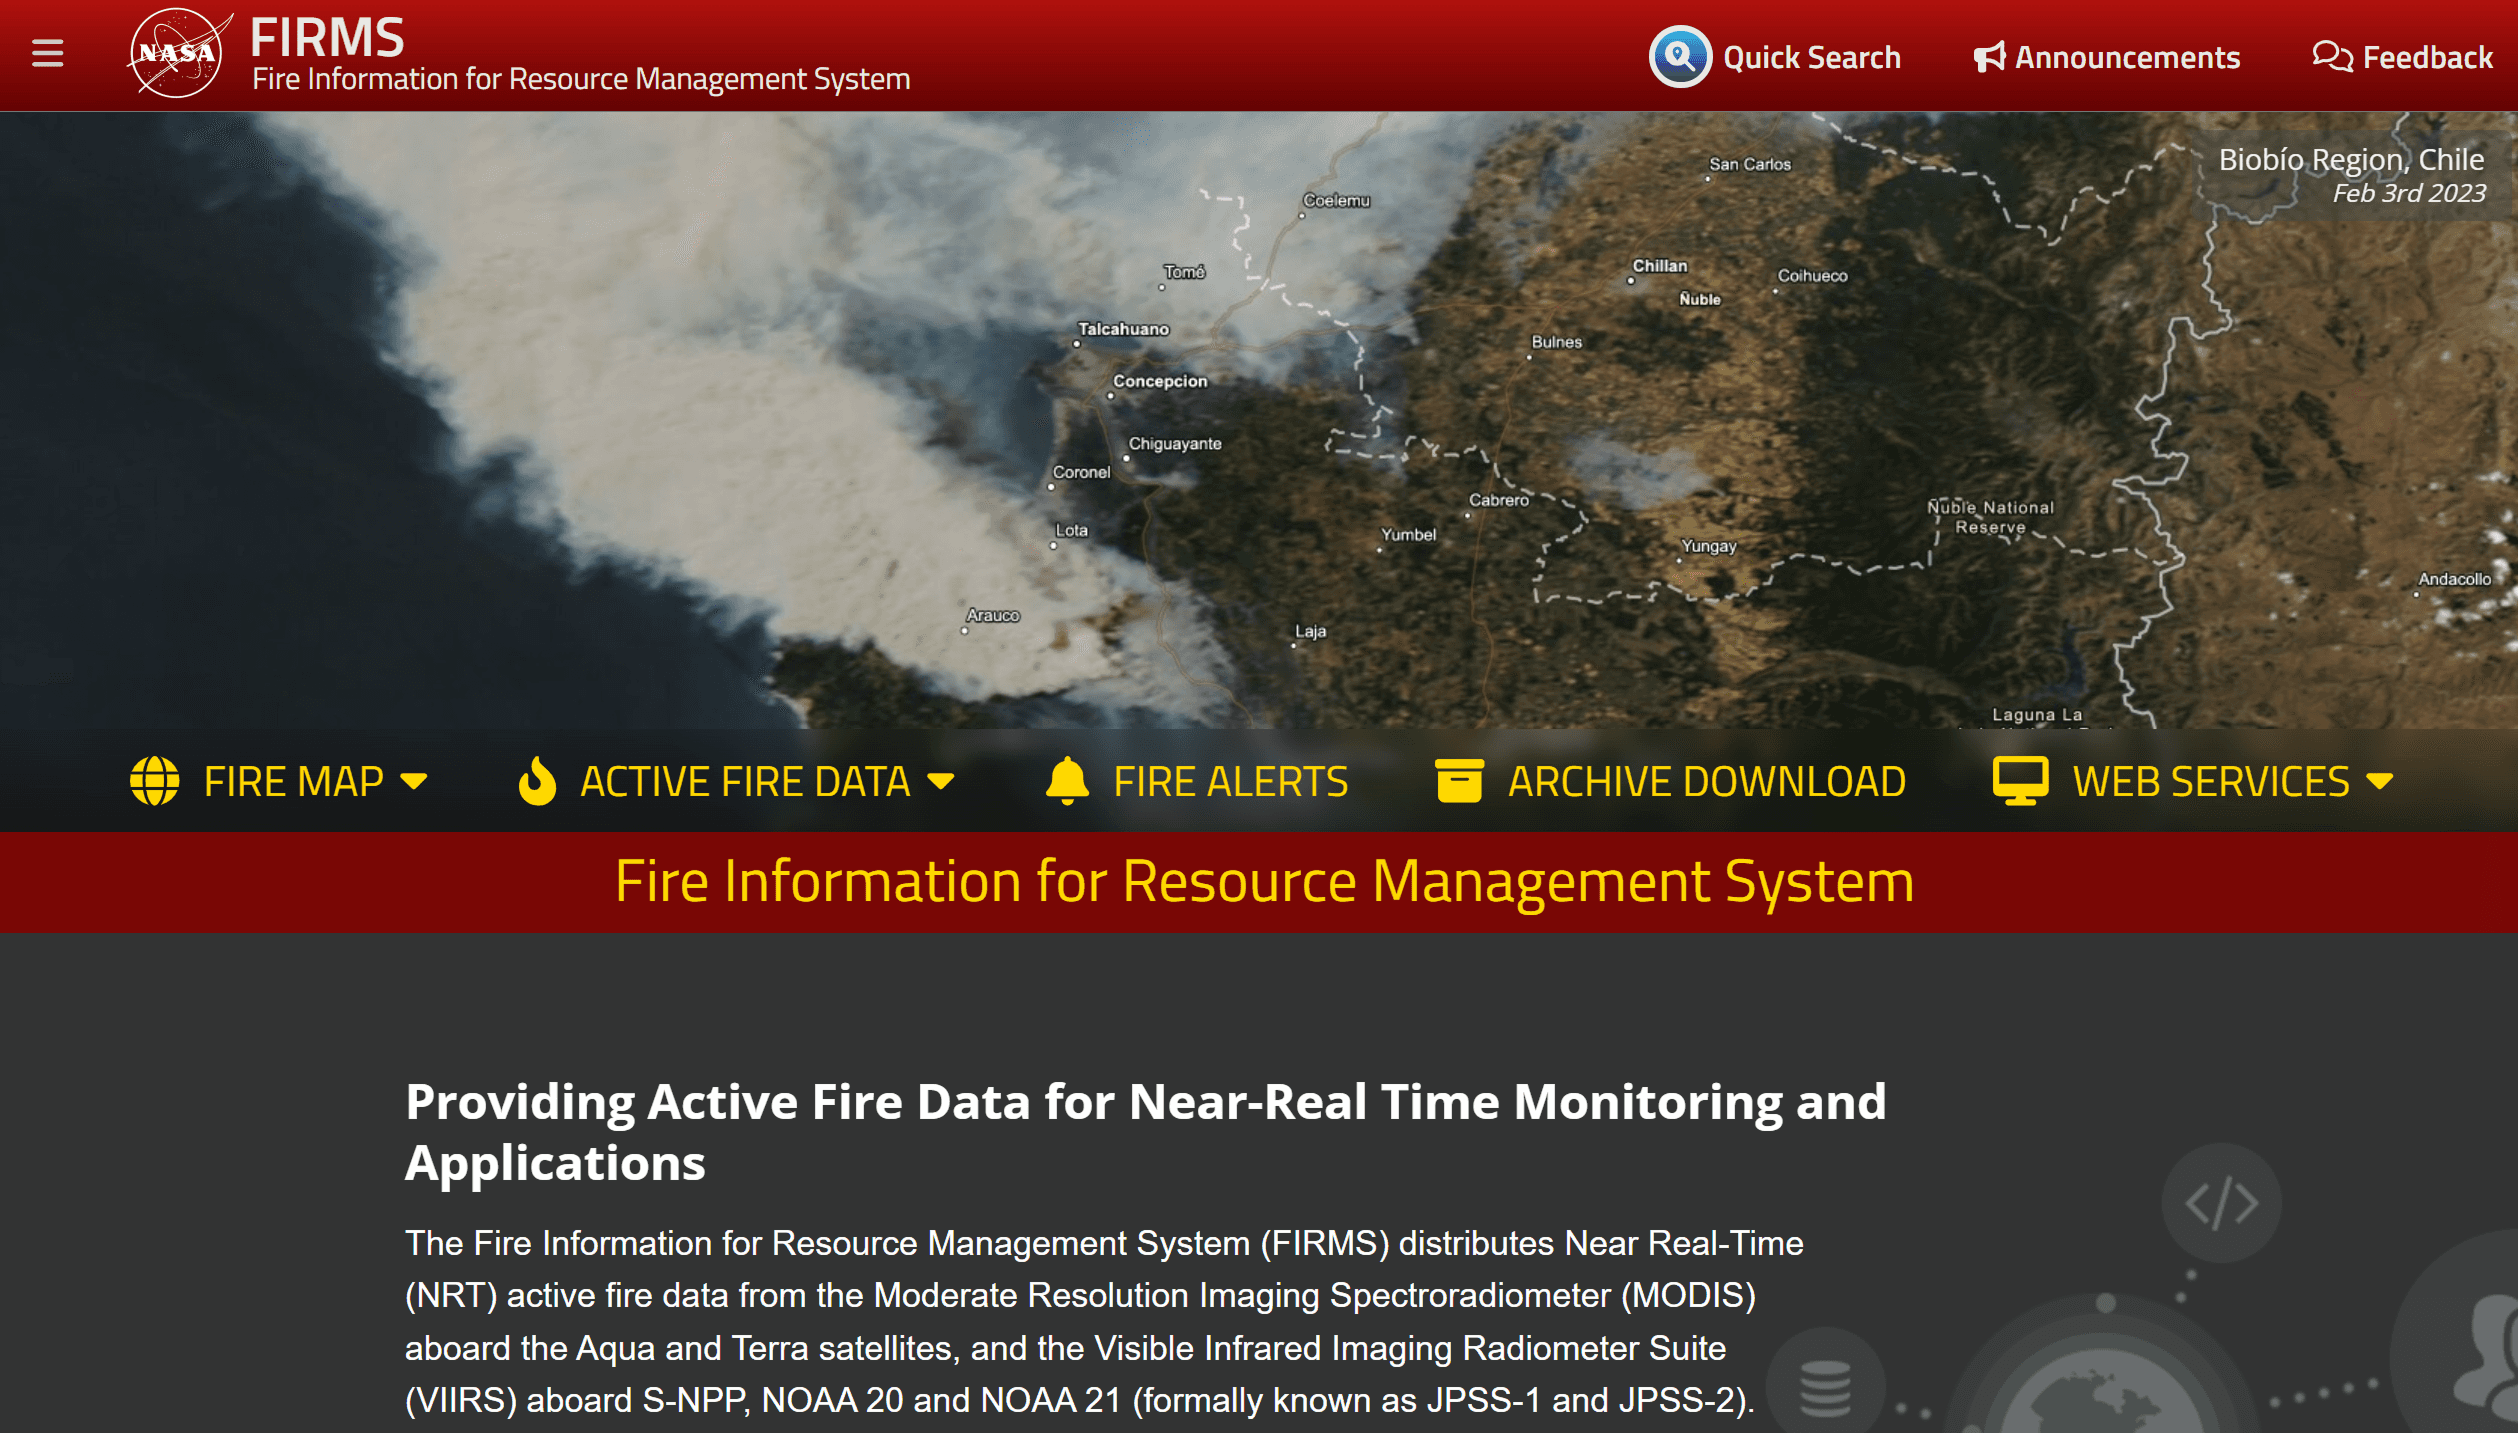
NASA FIRMS: A real-time fire monitoring system that tracks active fires worldwide.
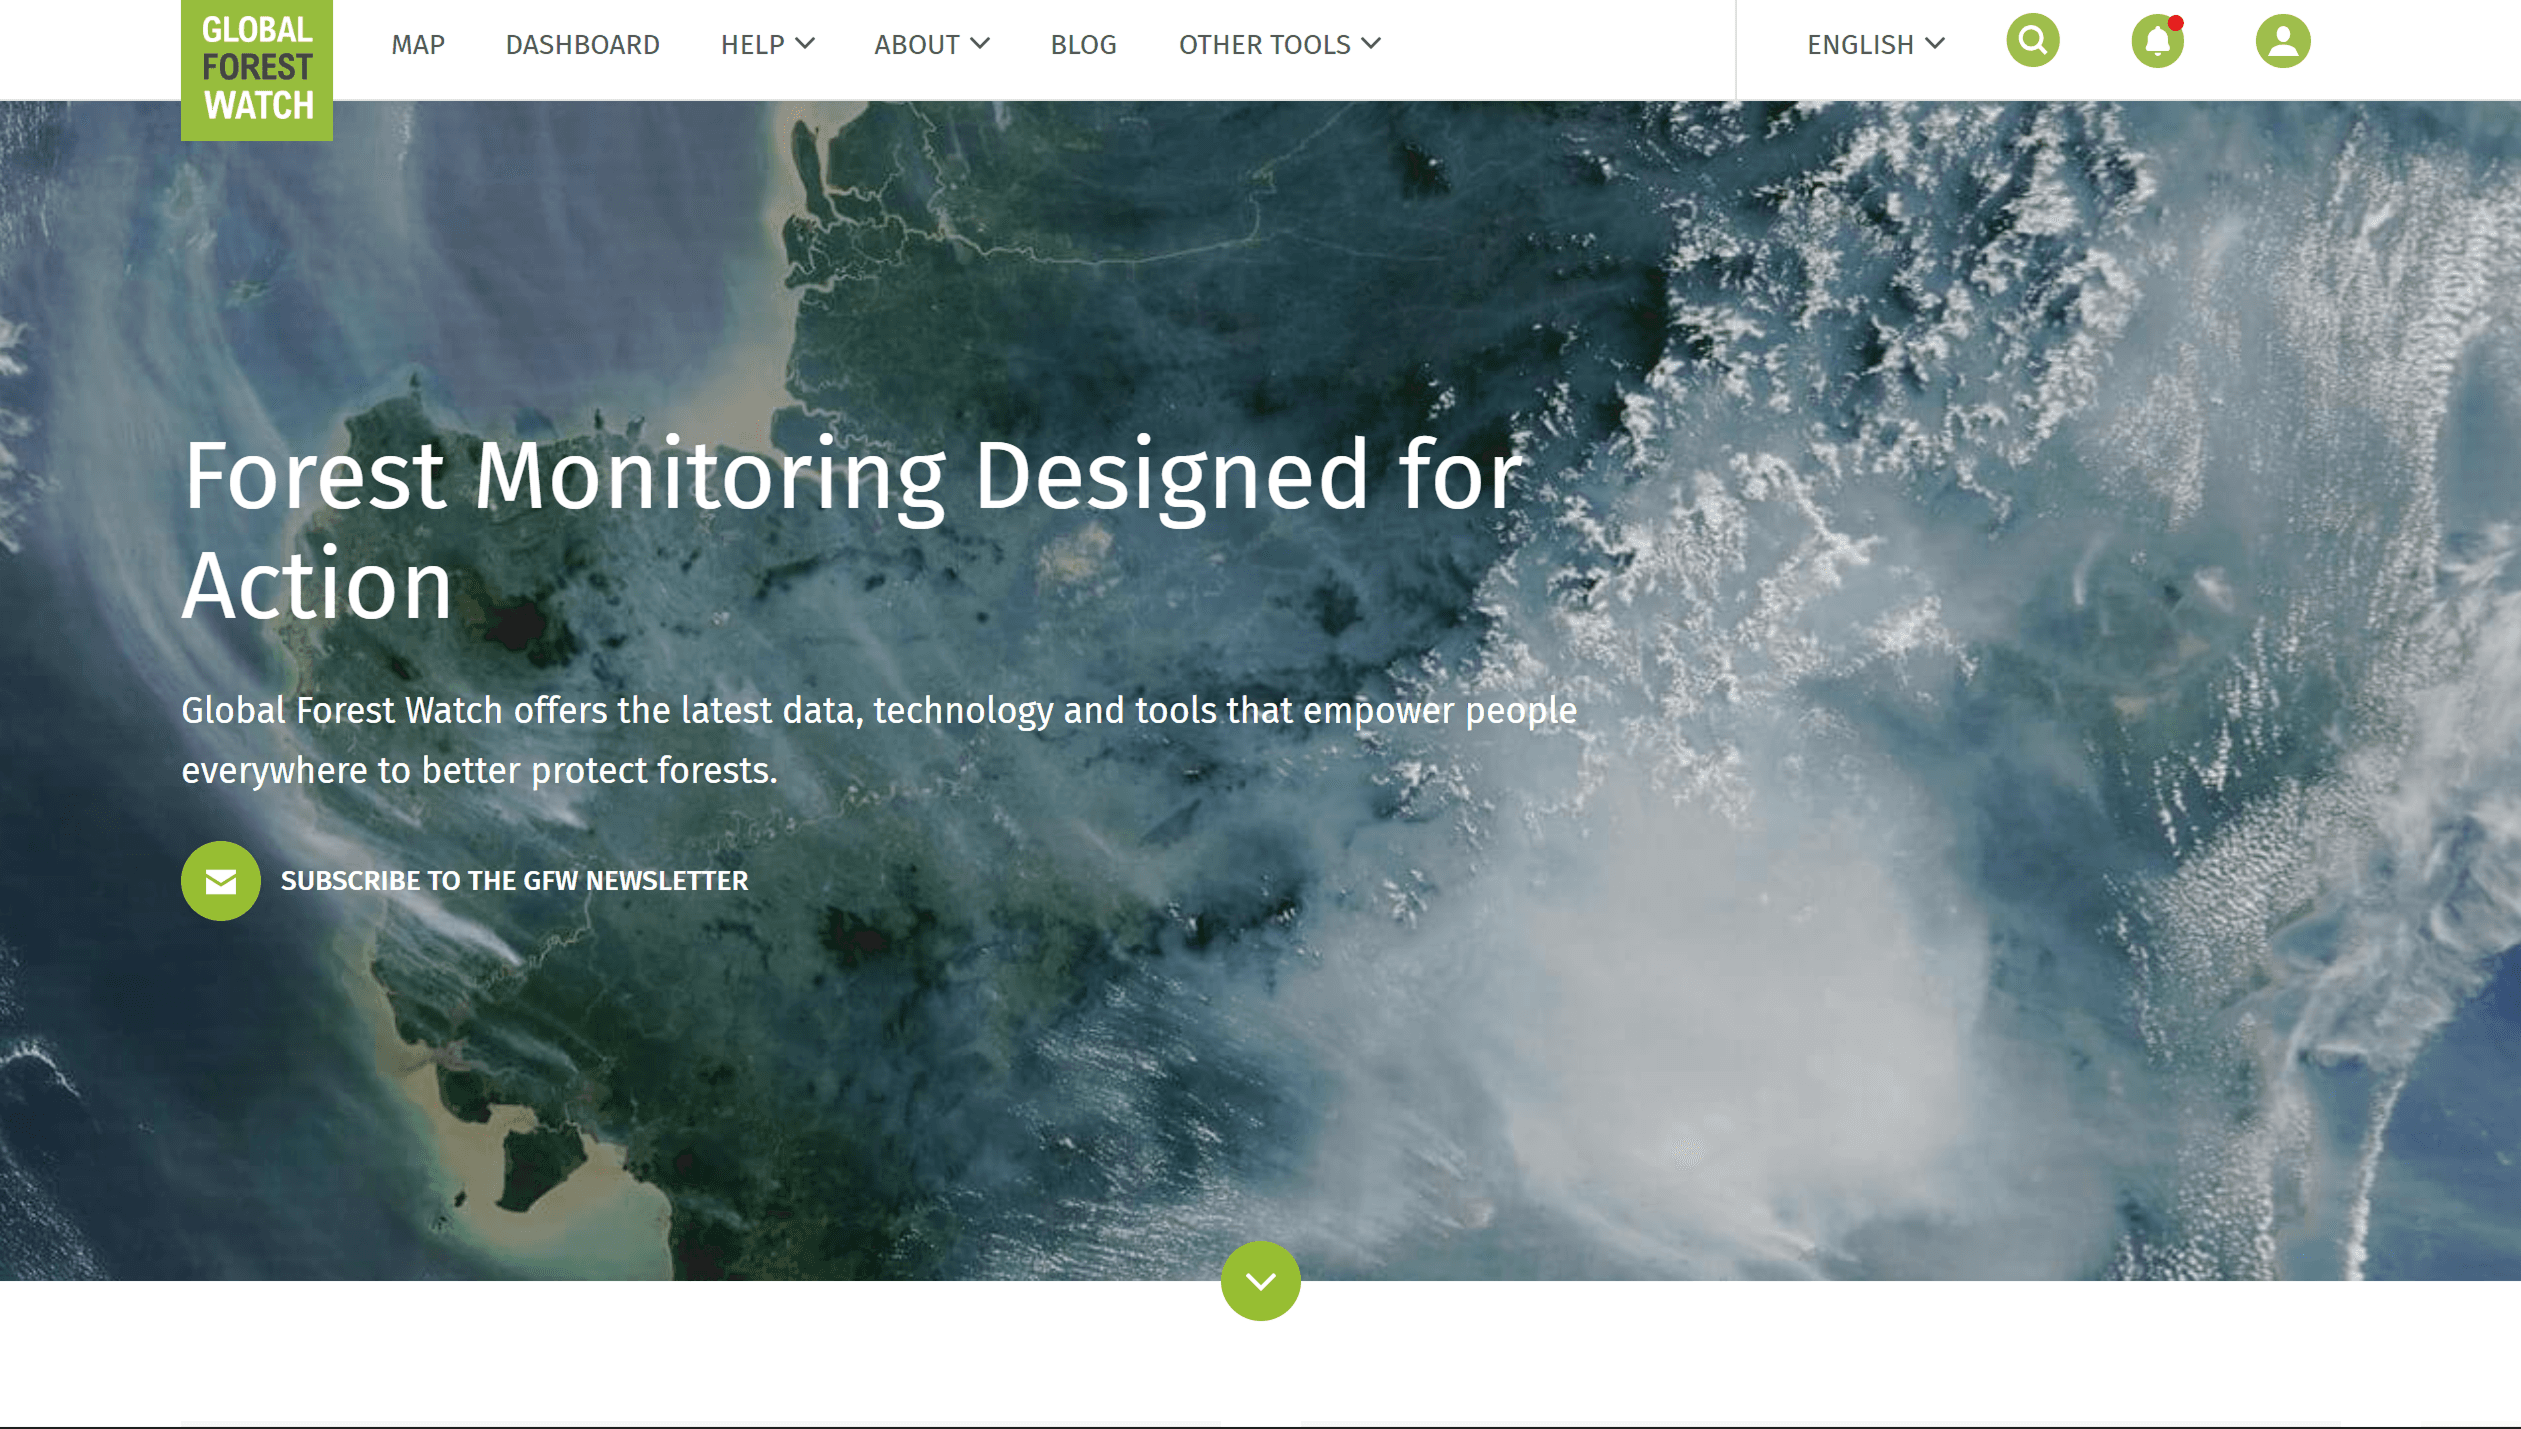
Global Forest Watch: Used for deforestation analysis, but also helps track fires and land-use change.
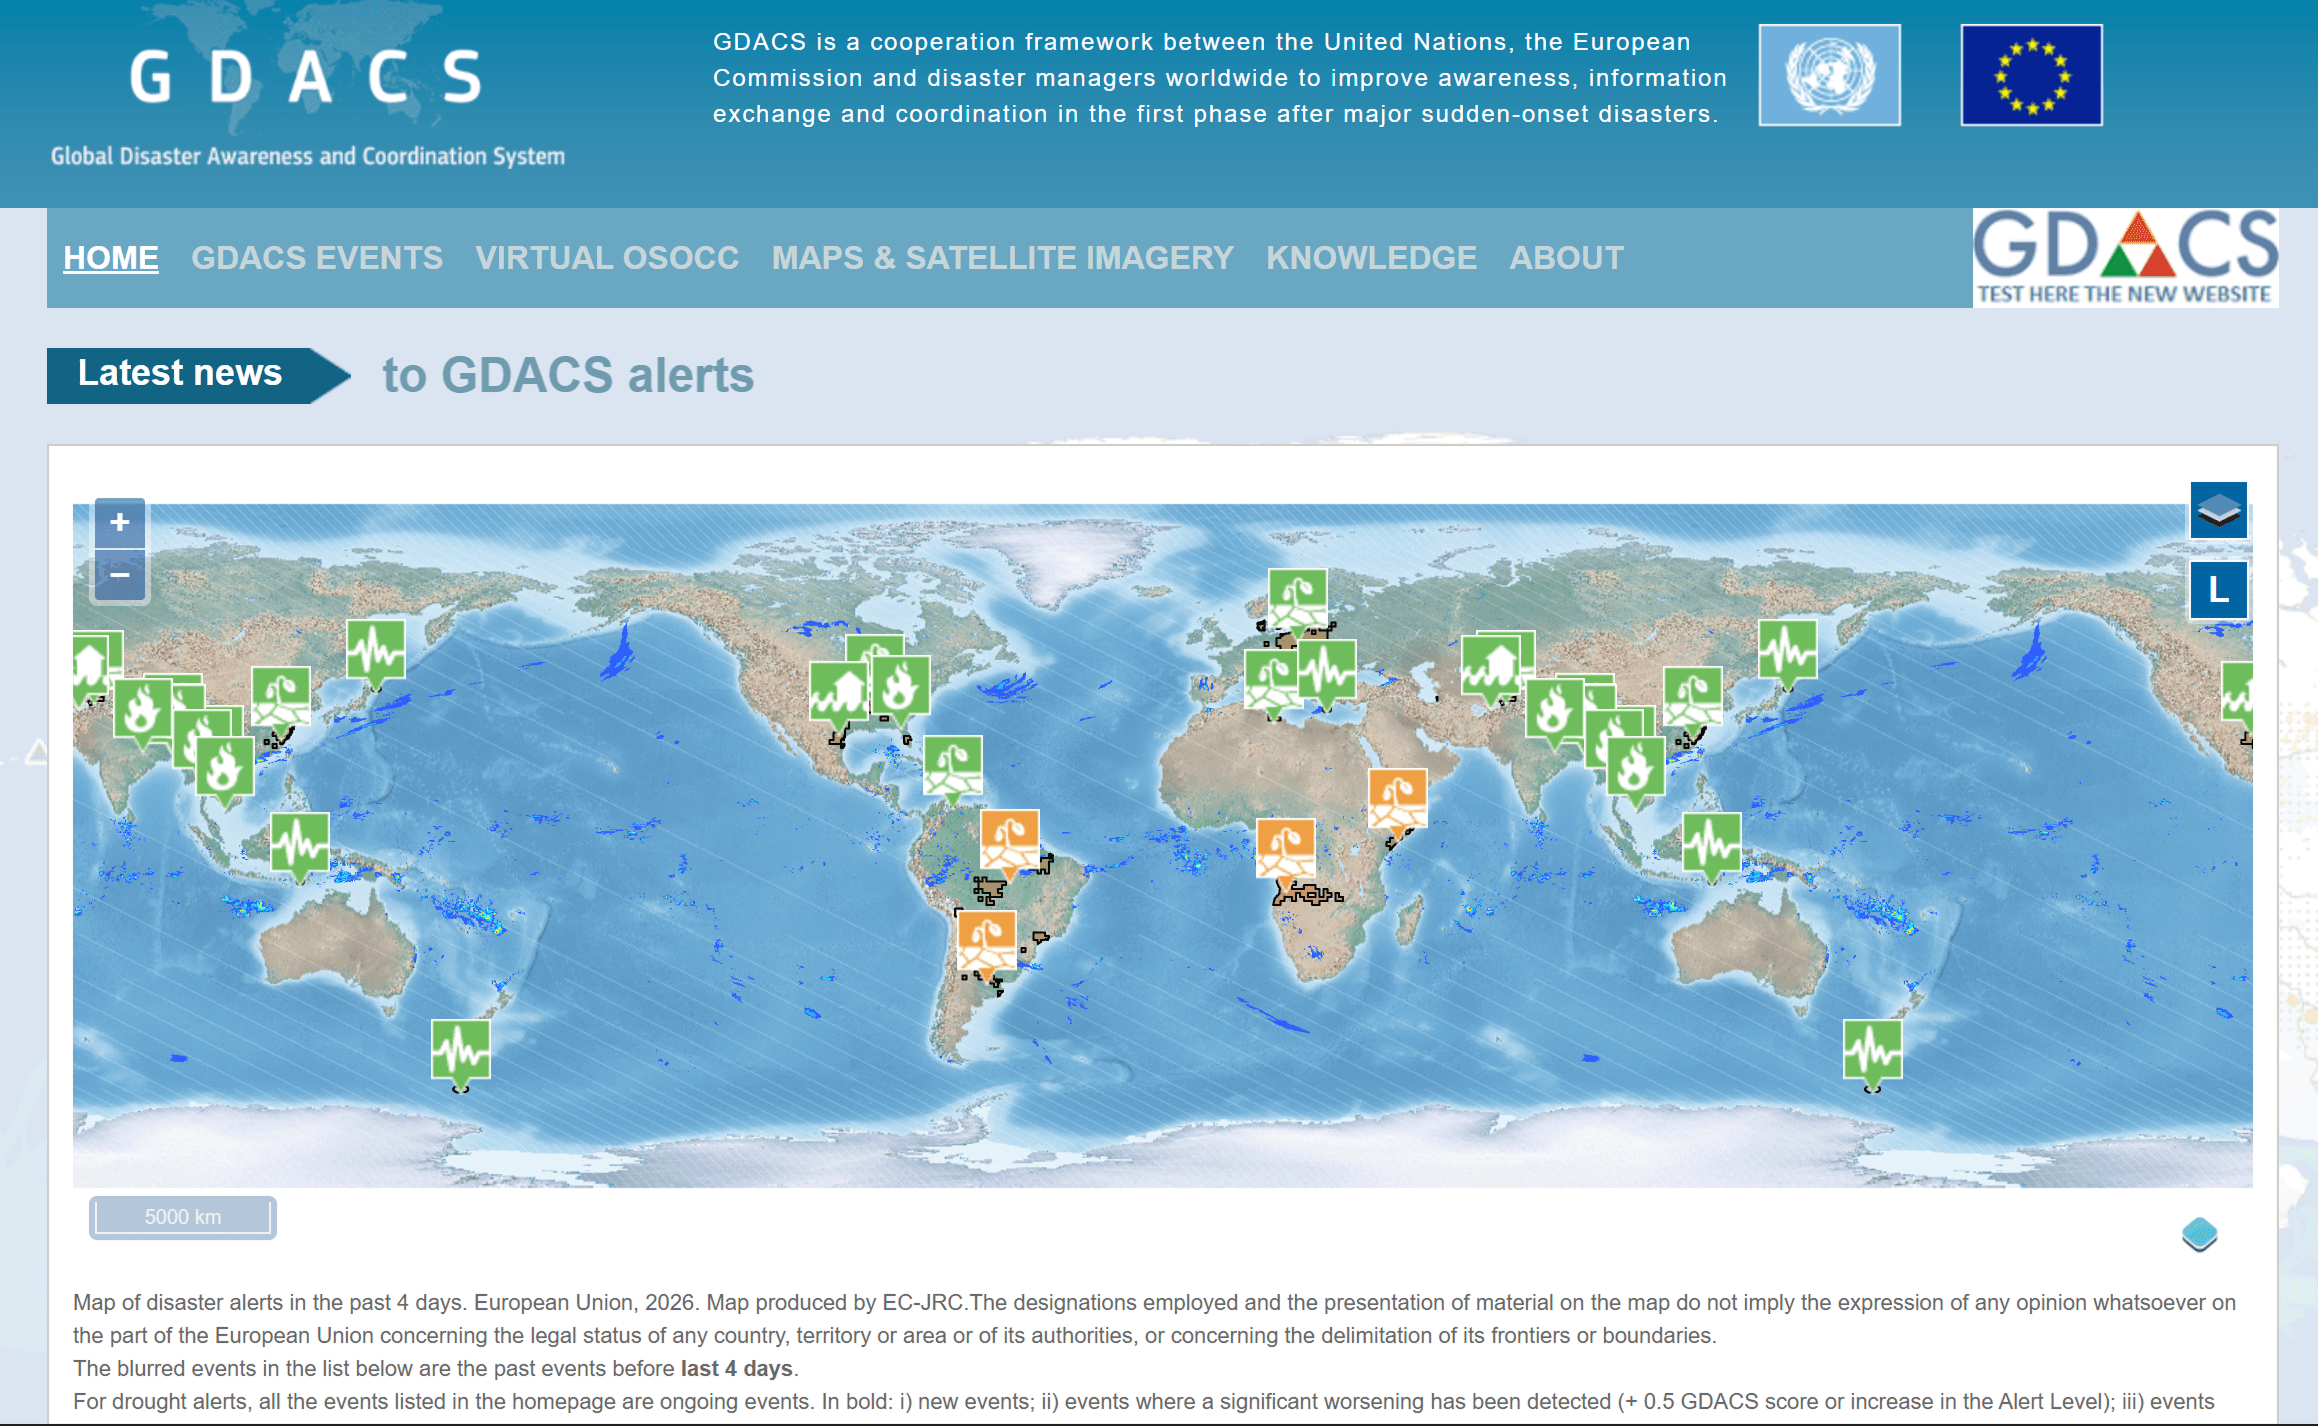
GDACS: An early warning system for disasters, including earthquakes, floods, and cyclones.
ReliefWeb: A UN platform that aggregates data, reports, and maps on humanitarian crises.

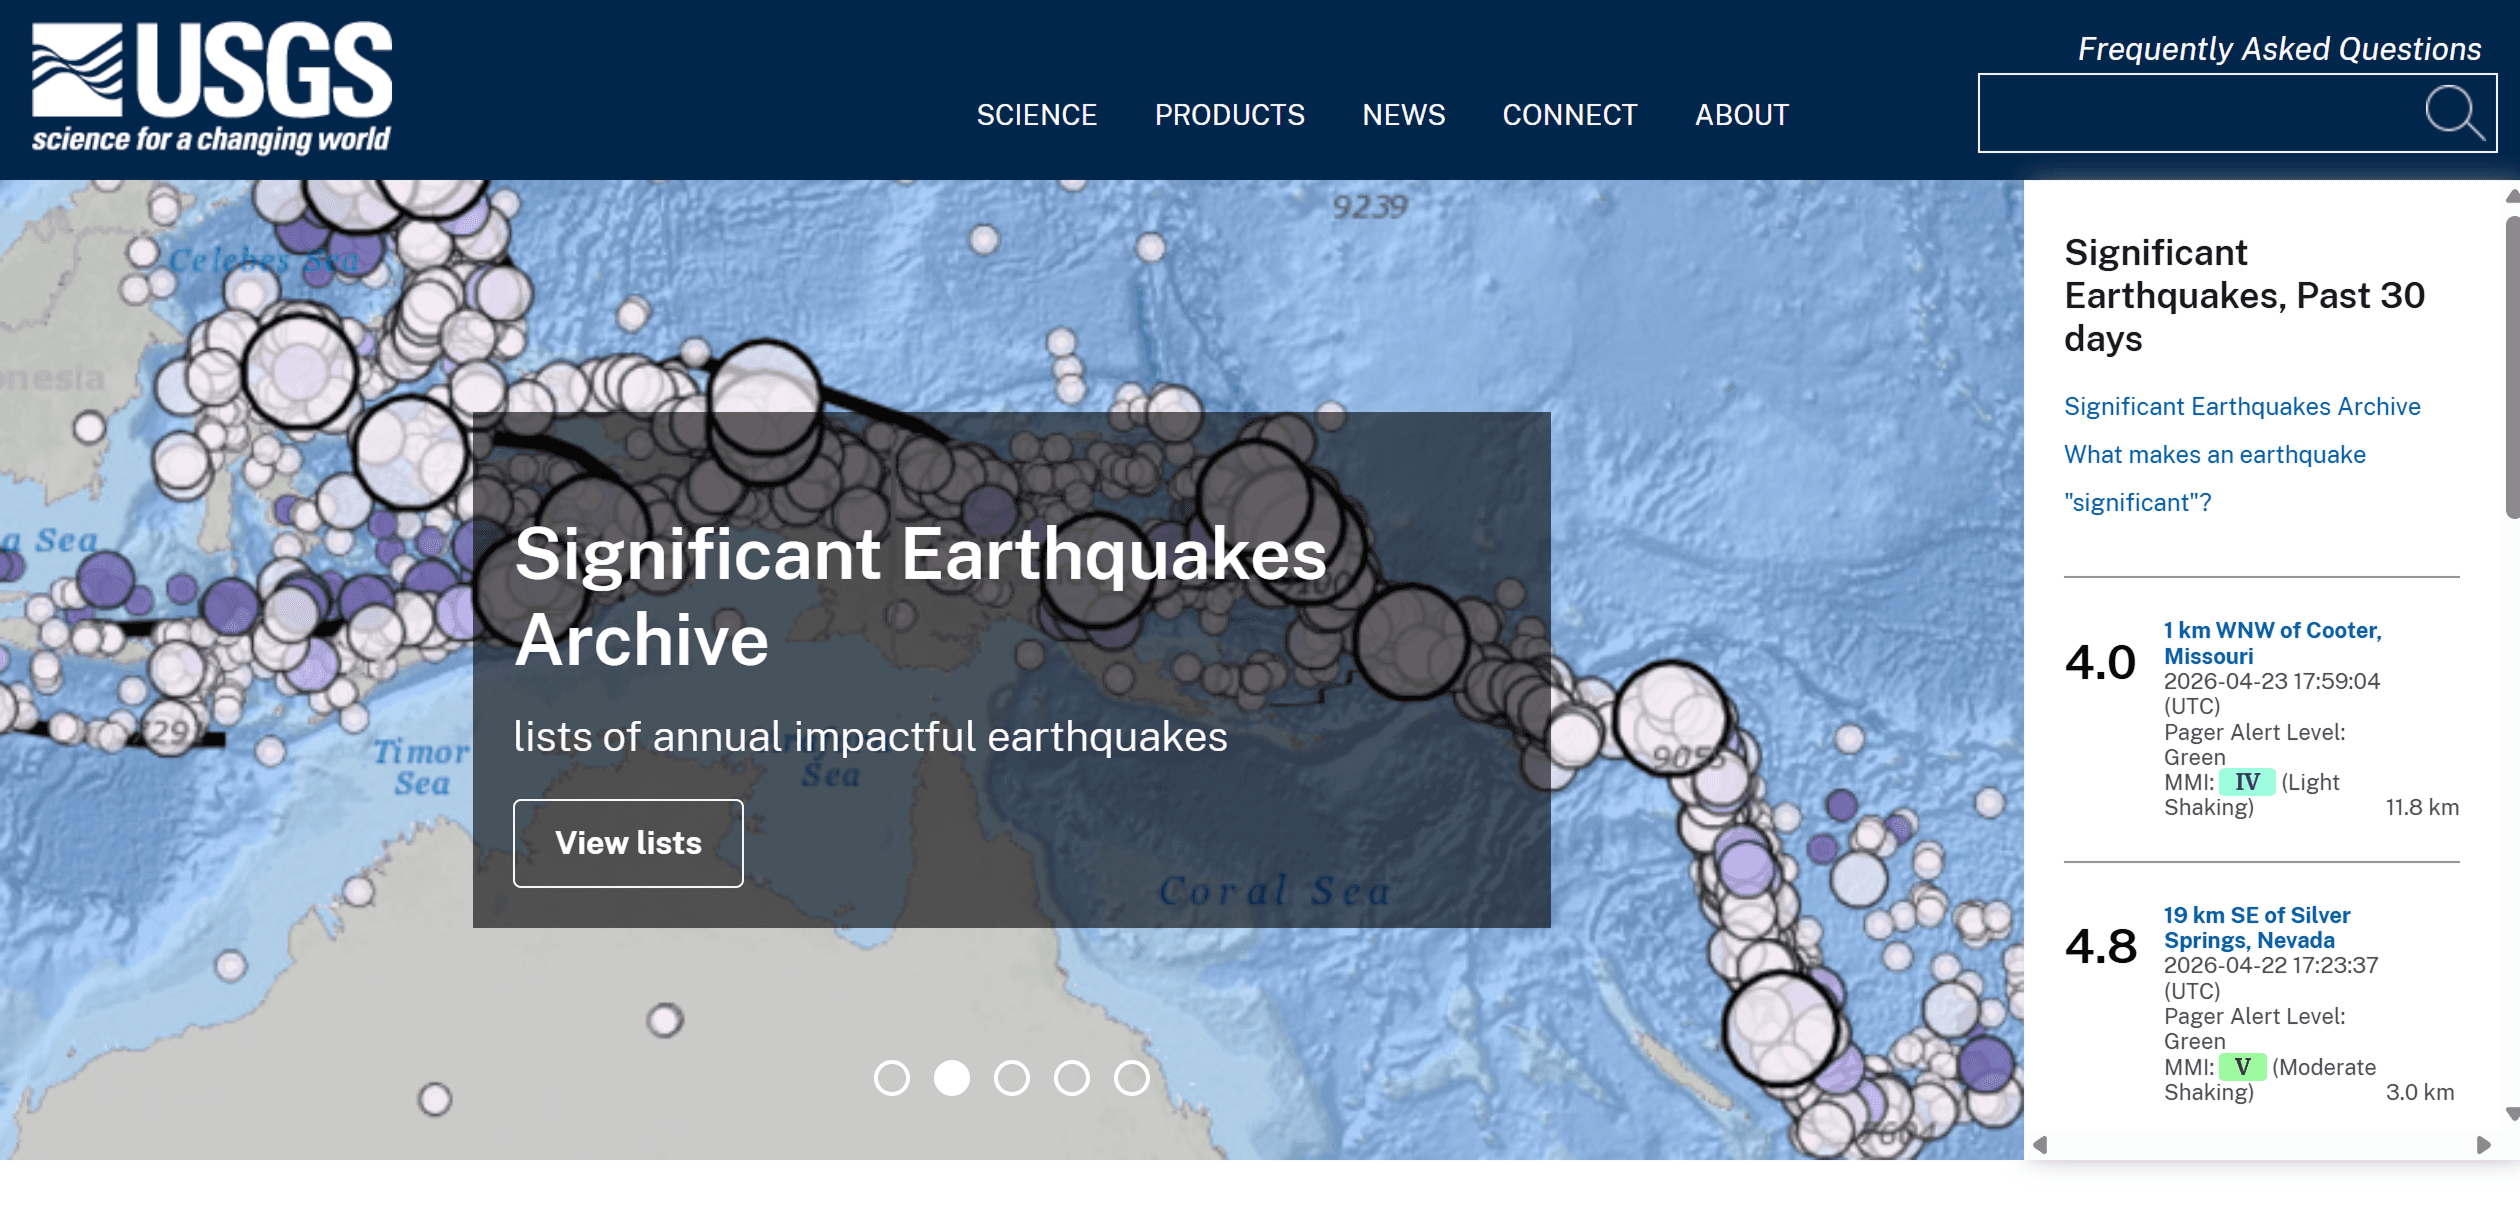
USGS Earthquake Hazards Program: Up-to-date information on earthquakes and their consequences.
In addition to portals, the following primary data sources are used:
Copernicus and NASA EarthData — satellite observations
USGS Water Data – water levels
OpenStreetMap – roads and buildings
ERA5 – climate parameters
This data allows for the most accurate analysis of the situation.
Main Application Scenarios
GIS is used at various stages of emergency management.
Risk Prevention and Assessment
At this stage, potentially hazardous areas are analyzed. For example, flood modeling based on terrain and precipitation allows for the identification of flood-prone areas.
Real-Time Monitoring
These systems allow for the tracking of developing events. For example, Copernicus or NASA FIRMS data are used to monitor fires and floods in near real time.
Response
GIS helps plan evacuation routes, analyze infrastructure availability, and coordinate services. For example, it can determine which hospitals are accessible in risk areas.
Recovery
Post-disaster, GIS is used to assess damage and plan recovery.
Analysis Methods
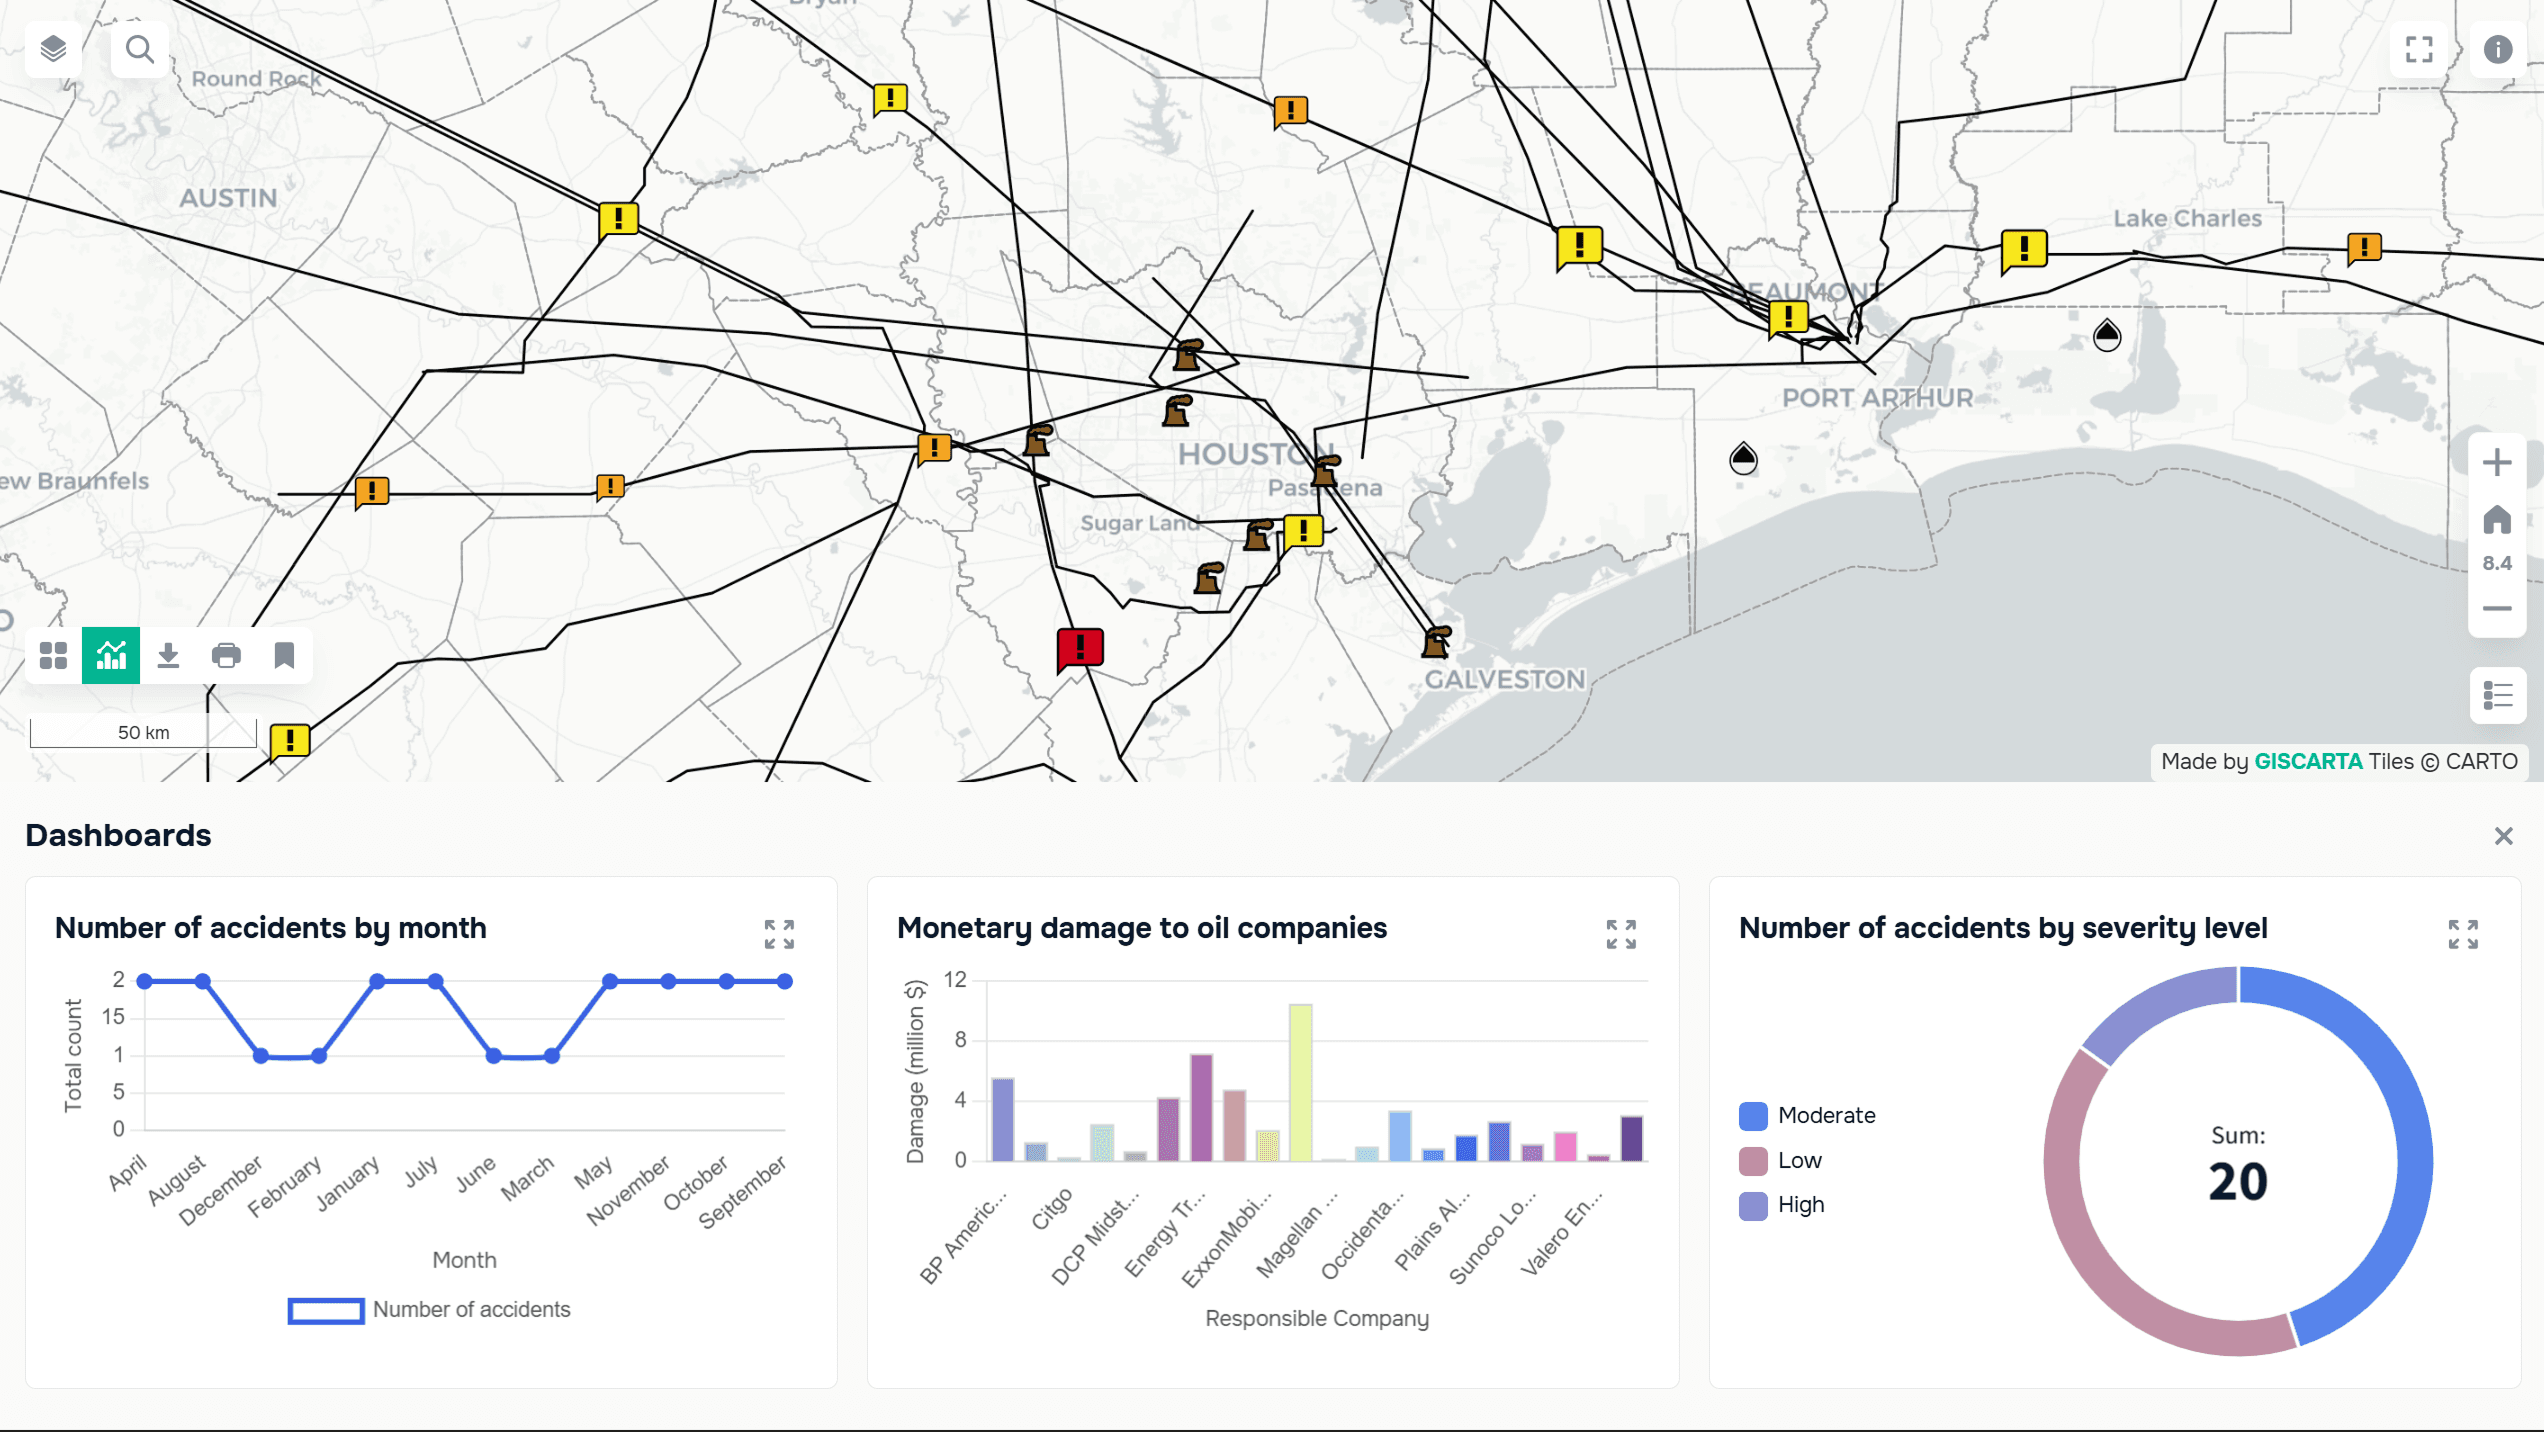
Various spatial analysis methods are used in emergency management. Overlays allow data to be combined, buffer analysis identifies zones of influence, and network analysis builds routes and assesses accessibility. Raster modeling is used to predict processes such as water or fire spread, and change analysis helps identify the impact of disasters.
Use Cases
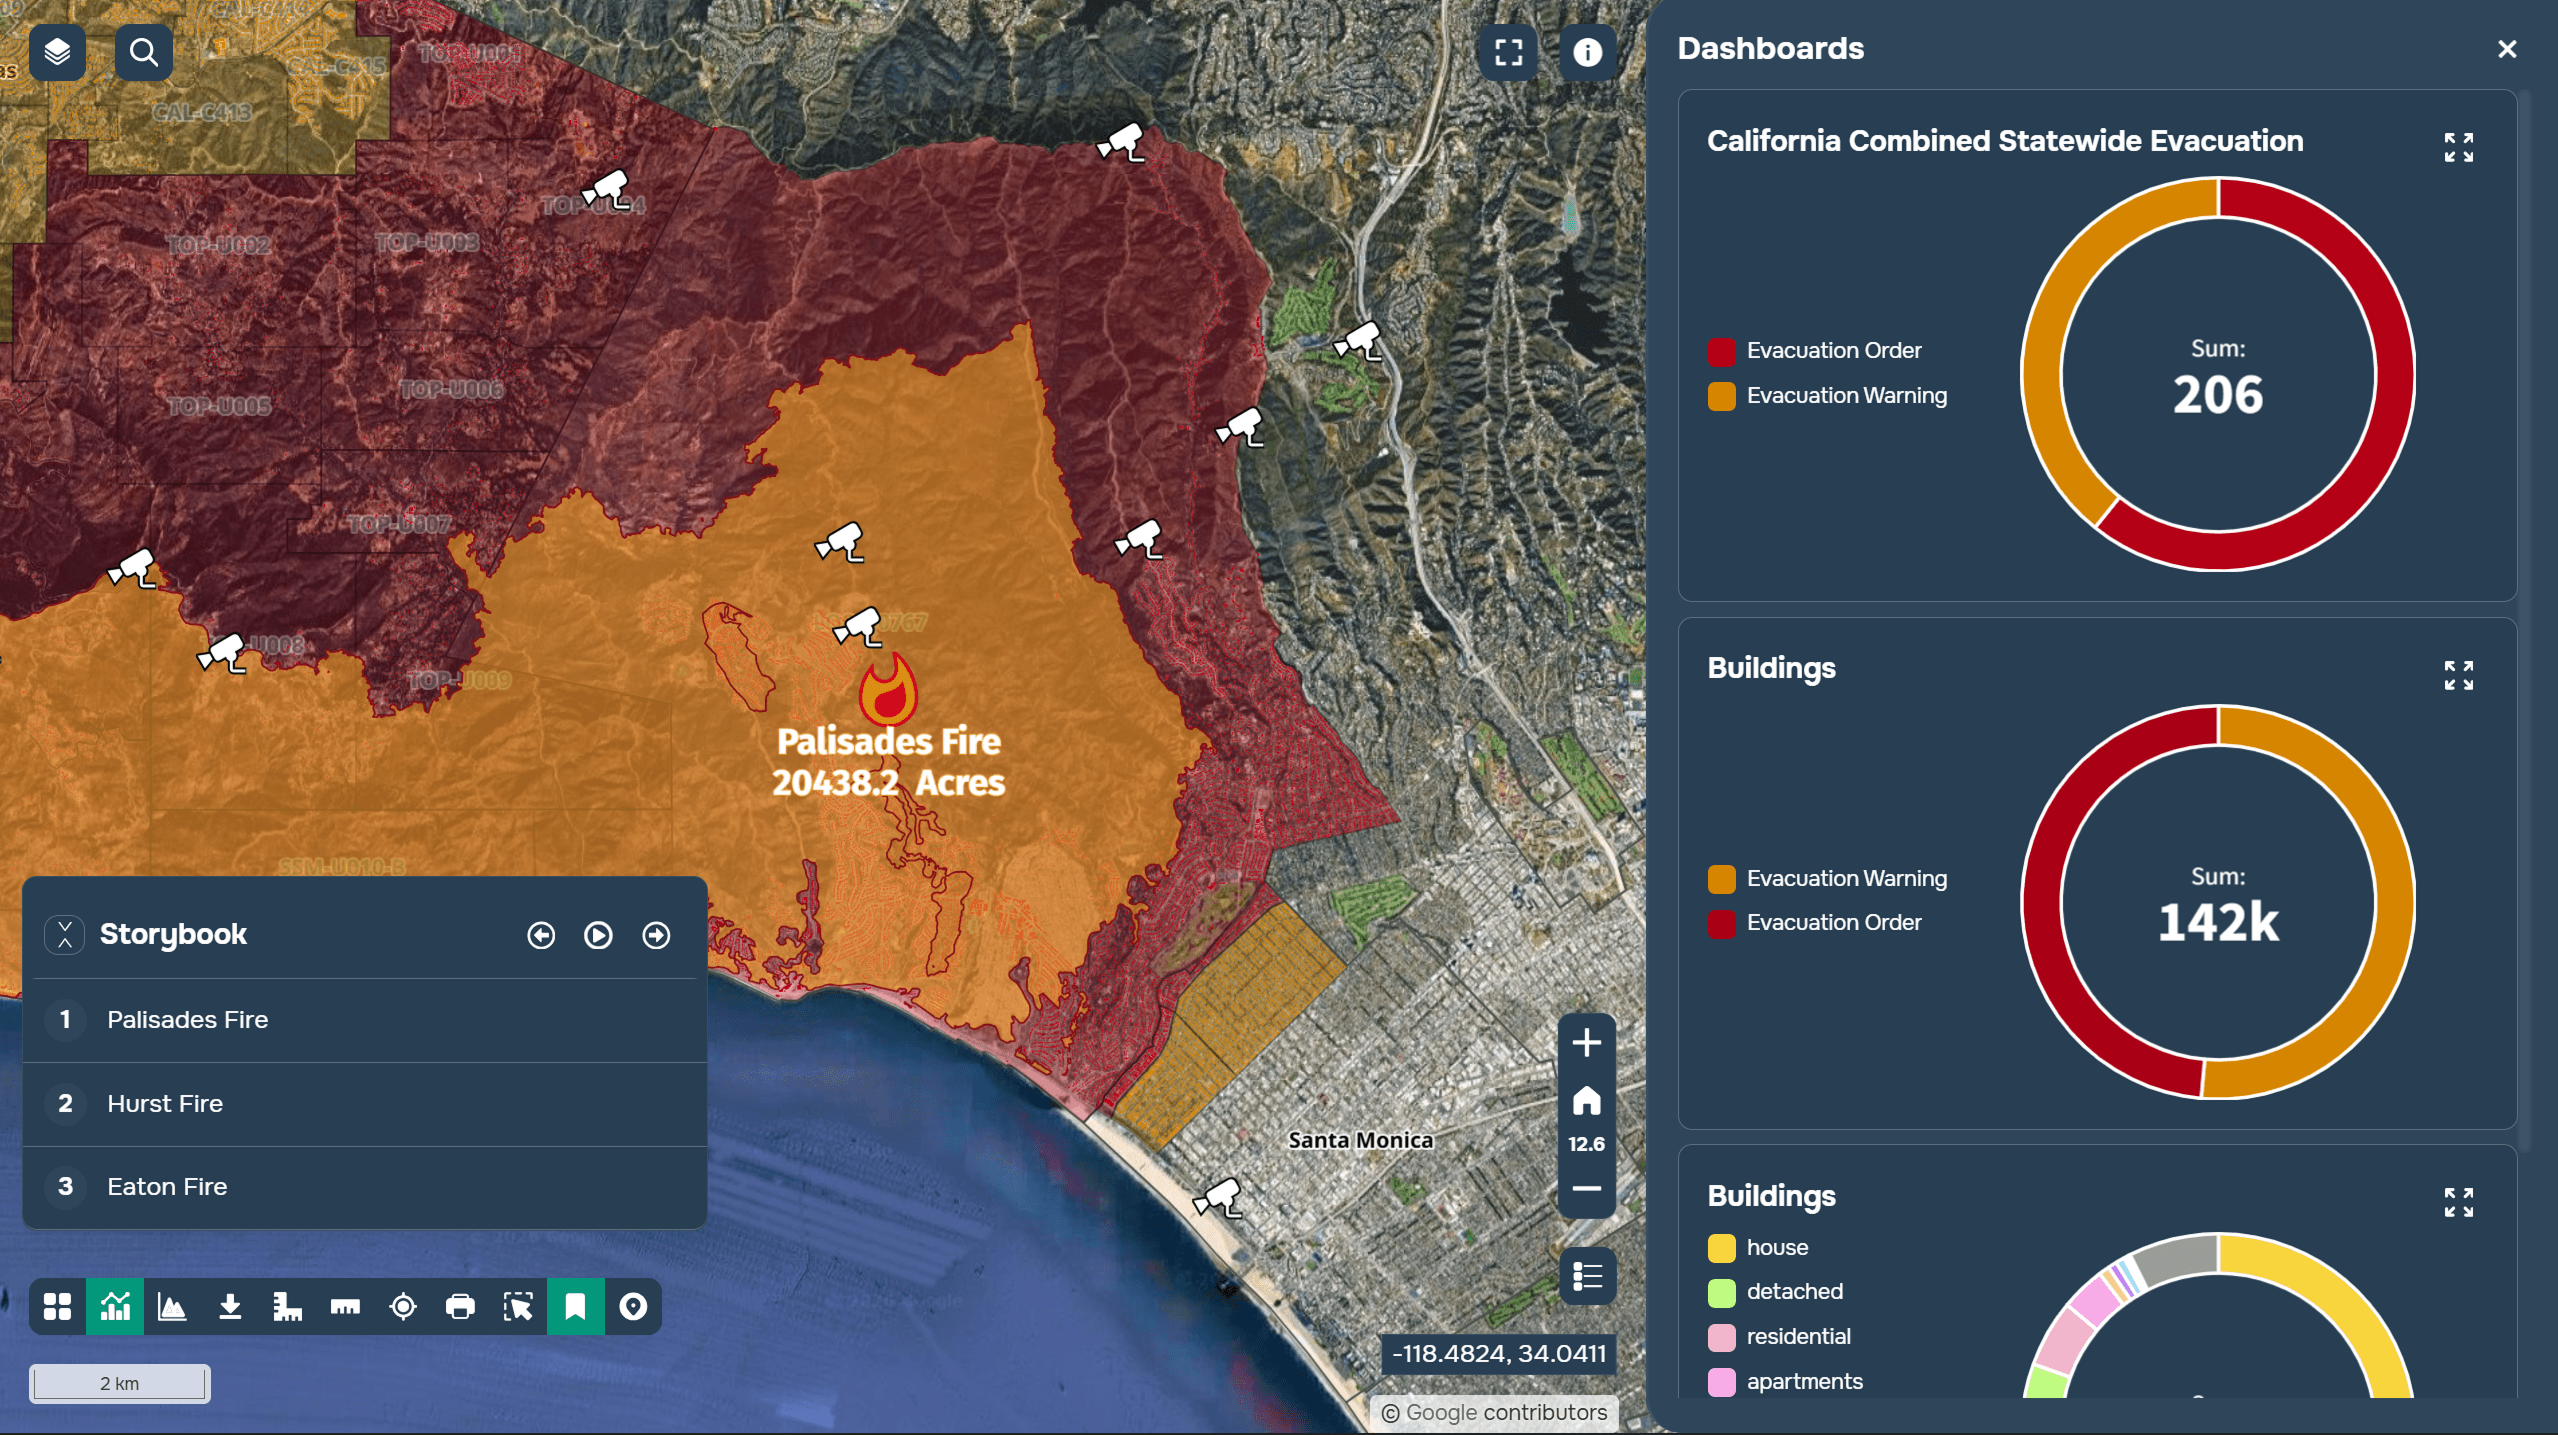
In wildfires, GIS is used to monitor fire spread and predict its movement. For example, NASA FIRMS allows active fires to be tracked in near real time.
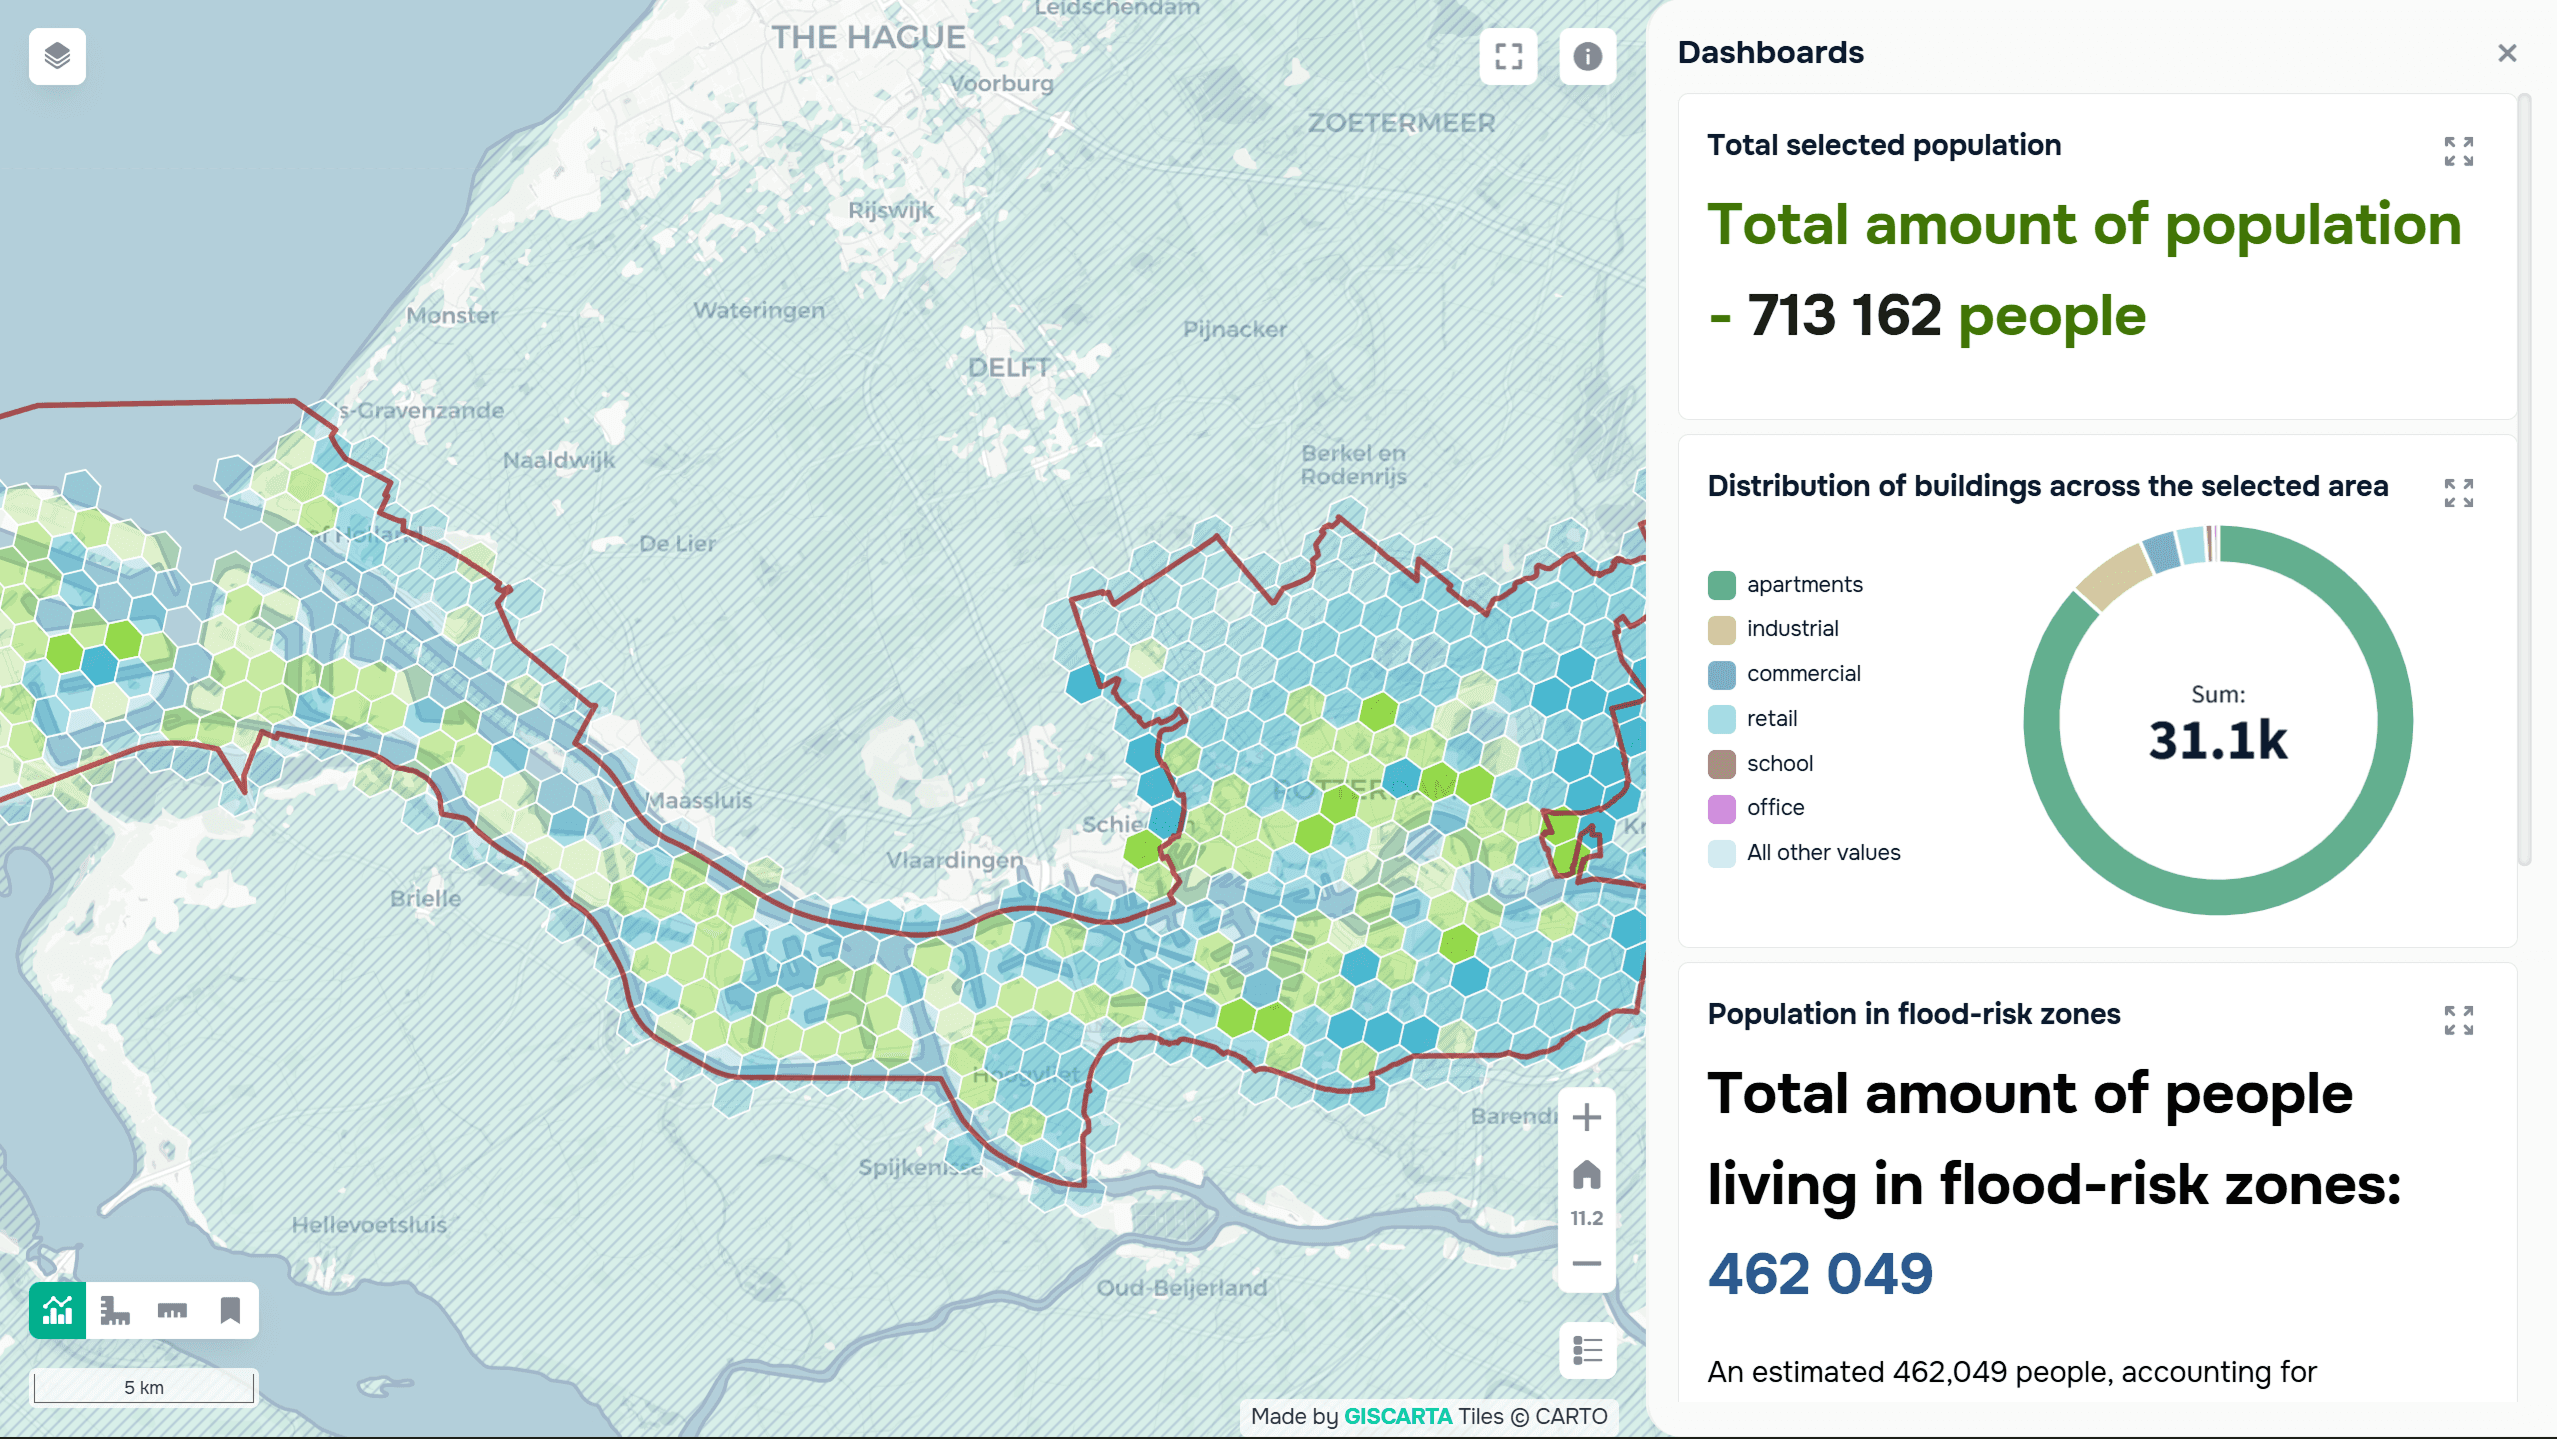
In floods, GIS is used to model flood zones and assess risk. Copernicus EMS provides ready-made maps used by response teams. USGS earthquake data is used to quickly assess the magnitude of an event and potential damage. This data is often combined with population density information to assess impacts.
FAQ
How is GIS used in emergency situations?
For monitoring, analysis, and coordination of emergency response.
Can it be used in real time?
Yes, using satellite data and international platforms.
What data is most important?
Satellite, climate, and infrastructure.
Key Takeaways
GIS enables rapid situational analysis and decision-making in emergency situations.
International platforms provide access to up-to-date data in near real time.
Combining various sources improves the accuracy of analysis and the effectiveness of response.


