
GIS systems utilize two basic data types: raster and vector. Despite their apparent simplicity, the choice between them directly impacts analysis results, calculation accuracy, and ease of use. Mistakes at this stage can lead to incorrect conclusions or unnecessarily complicate a project. Therefore, it's important to understand not only the differences between these formats but also their practical applications.
What is raster data?
Raster data is a regular grid of cells, where each cell contains a specific value. These values can describe various surface characteristics, such as elevation, temperature, humidity, or vegetation status. Essentially, a raster is a way to represent a continuous surface digitally.
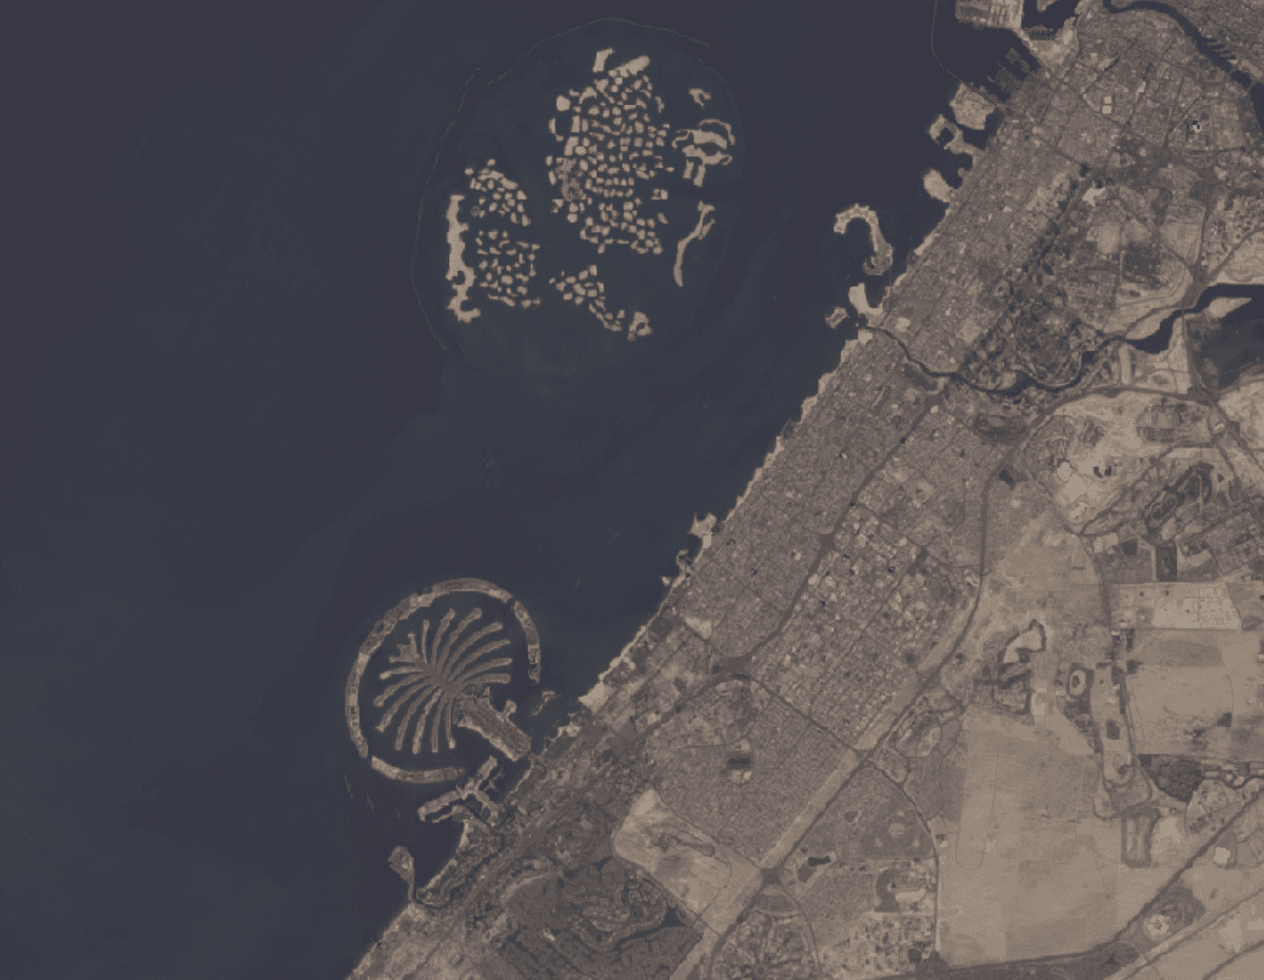
Example of raster data: satellite image of Dubai.
Classic examples of raster data include satellite images, digital elevation models (DEMs), climate maps, and various indices such as NDVI. A key feature of rasters is that the values change gradually from one cell to the next, reflecting real-world natural processes. The quality of raster data directly depends on its resolution. The smaller the pixel size, the more detailed the information, but the greater the data volume and processing load.
What is vector data?
Vector data, unlike raster data, describes individual objects with clear boundaries. It is represented as geometries: points, lines, and polygons, and is usually accompanied by attribute information.
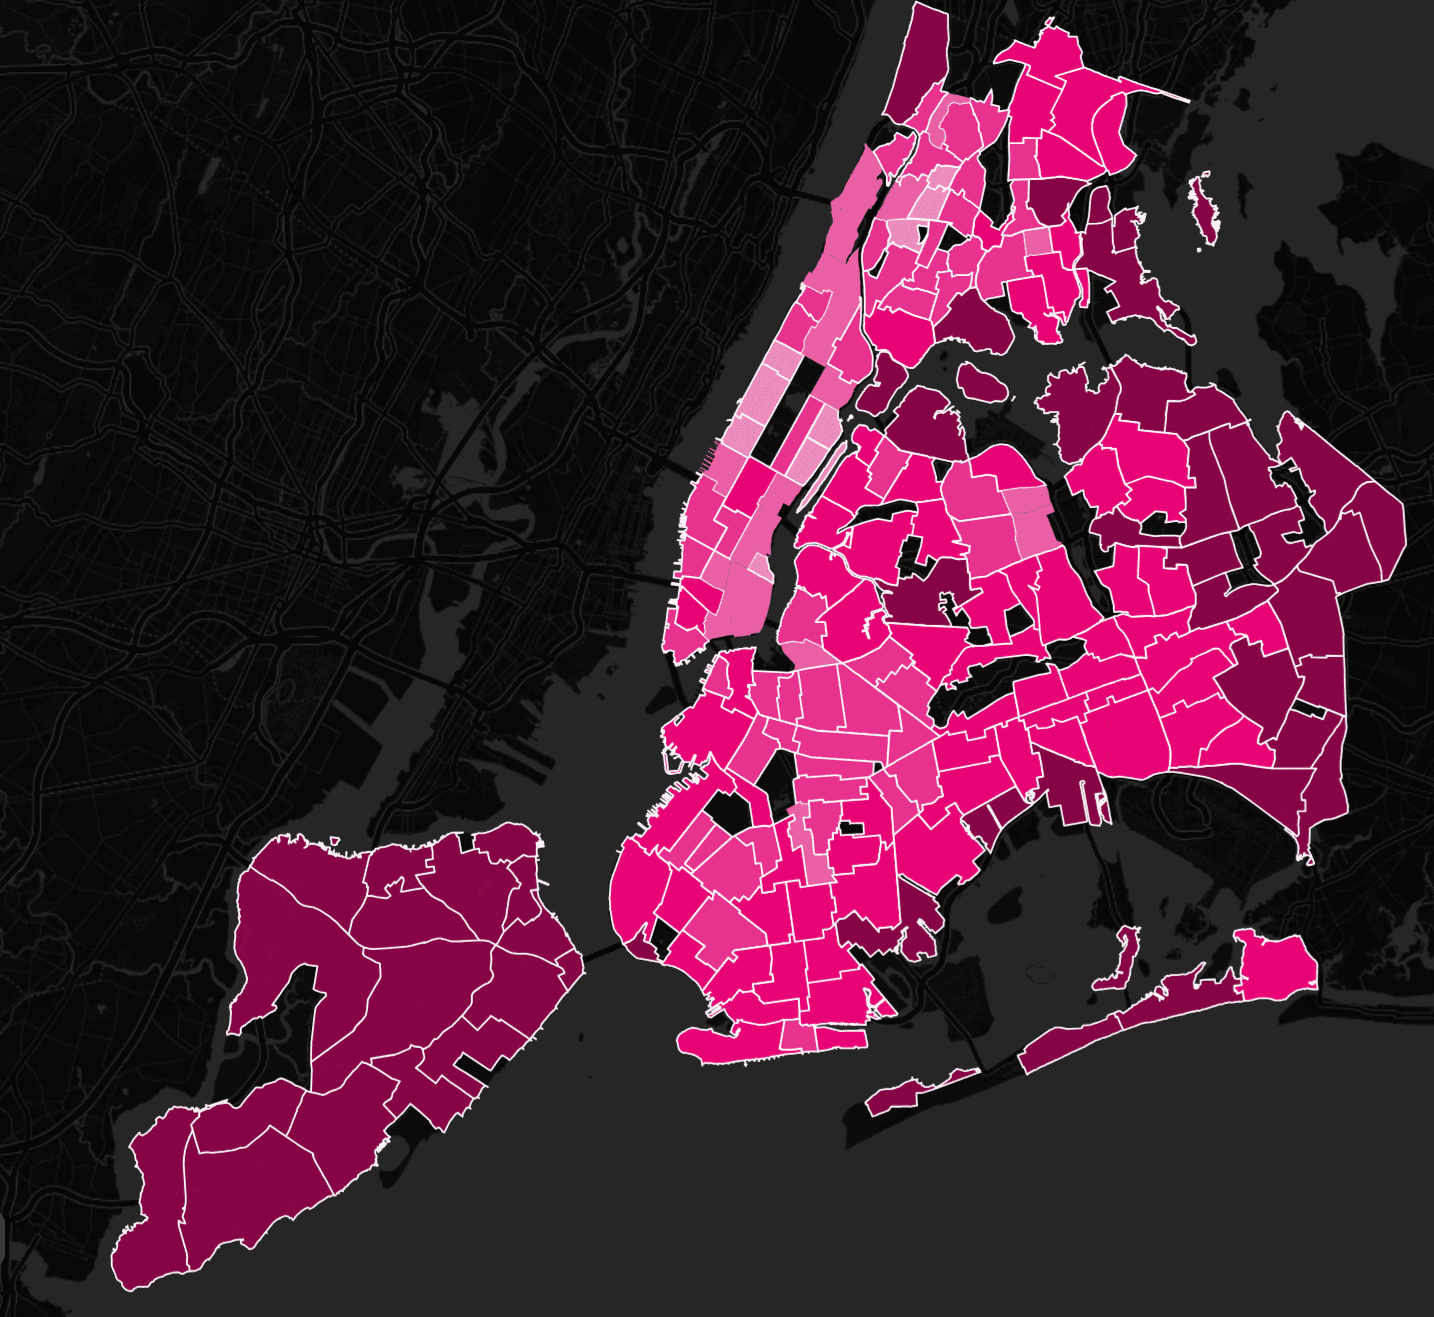
Vector data example: New York City's administrative divisions
This structure makes vector data convenient for describing infrastructure and administrative boundaries. For example, roads, buildings, rivers, districts, and cities are almost always represented in vector format.
The main advantage of vectors is precision. Object boundaries are defined by coordinates, enabling precise measurements and analysis.
Key Differences
The primary difference between raster and vector data is how they represent space. Rasters describe a surface as a continuous field of values, while vectors represent individual objects.
Raster data is better suited for analyzing natural processes and continuous phenomena, but it requires more memory and is dependent on resolution. Vector data, on the other hand, is more compact and accurate when working with objects, but is poorly suited for surface modeling.
When to Use Raster?
Raster data is used when working with continuous values. This could be analyzing temperature, precipitation, elevation, or vegetation condition. In such tasks, it is important to account for gradual changes in values, making raster the most suitable format.
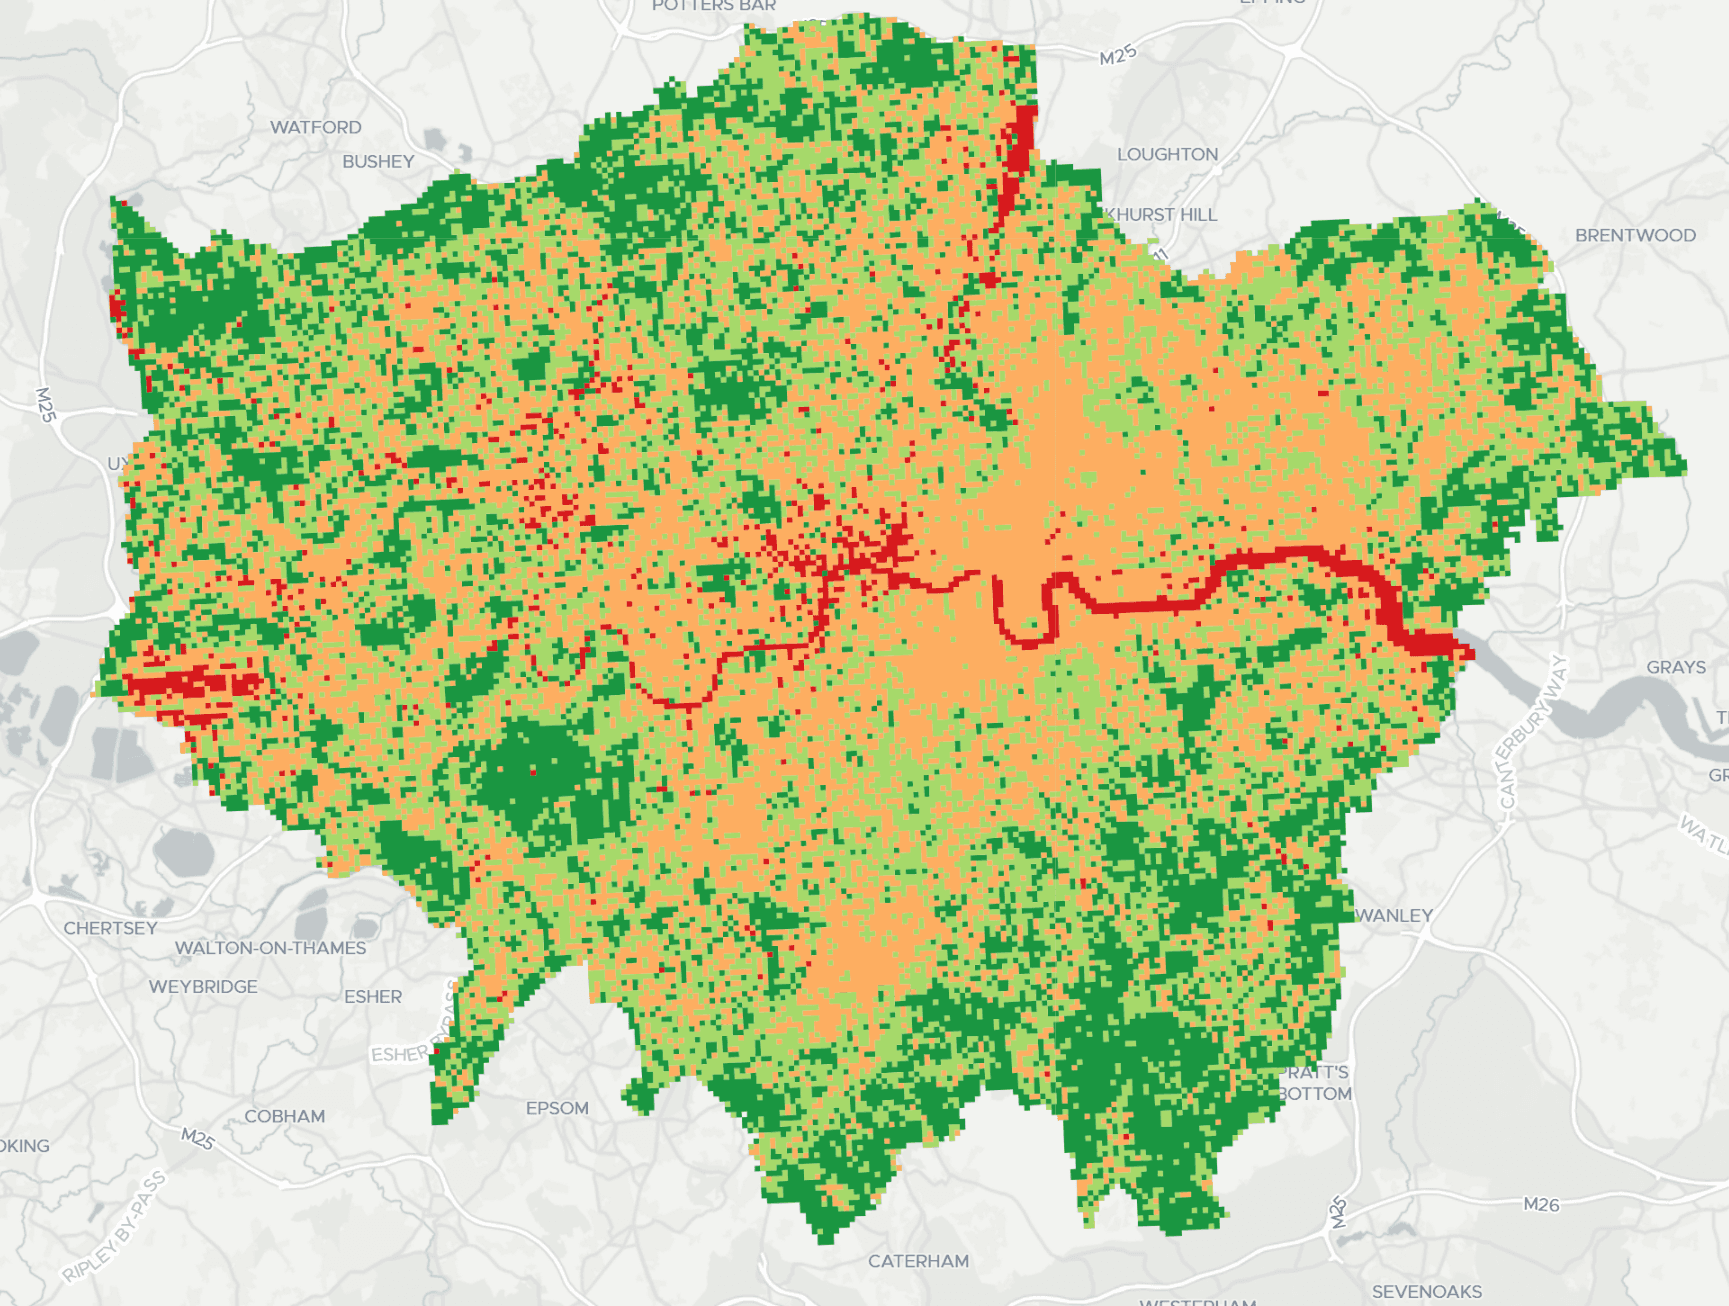
Raster data of the NDVI index for the London area.
Rasters are also widely used when working with satellite data. They are used to classify surfaces, analyze changes over time, and calculate indices. Furthermore, raster is indispensable in modeling processes such as forest fire spread, water movement, or climate change.
When to Use Vector?
Vector data is used when it is important to describe individual objects. This could be a transportation network, buildings, territorial boundaries, or points of interest. Such tasks require precision and a clear data structure.
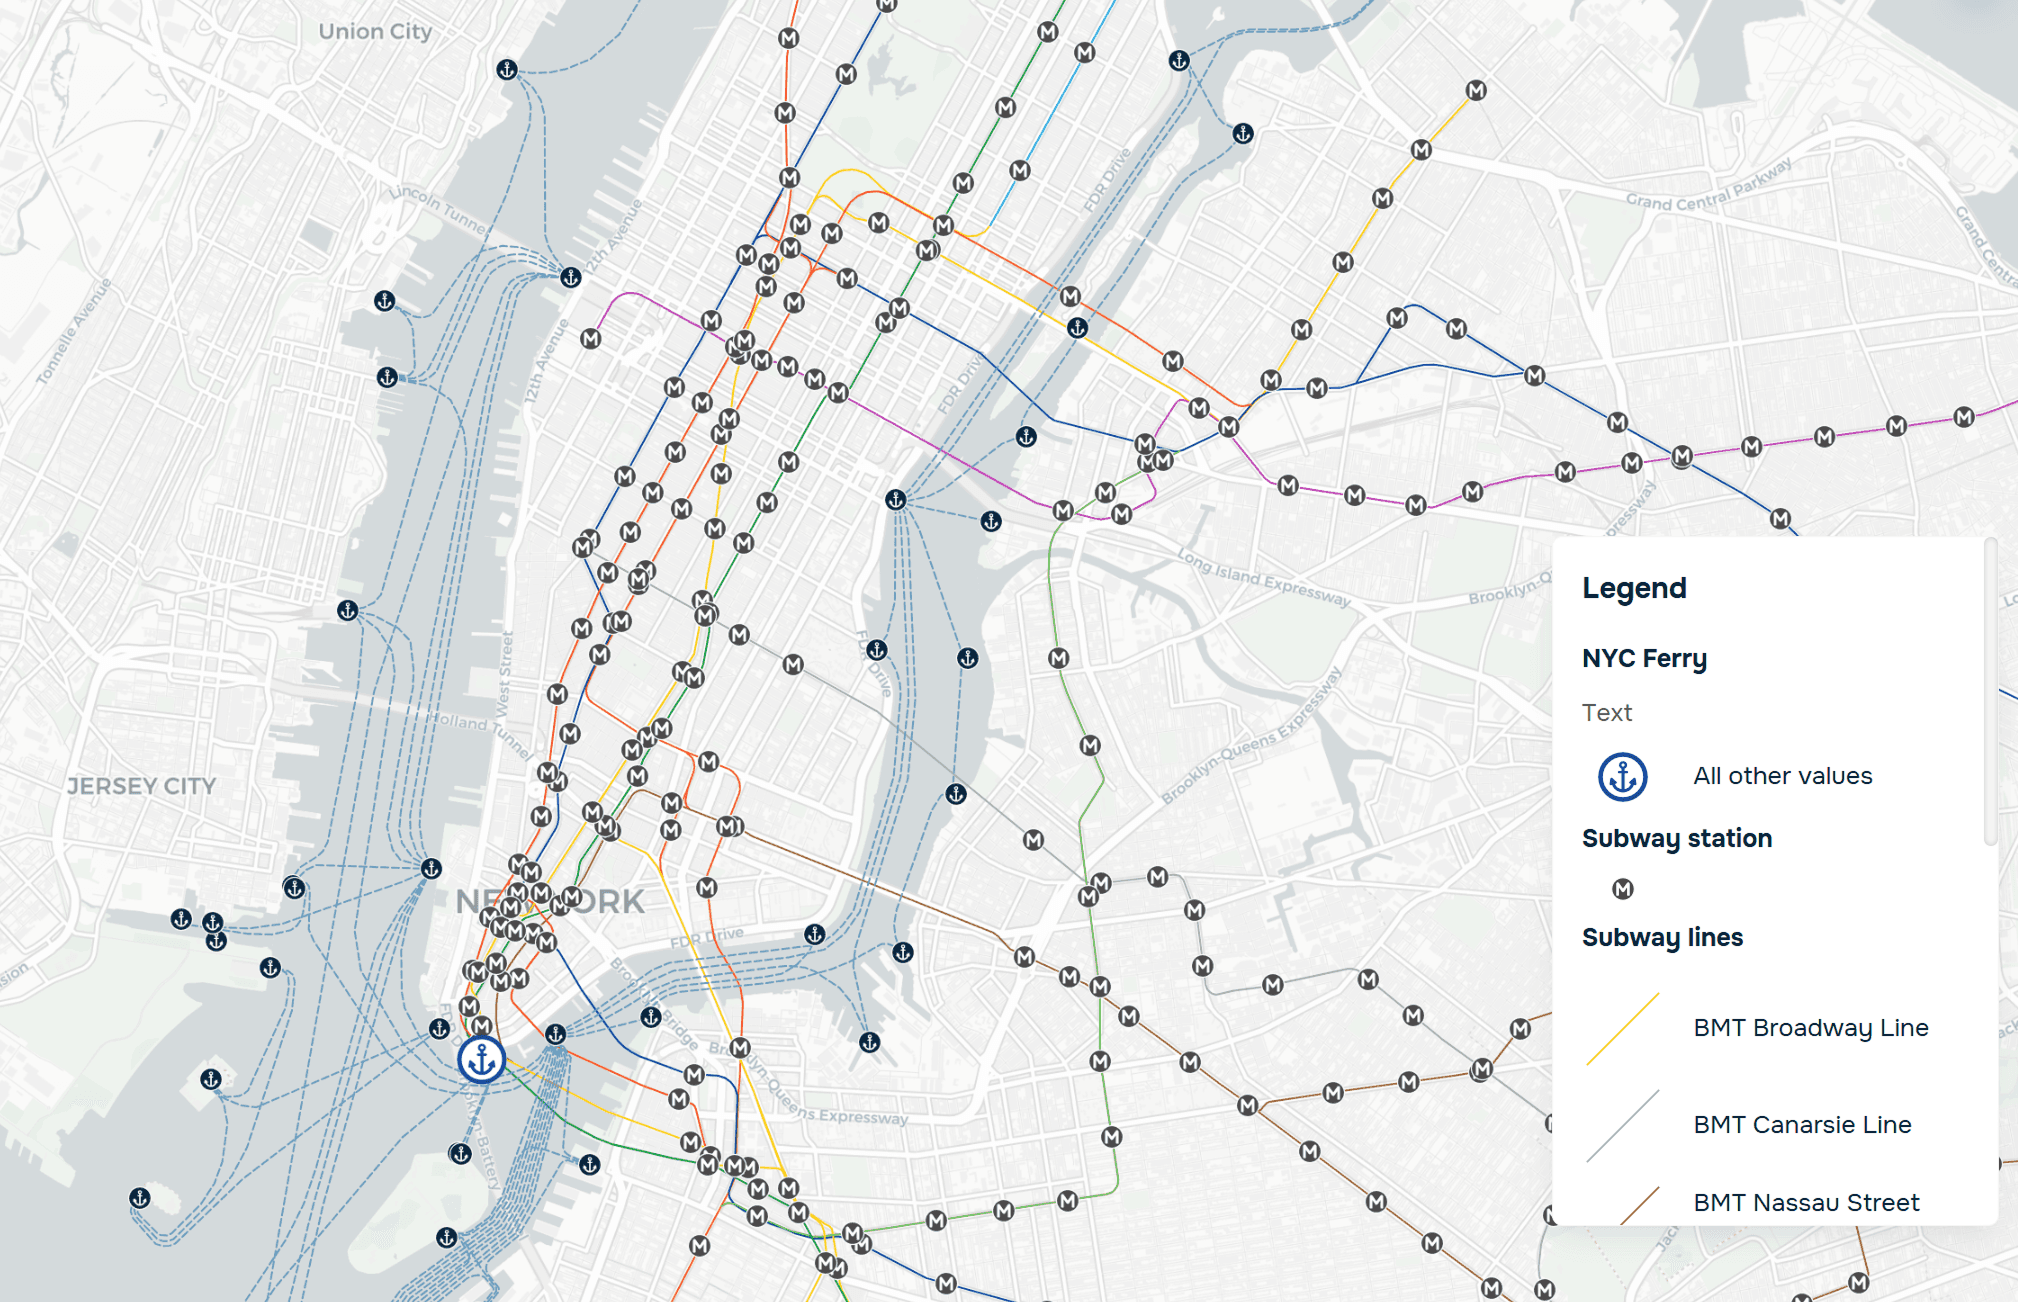
Vector data of the New York City transit system.
The vector format is also the basis for network analysis. Routing, logistics, and transportation models are built specifically on vector lines and nodes. Vector data is also widely used in geomarketing, where it's important to analyze service areas, facility locations, and interactions with infrastructure.
Combining Raster and Vector
In practice, most projects use both data types simultaneously. For example, you can analyze a vegetation index (raster) within administrative boundaries (vector) or compare climate data with populated areas.
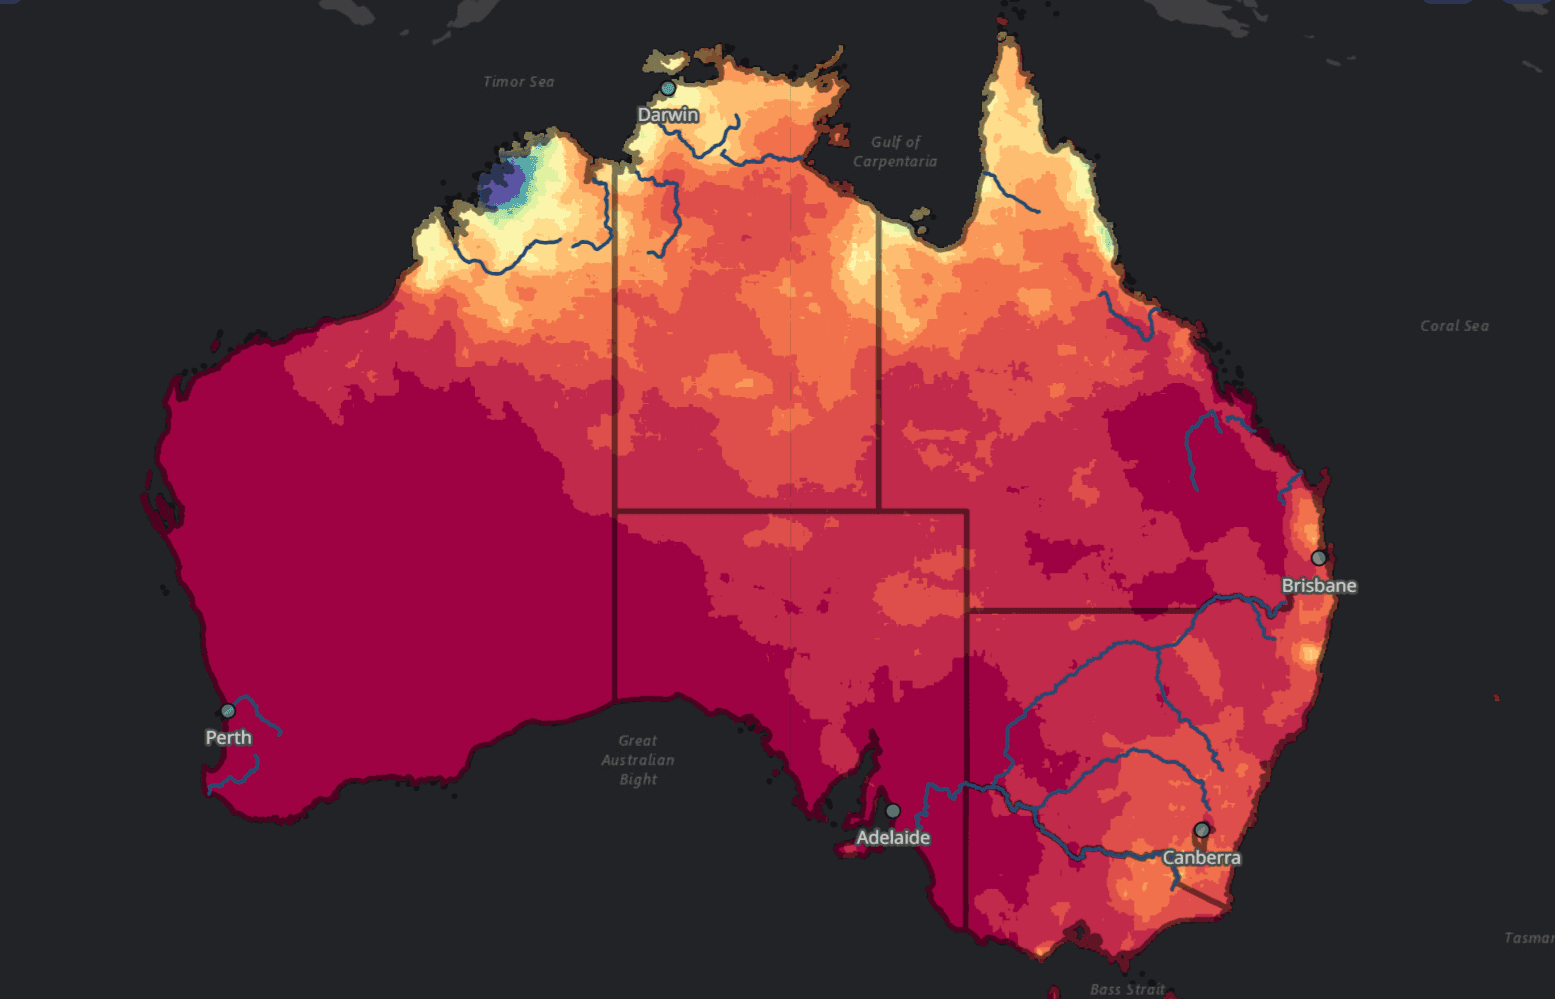
A combination of climate raster data and vector data of hydrography and settlements.
Operations such as layering, value extraction, or data clipping allow you to combine different formats and obtain more accurate results. The combination of raster and vector data offers the greatest flexibility in analysis.
Typical Mistakes
One common mistake is using the wrong format for the task. For example, attempting to analyze continuous processes using vector data or using rasters to describe individual objects. Another common problem is choosing the wrong resolution or using excessive detail, which complicates the work without providing any real benefit. Tools
Standard GIS tools such as QGIS (https://qgis.org/) and ArcGIS are used to work with raster and vector data, enabling both basic and advanced analysis. Google Earth Engine (https://earthengine.google.com/), which provides cloud-based data processing, is often used for working with large volumes of satellite data.
FAQ
Which is better: raster or vector?
The choice depends on the task and the type of data.
Can both formats be used together?
Yes, this is standard practice in most projects.
Why does raster data take up more space?
Because the values are stored longer


