
Map Gallery is a section of the GISCARTA platform that contains ready-made interactive projects on various topics. Each project demonstrates how the platform and its widgets can be used to solve specific problems.
The main idea of this section is to showcase GIS not only as an analytical tool, but also as a means of data visualization and storytelling. The projects in the gallery can be used:
as visualization examples
for exploring analytical approaches
as a basis for your own solutions
to demonstrate the platform's capabilities
The gallery features both classic analytical maps and more experimental projects with 3D and storytelling elements.
Urban Economy
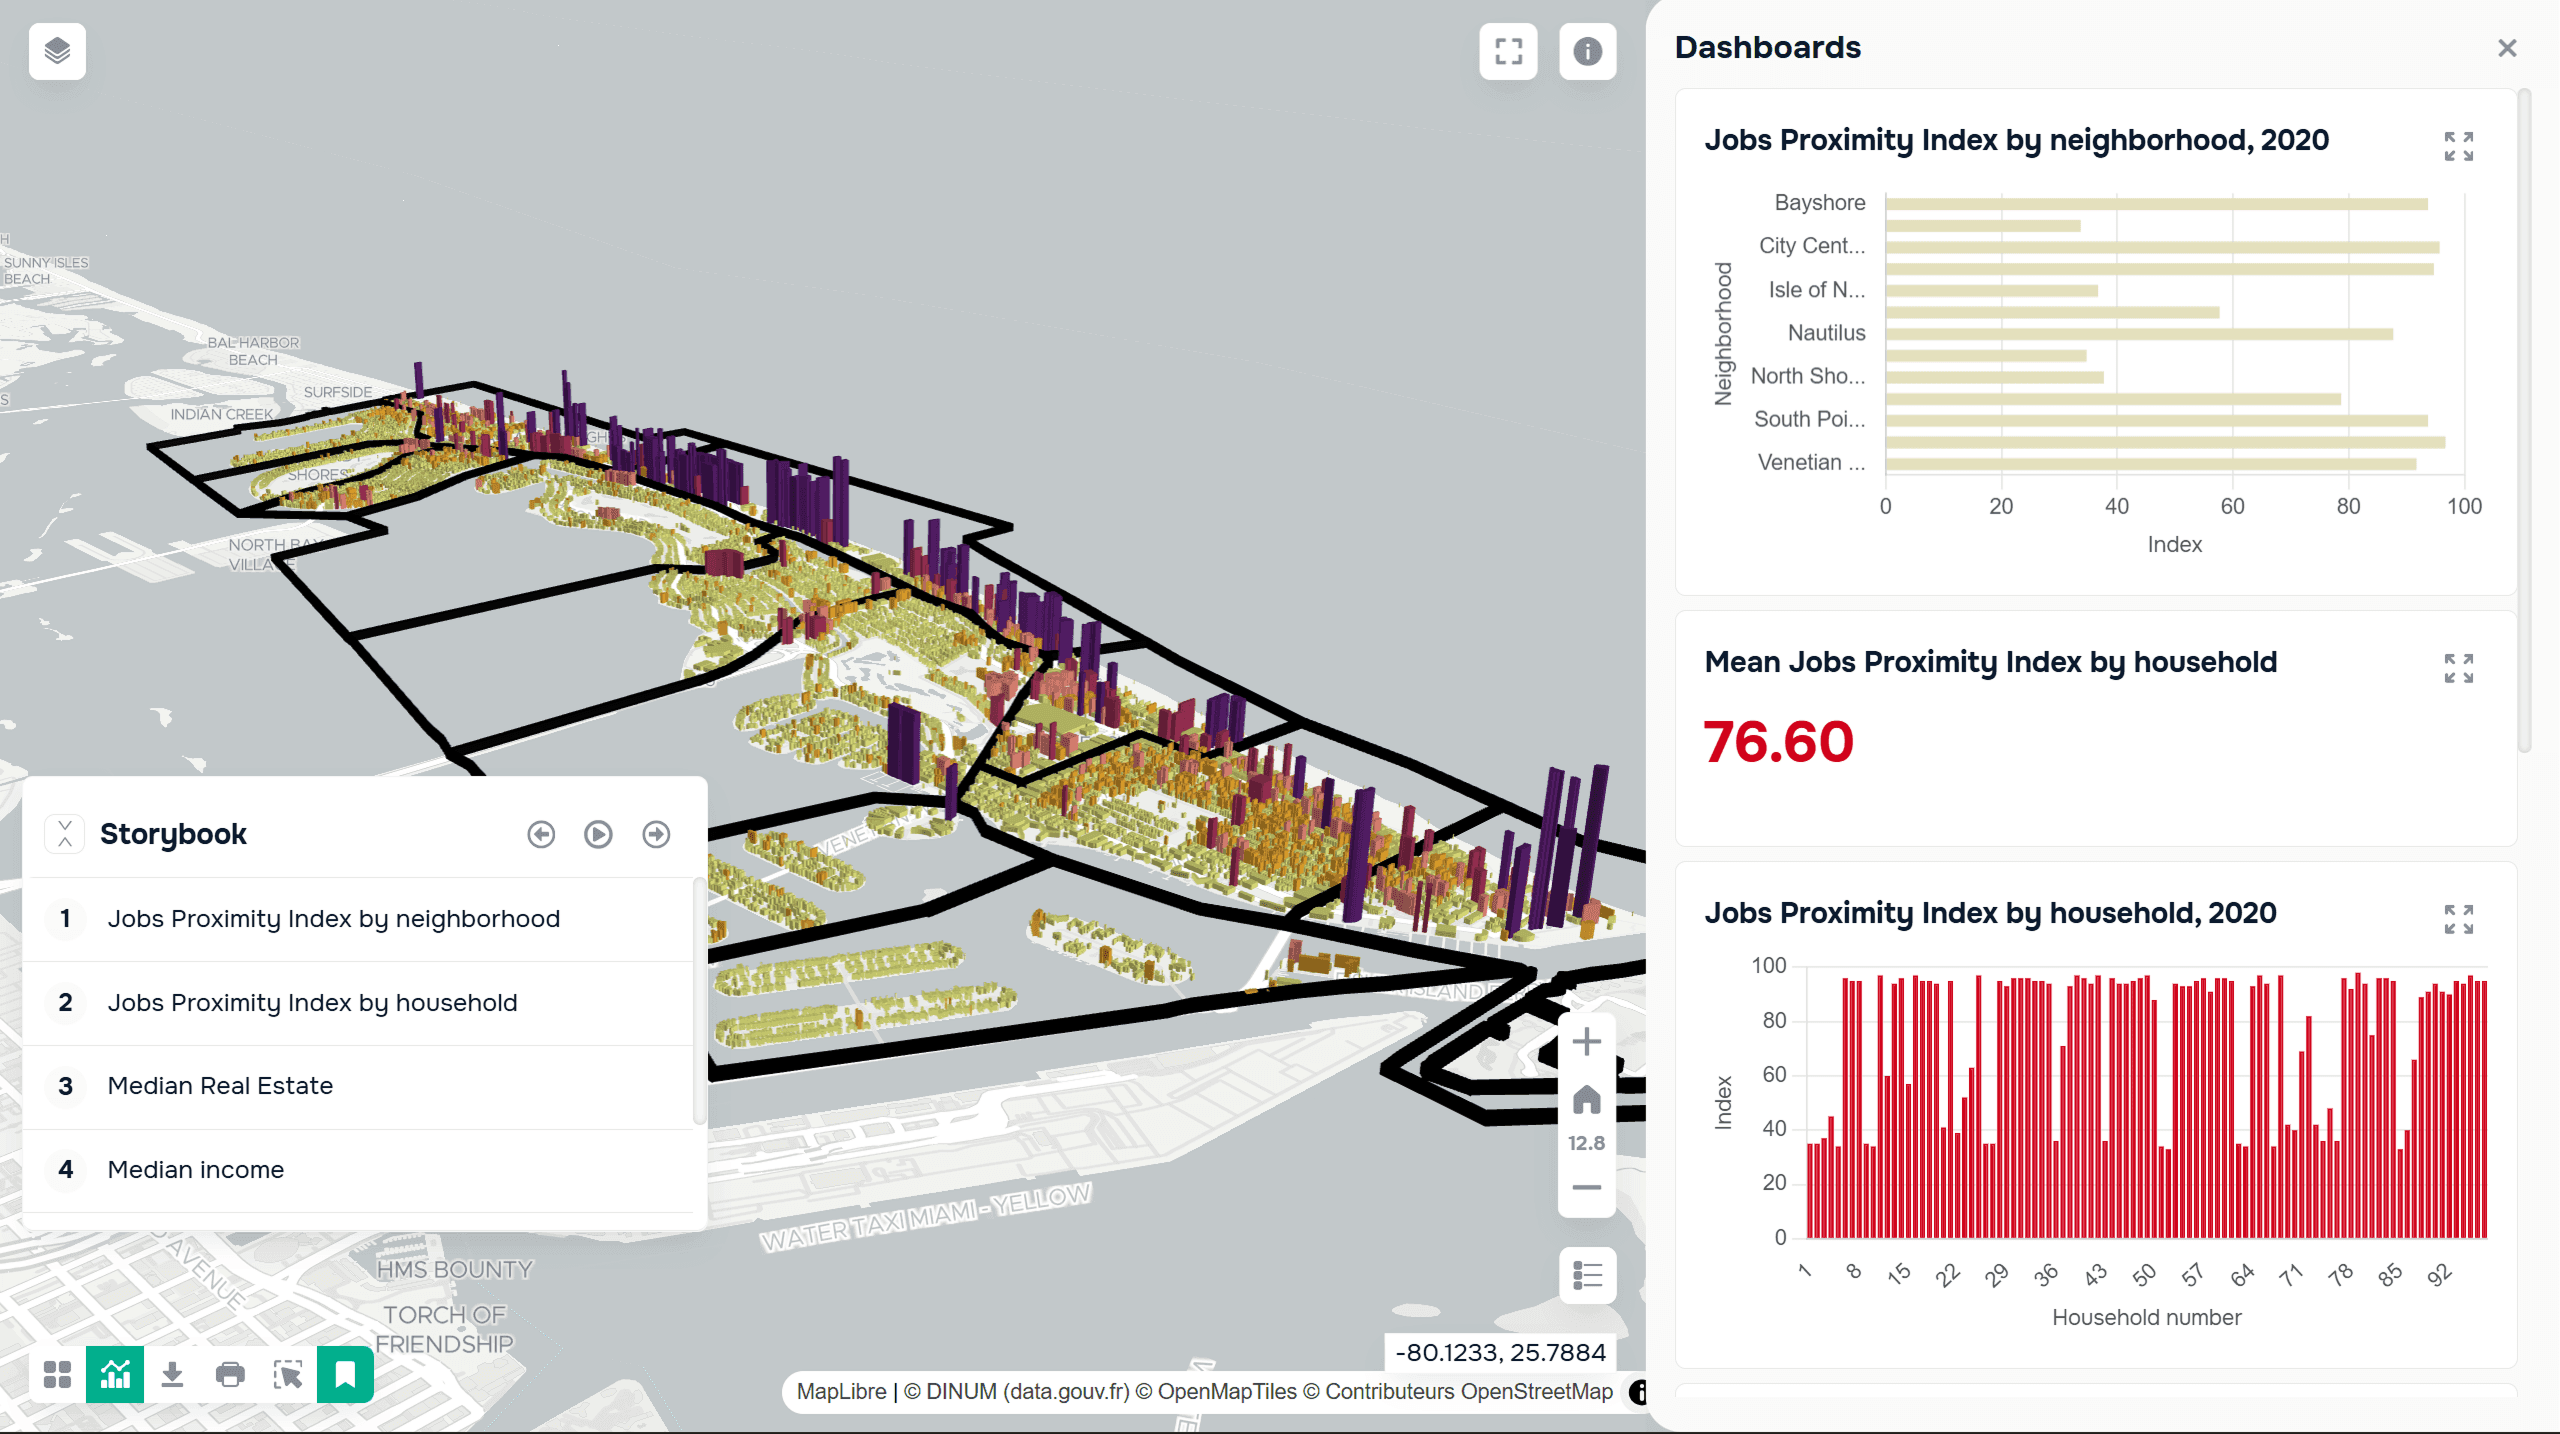
This Miami real estate project demonstrates how GIS is used to analyze the real estate market.
The map can be used to study:
property values
division of neighborhoods
infrastructure
proximity to transportation hubs
This is an example of using GIS for investment and market analysis.
Manhattan Fast Food & Retail Density Map
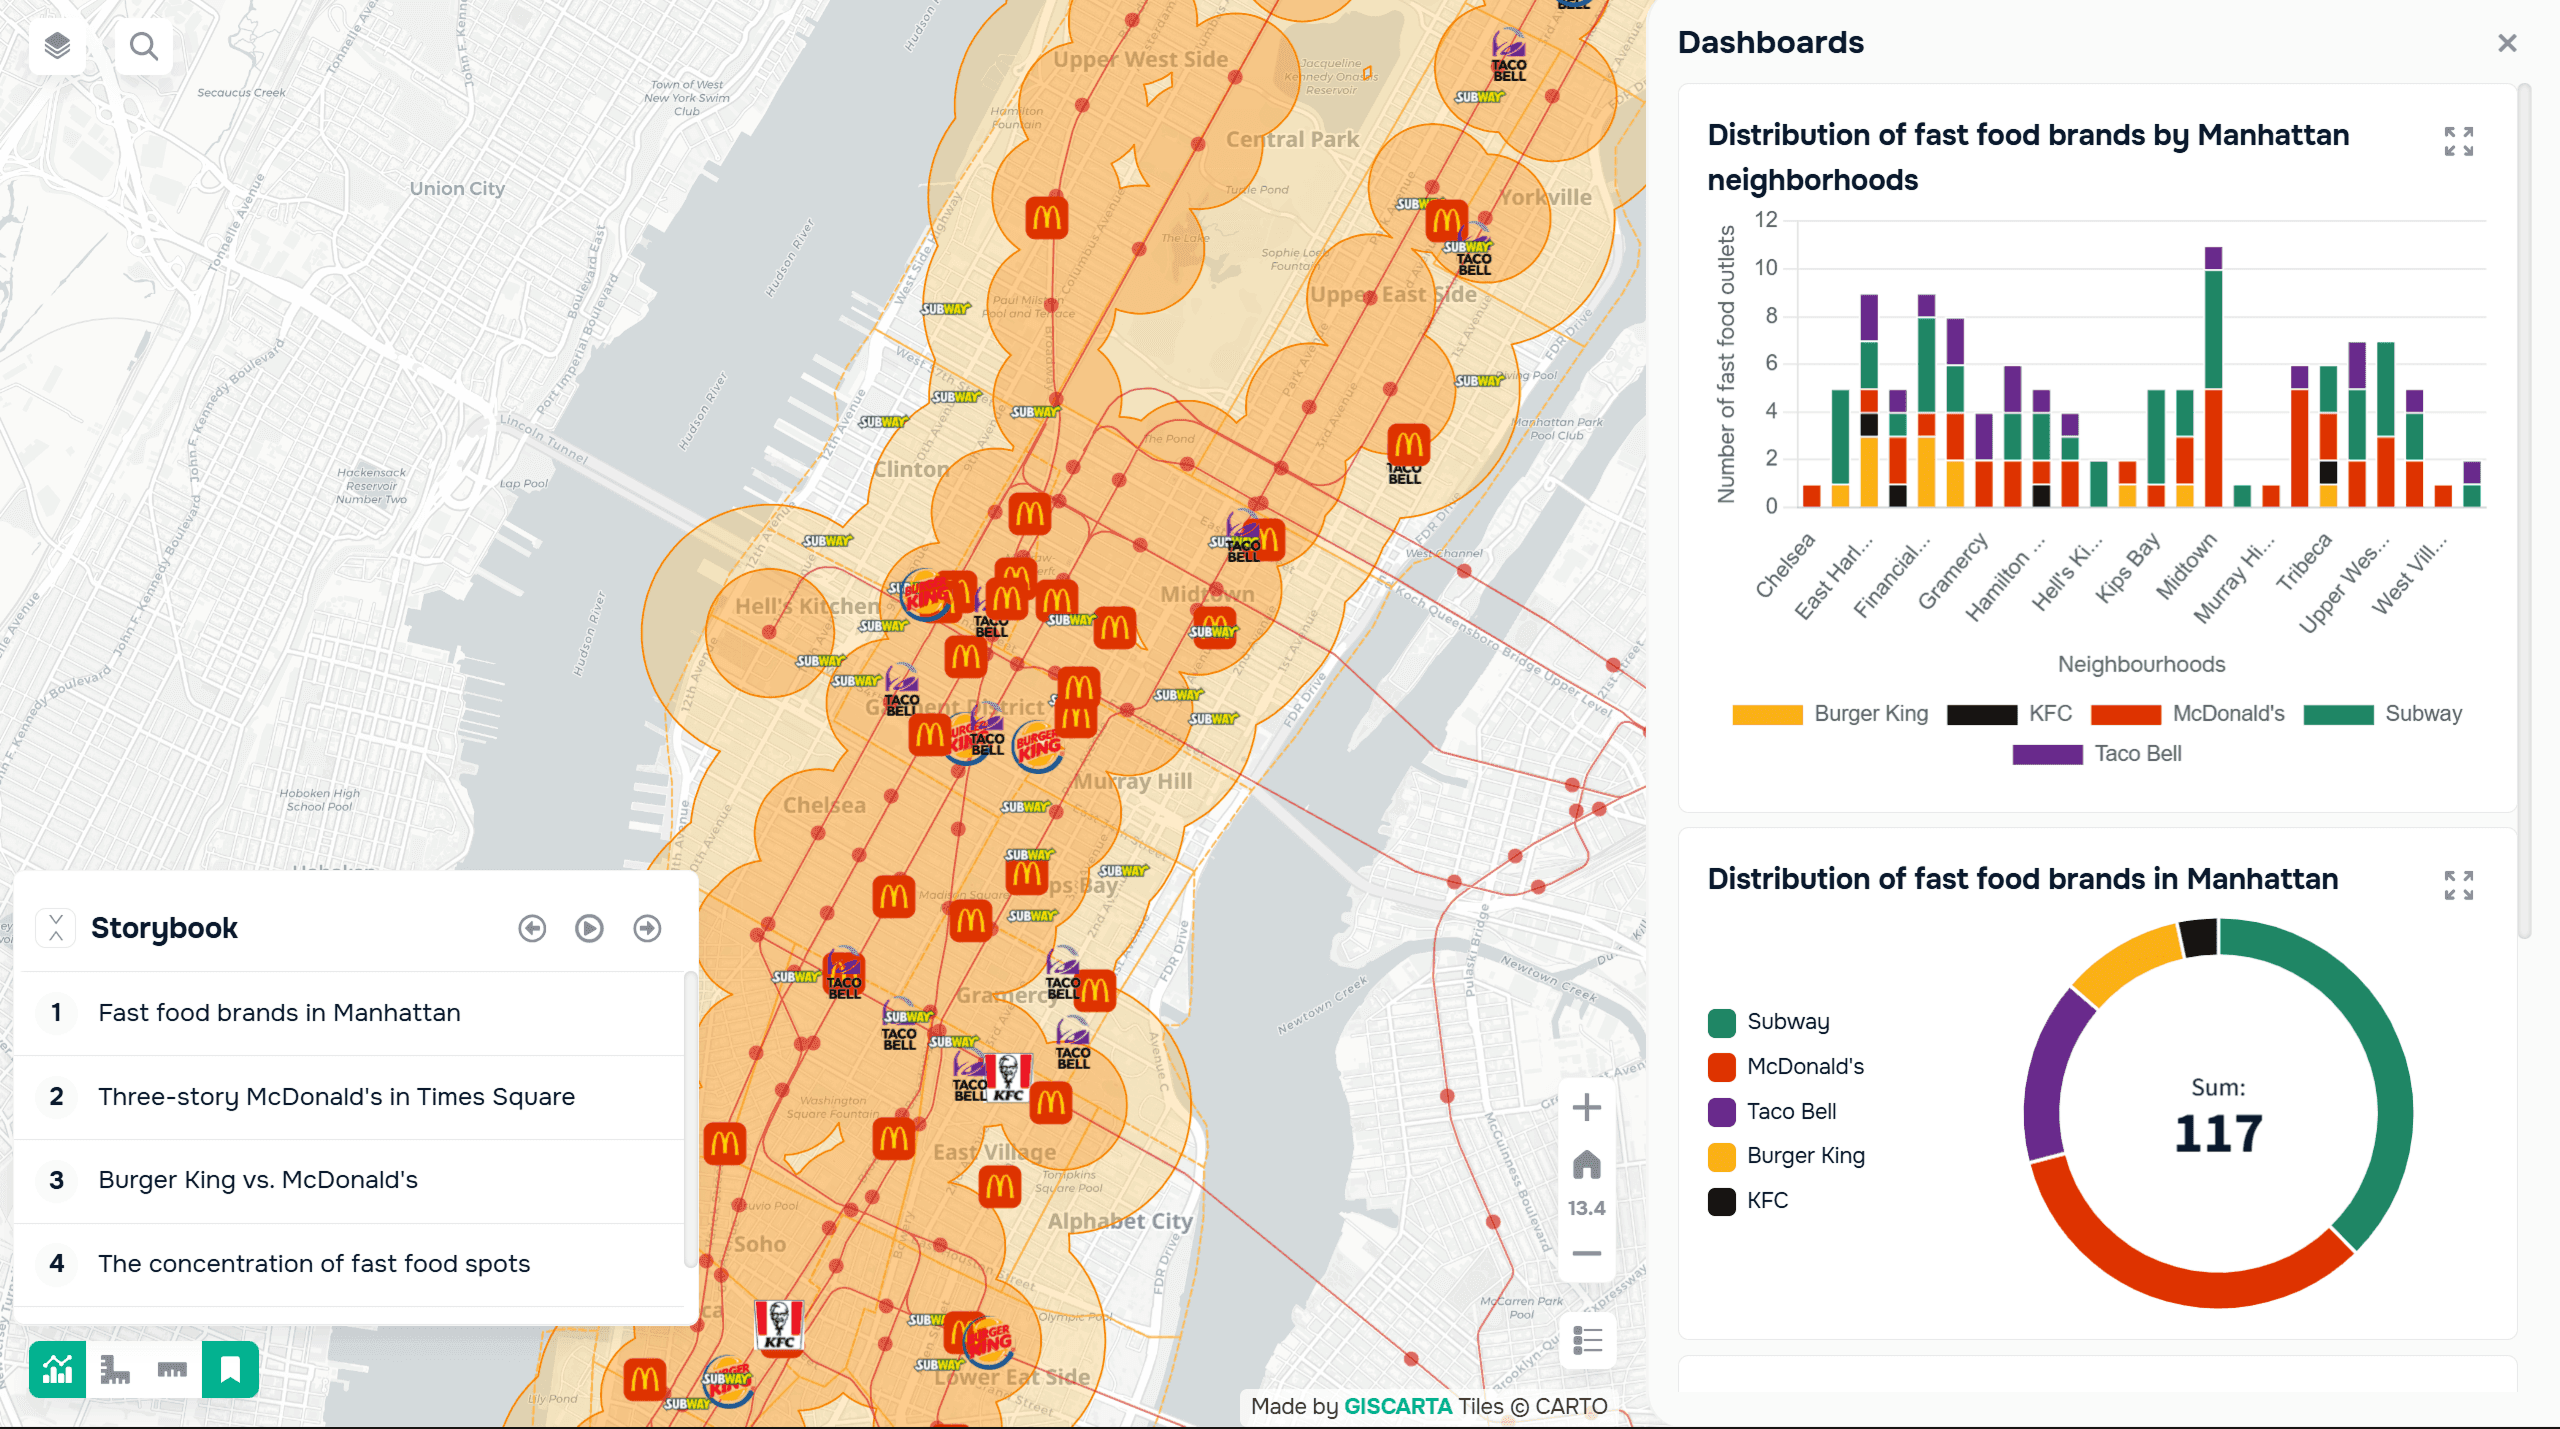
This Manhattan map visualizes the density of fast food restaurants and retail infrastructure. This project demonstrates:
heatmap analysis
spatial clustering
business concentration analysis
Such projects are actively used in geomarketing and location intelligence.
Agriculture and Natural Resources
Kings County Agriculture Analysis Map
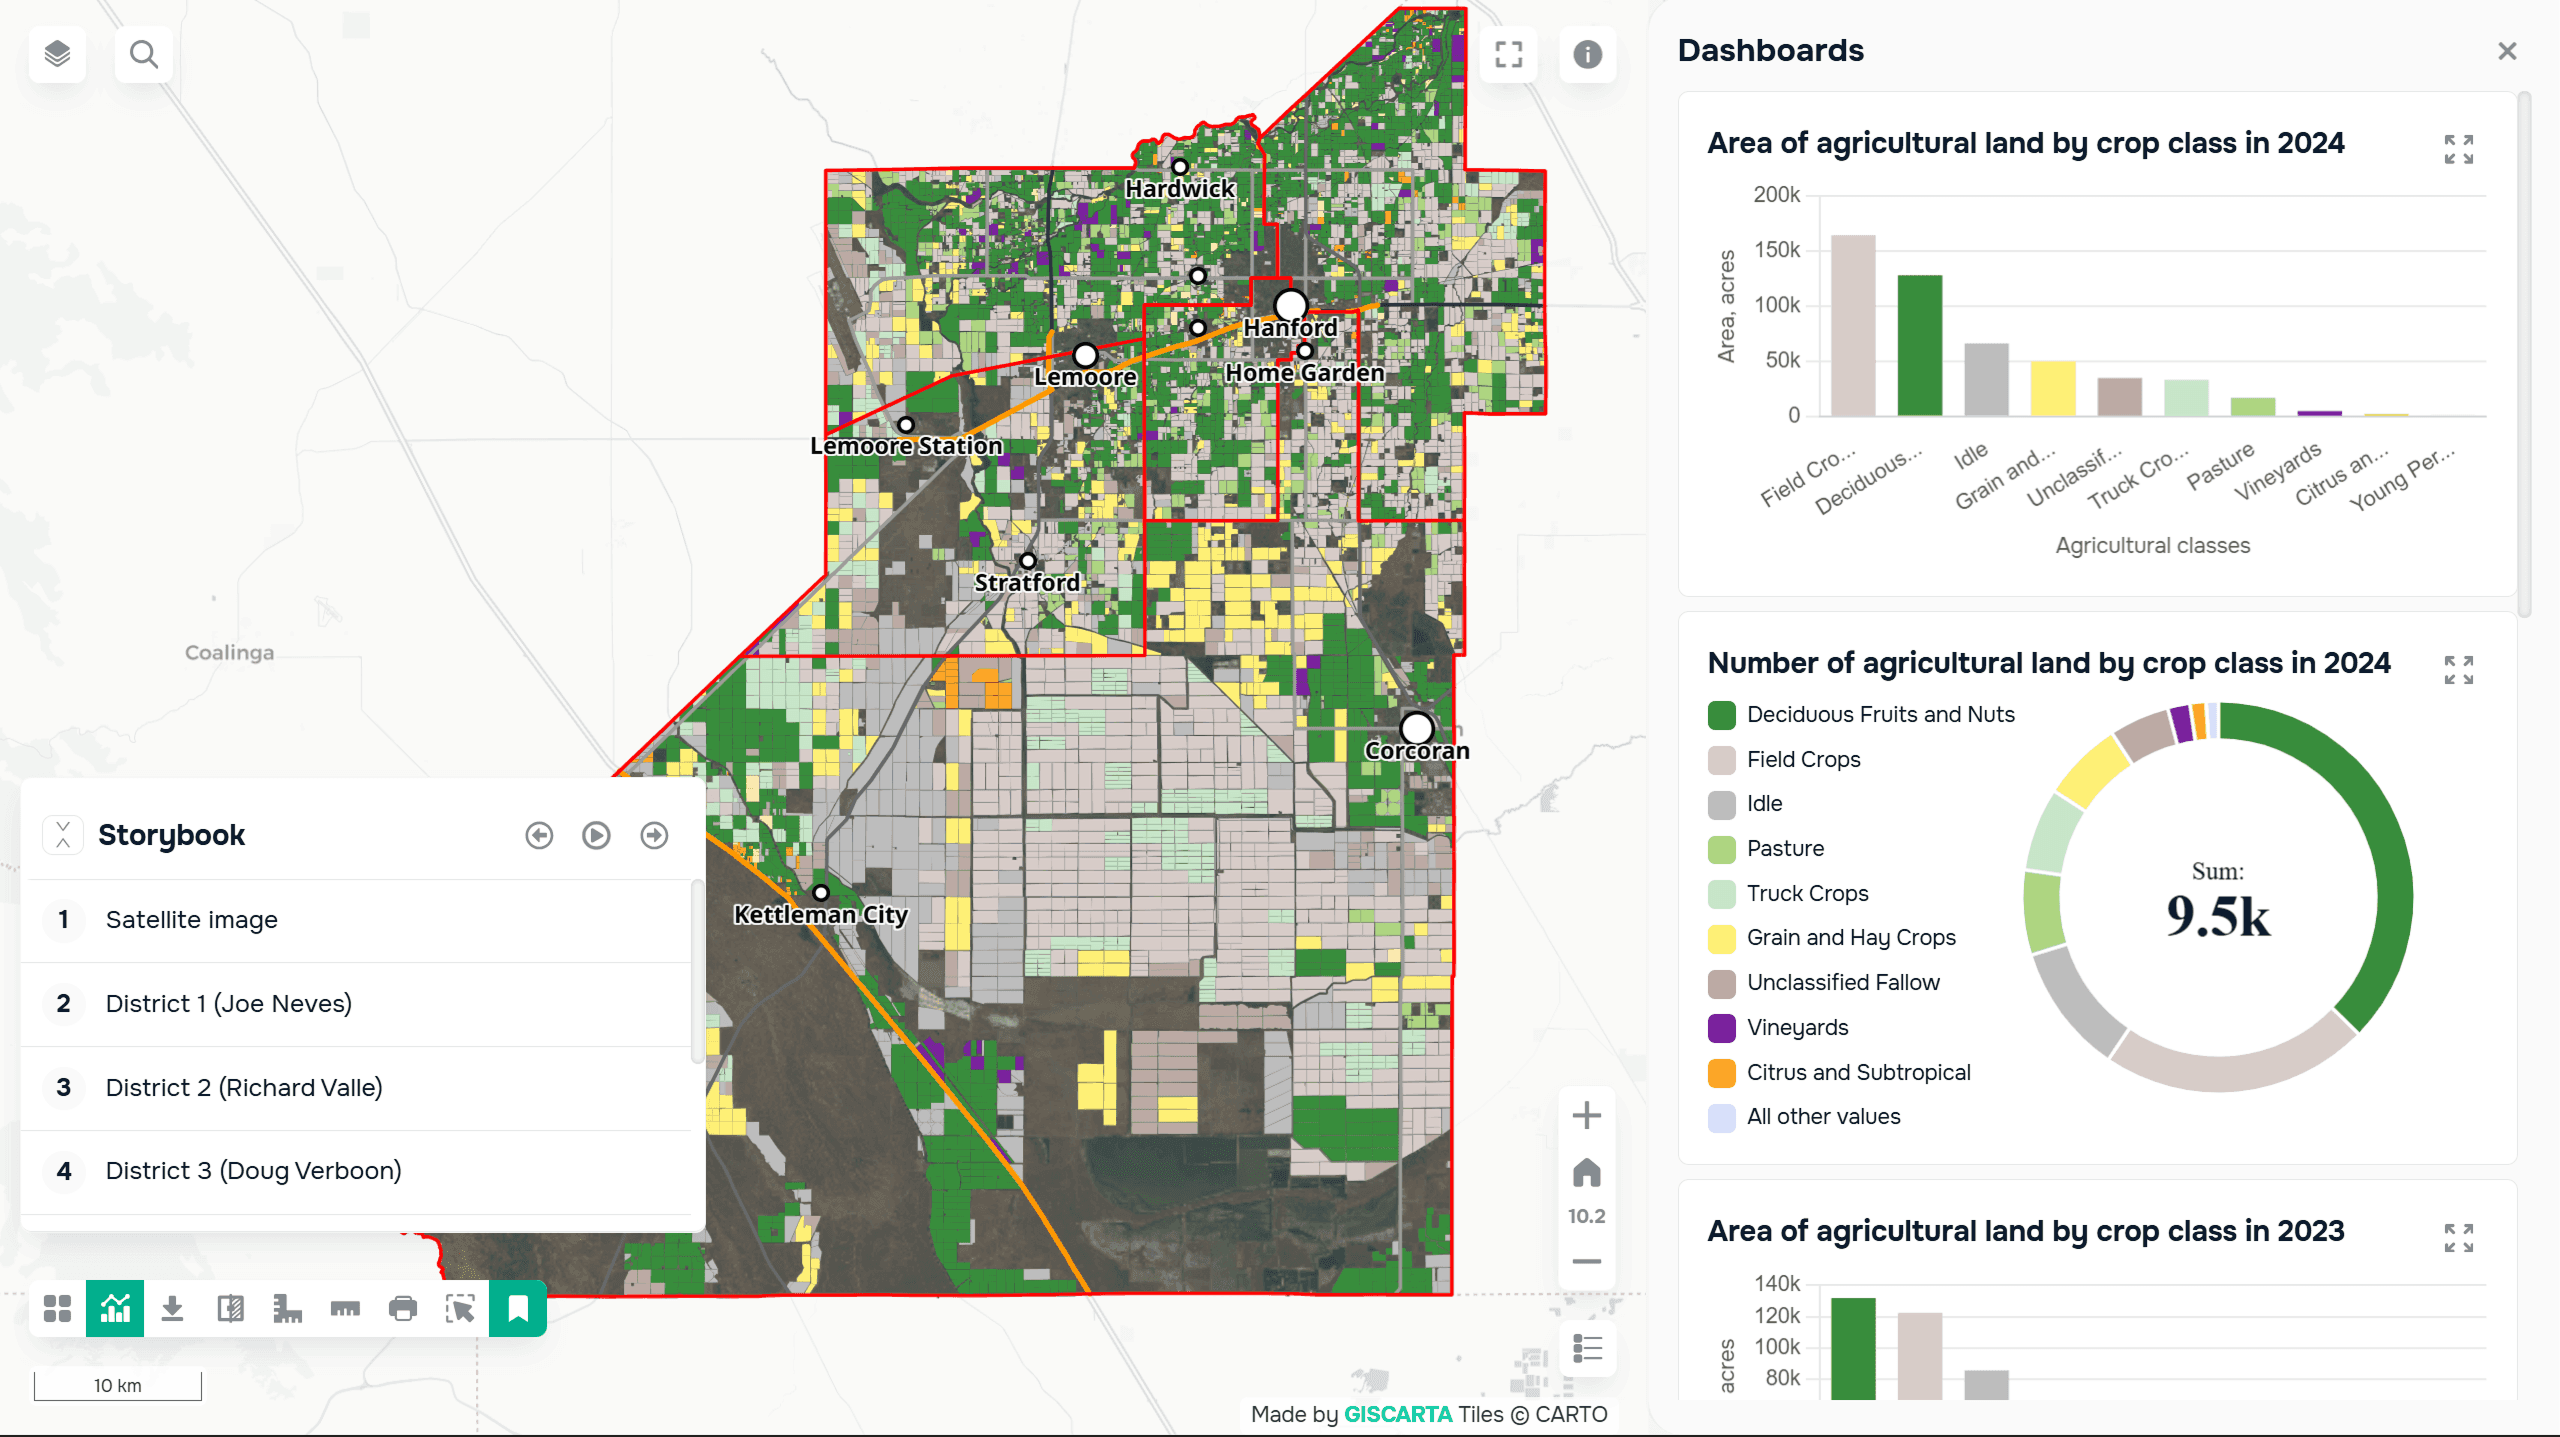
The project shows the distribution of agricultural areas and crop types. The map can be used to analyze:
agricultural land structure
crop distribution
spatial patterns in the agricultural sector
This is an example of using GIS in agriculture analytics.
Transportation and Infrastructure
Vienna POI Accessibility & Metro Coverage Map
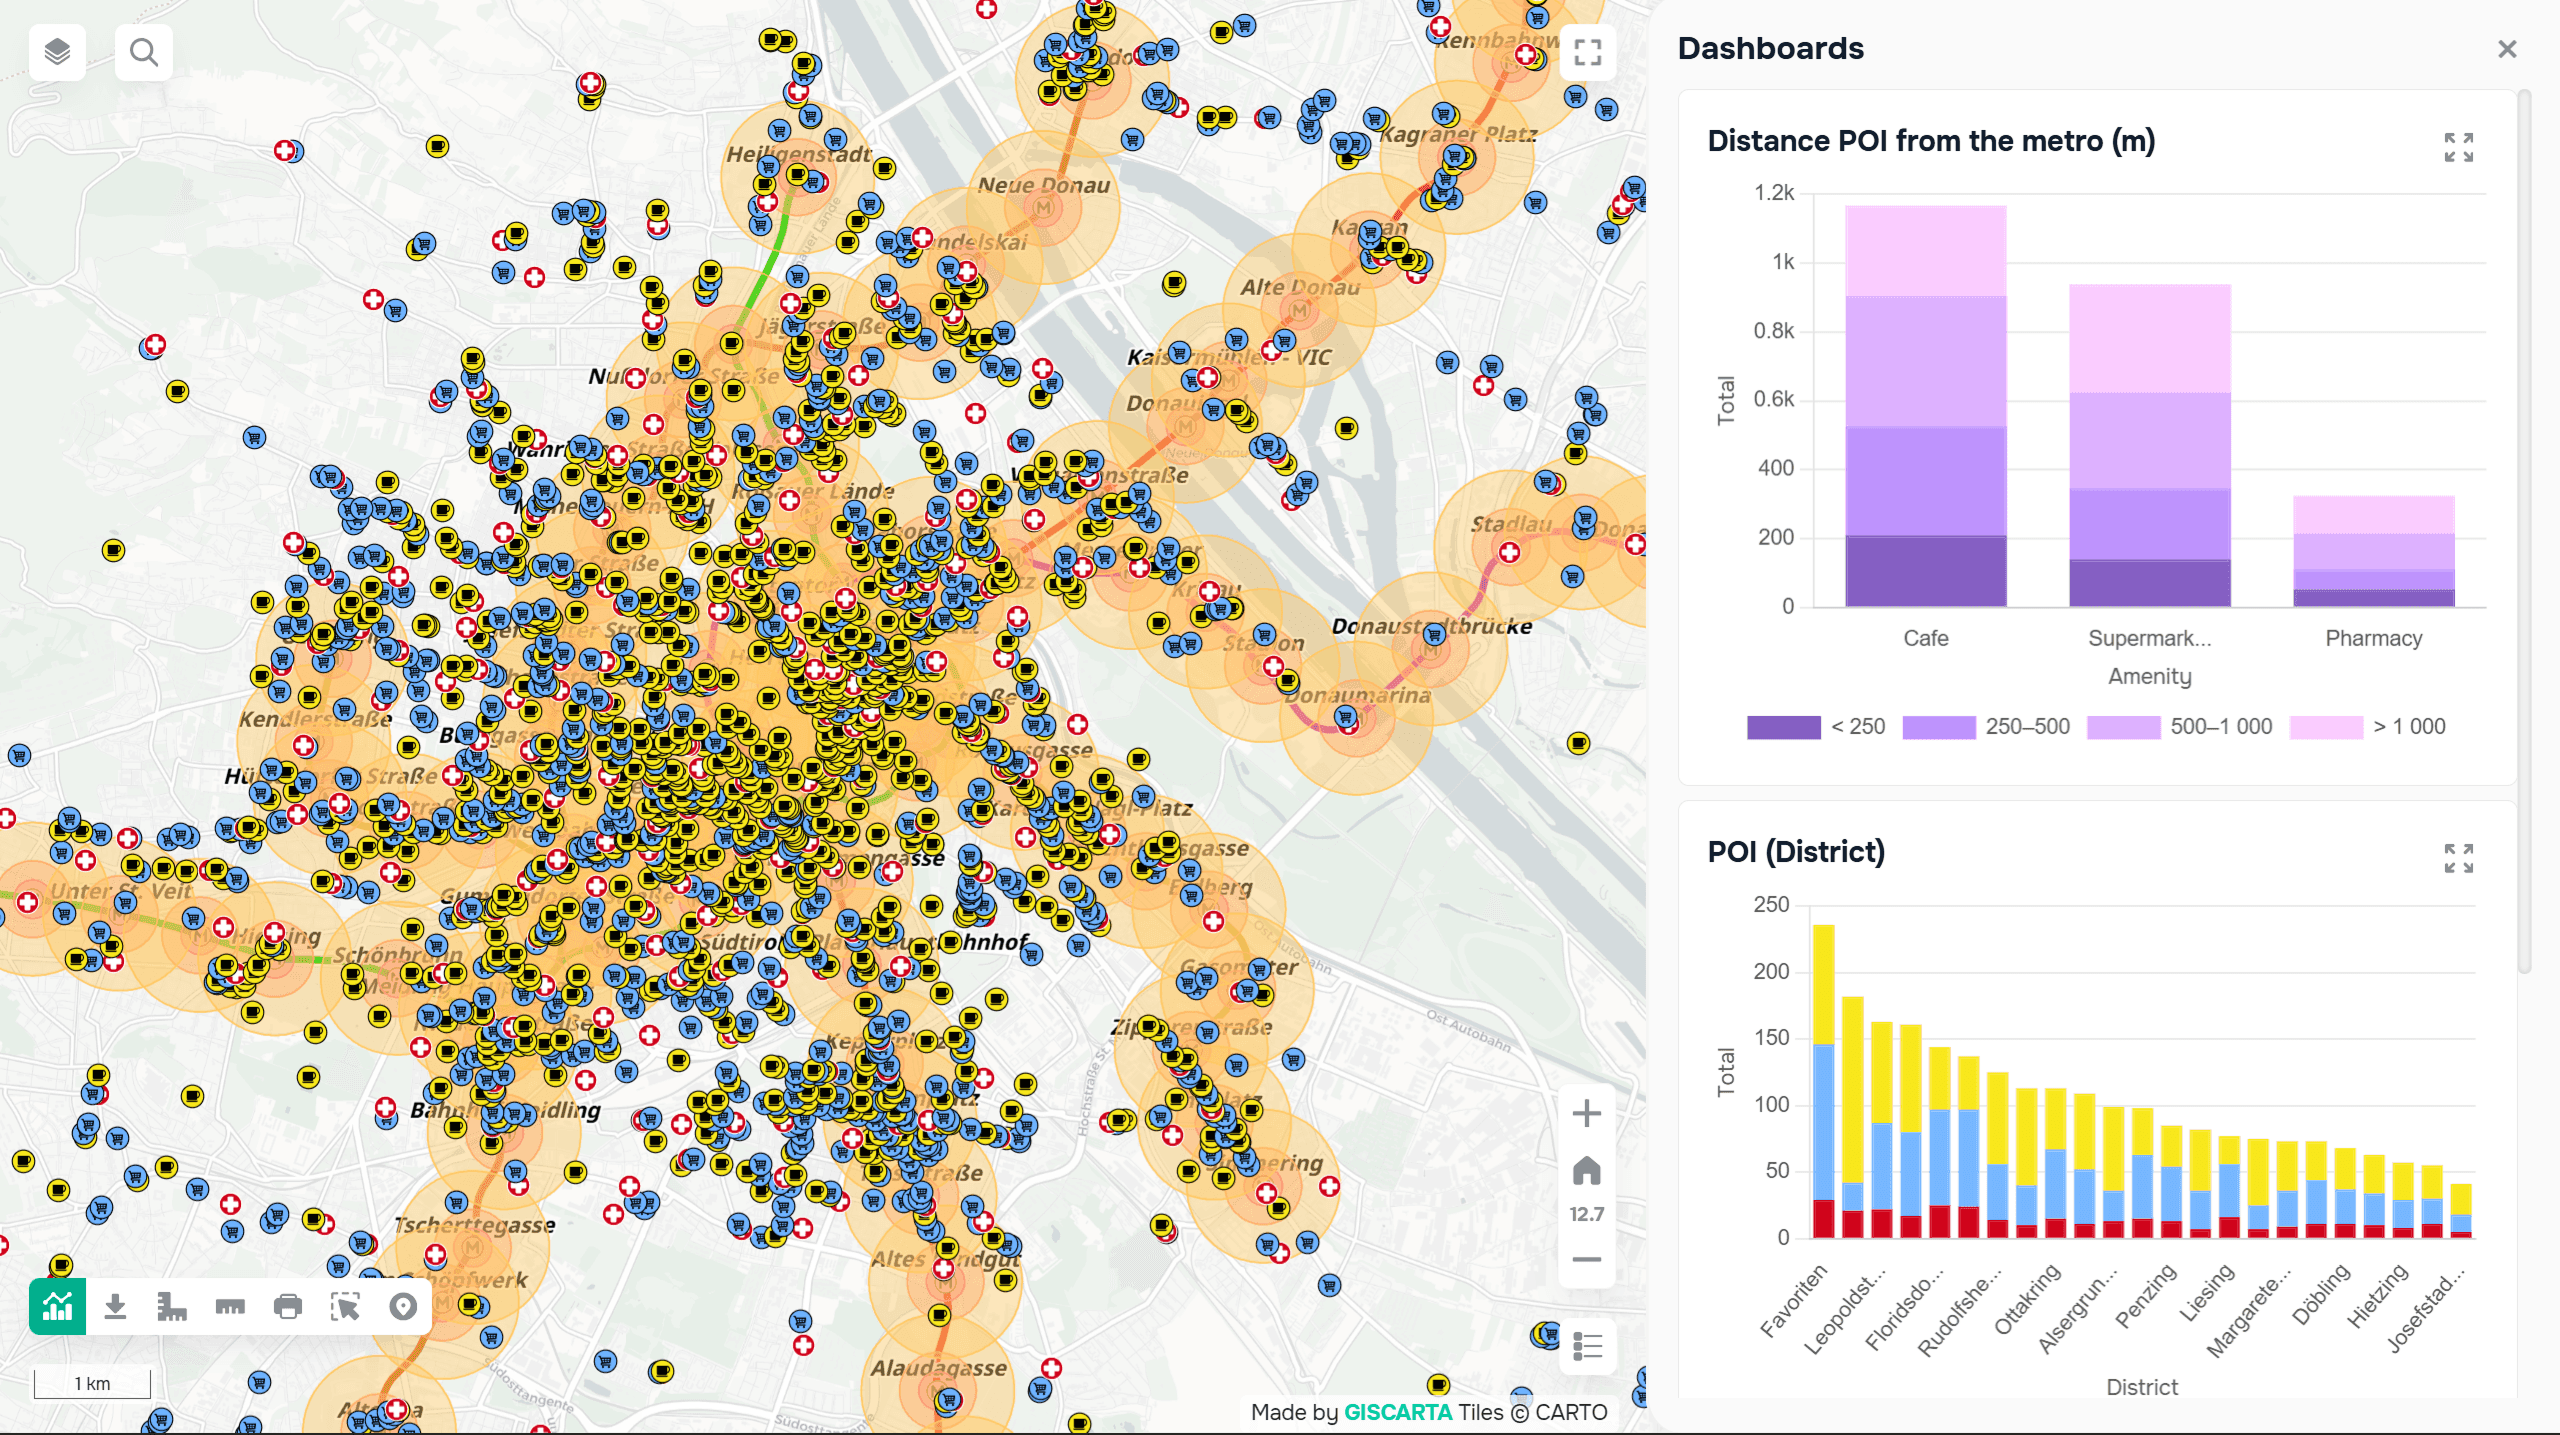
The Vienna project demonstrates the accessibility of urban infrastructure. The map displays:
metro stations
POIs
accessibility zones
transport coverage
GIS can be used to quickly identify areas with high or low transport accessibility.
Ecology, Climate, and Emergencies
Australia Rainfall & Climate Analysis Map
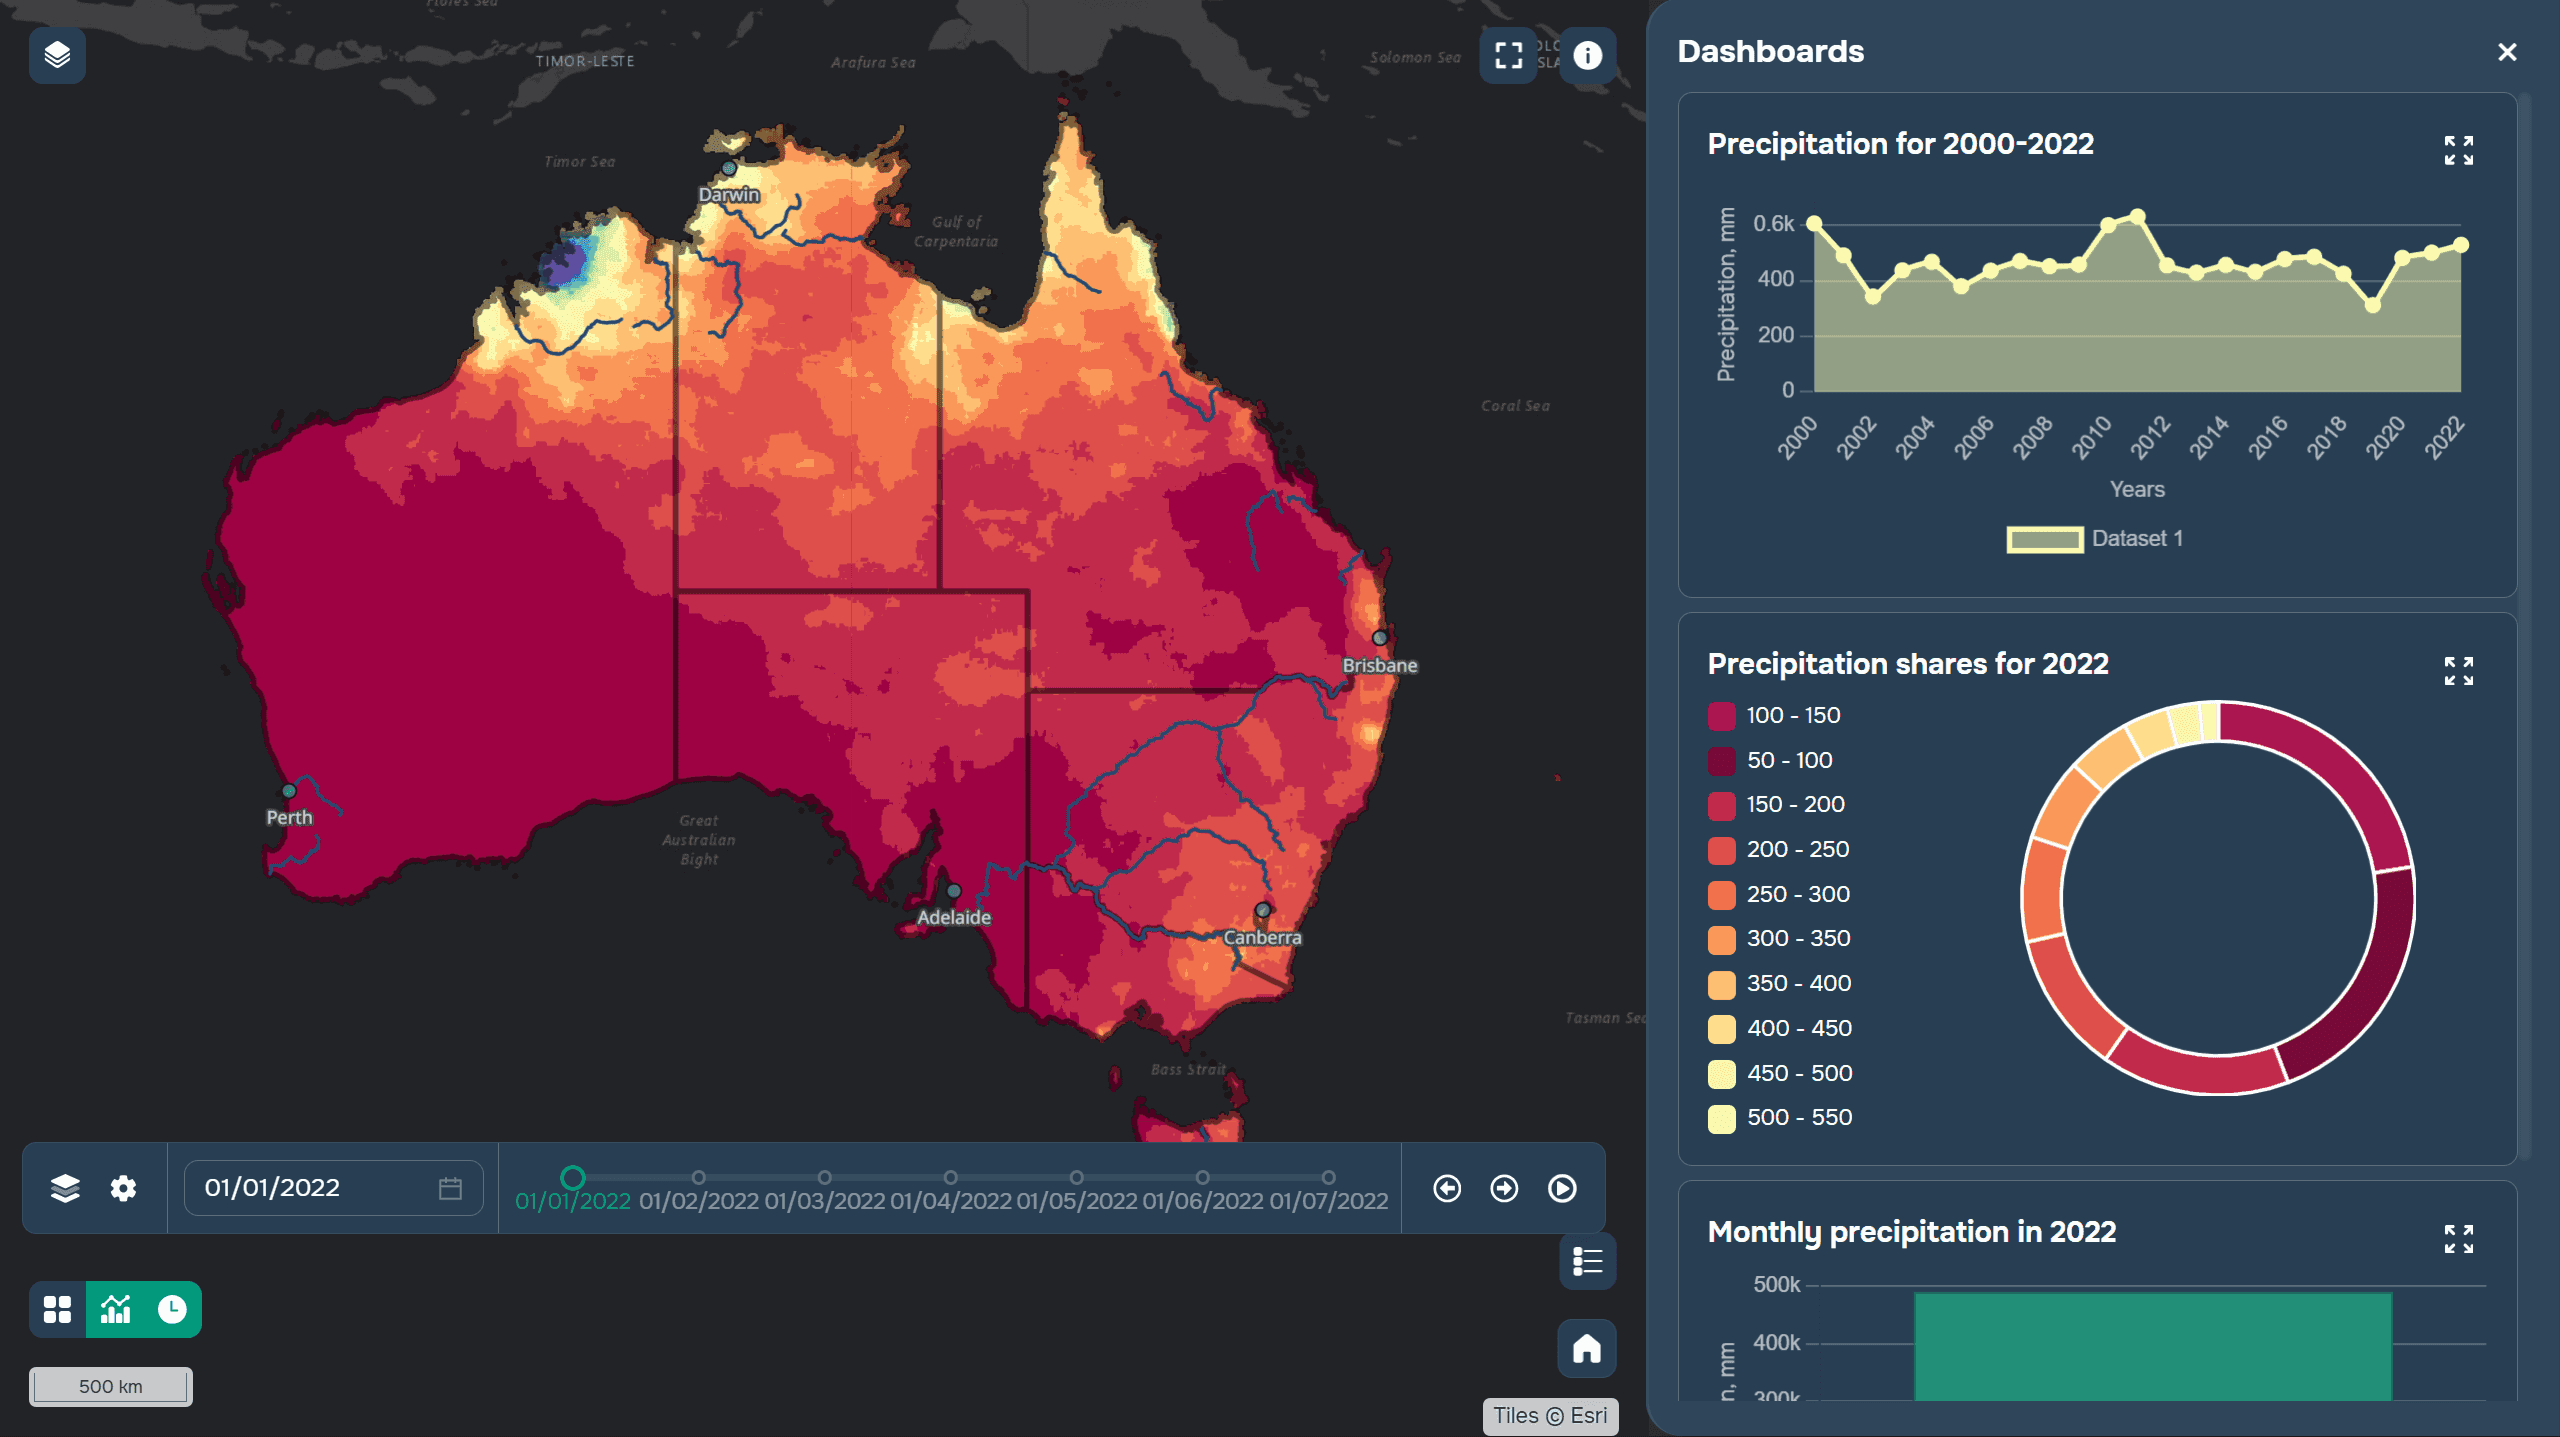
This Australian project focuses on climate data and precipitation analysis. The map allows for the study of:
precipitation distribution
climatic zones
spatial climate patterns
Such projects are actively used in environmental analytics.
Hawaii Disaster Response & Hazard Zones
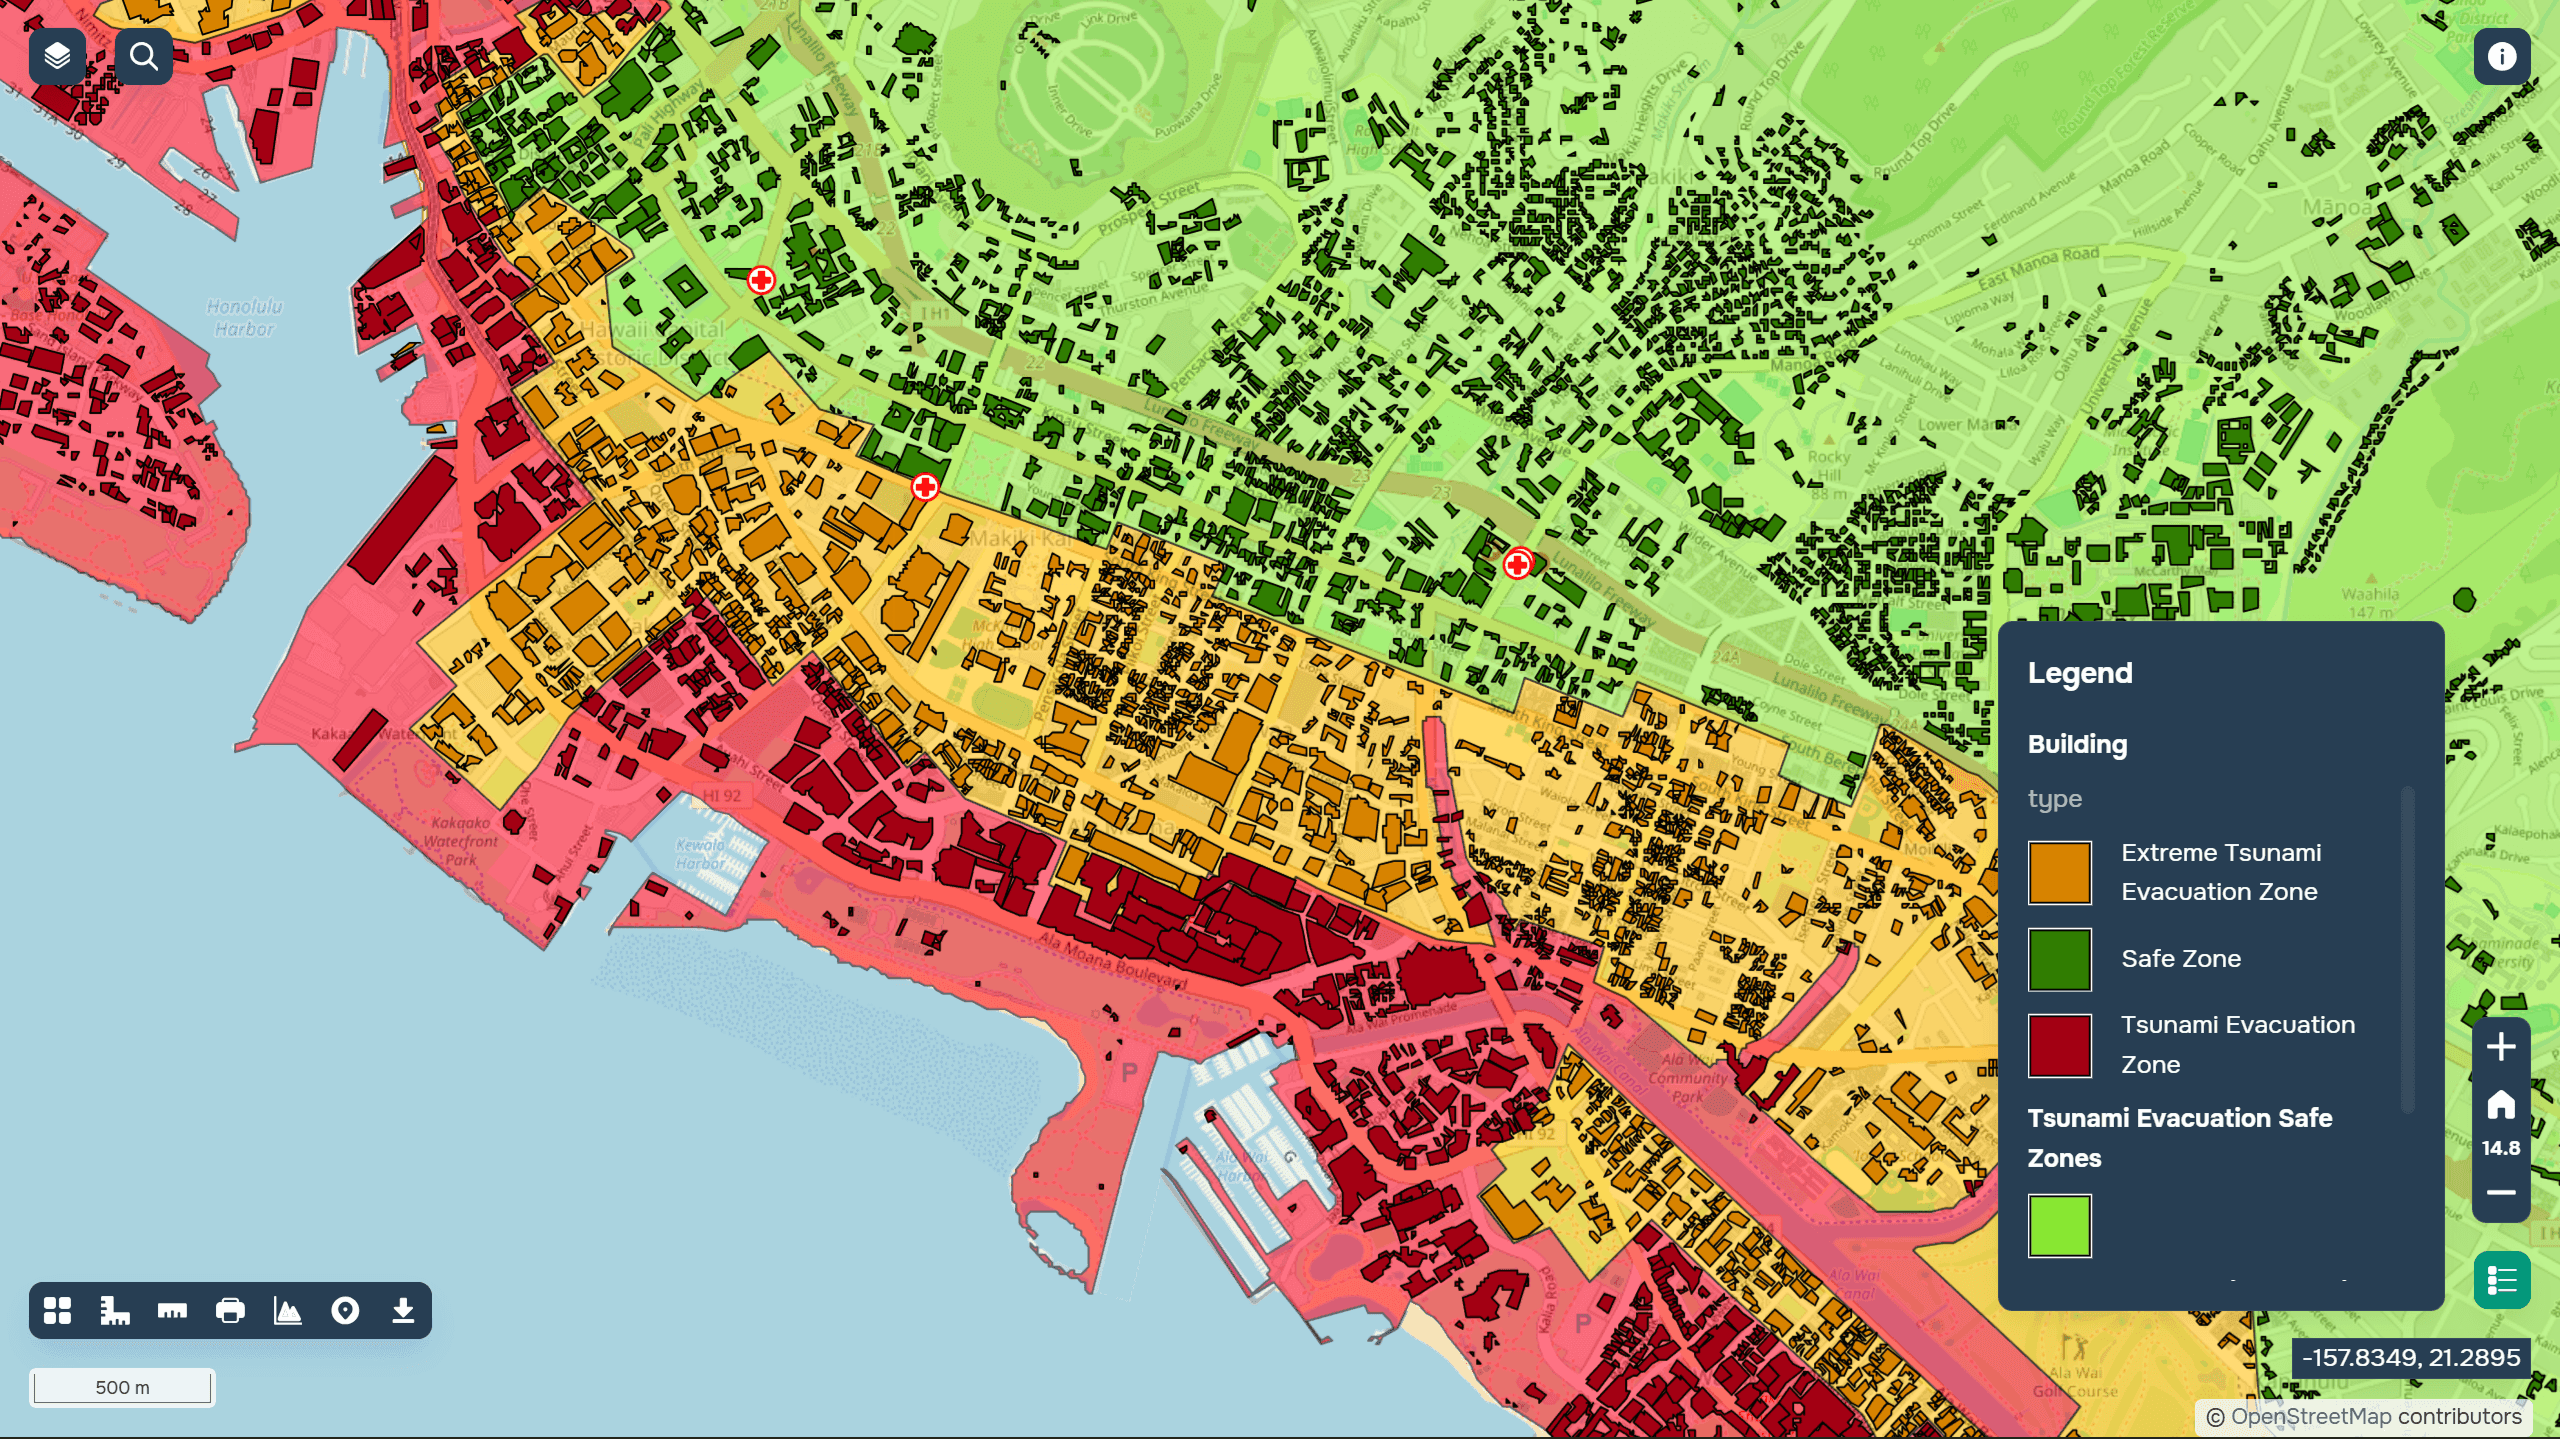
The Hawaii project displays risk zones and data for emergency management. The map shows:
hazard zones
potential risks
impact areas
This is an example of using GIS for disaster response and risk analysis.
3D and terrain visualization
Chicago 3D Building Typology Map
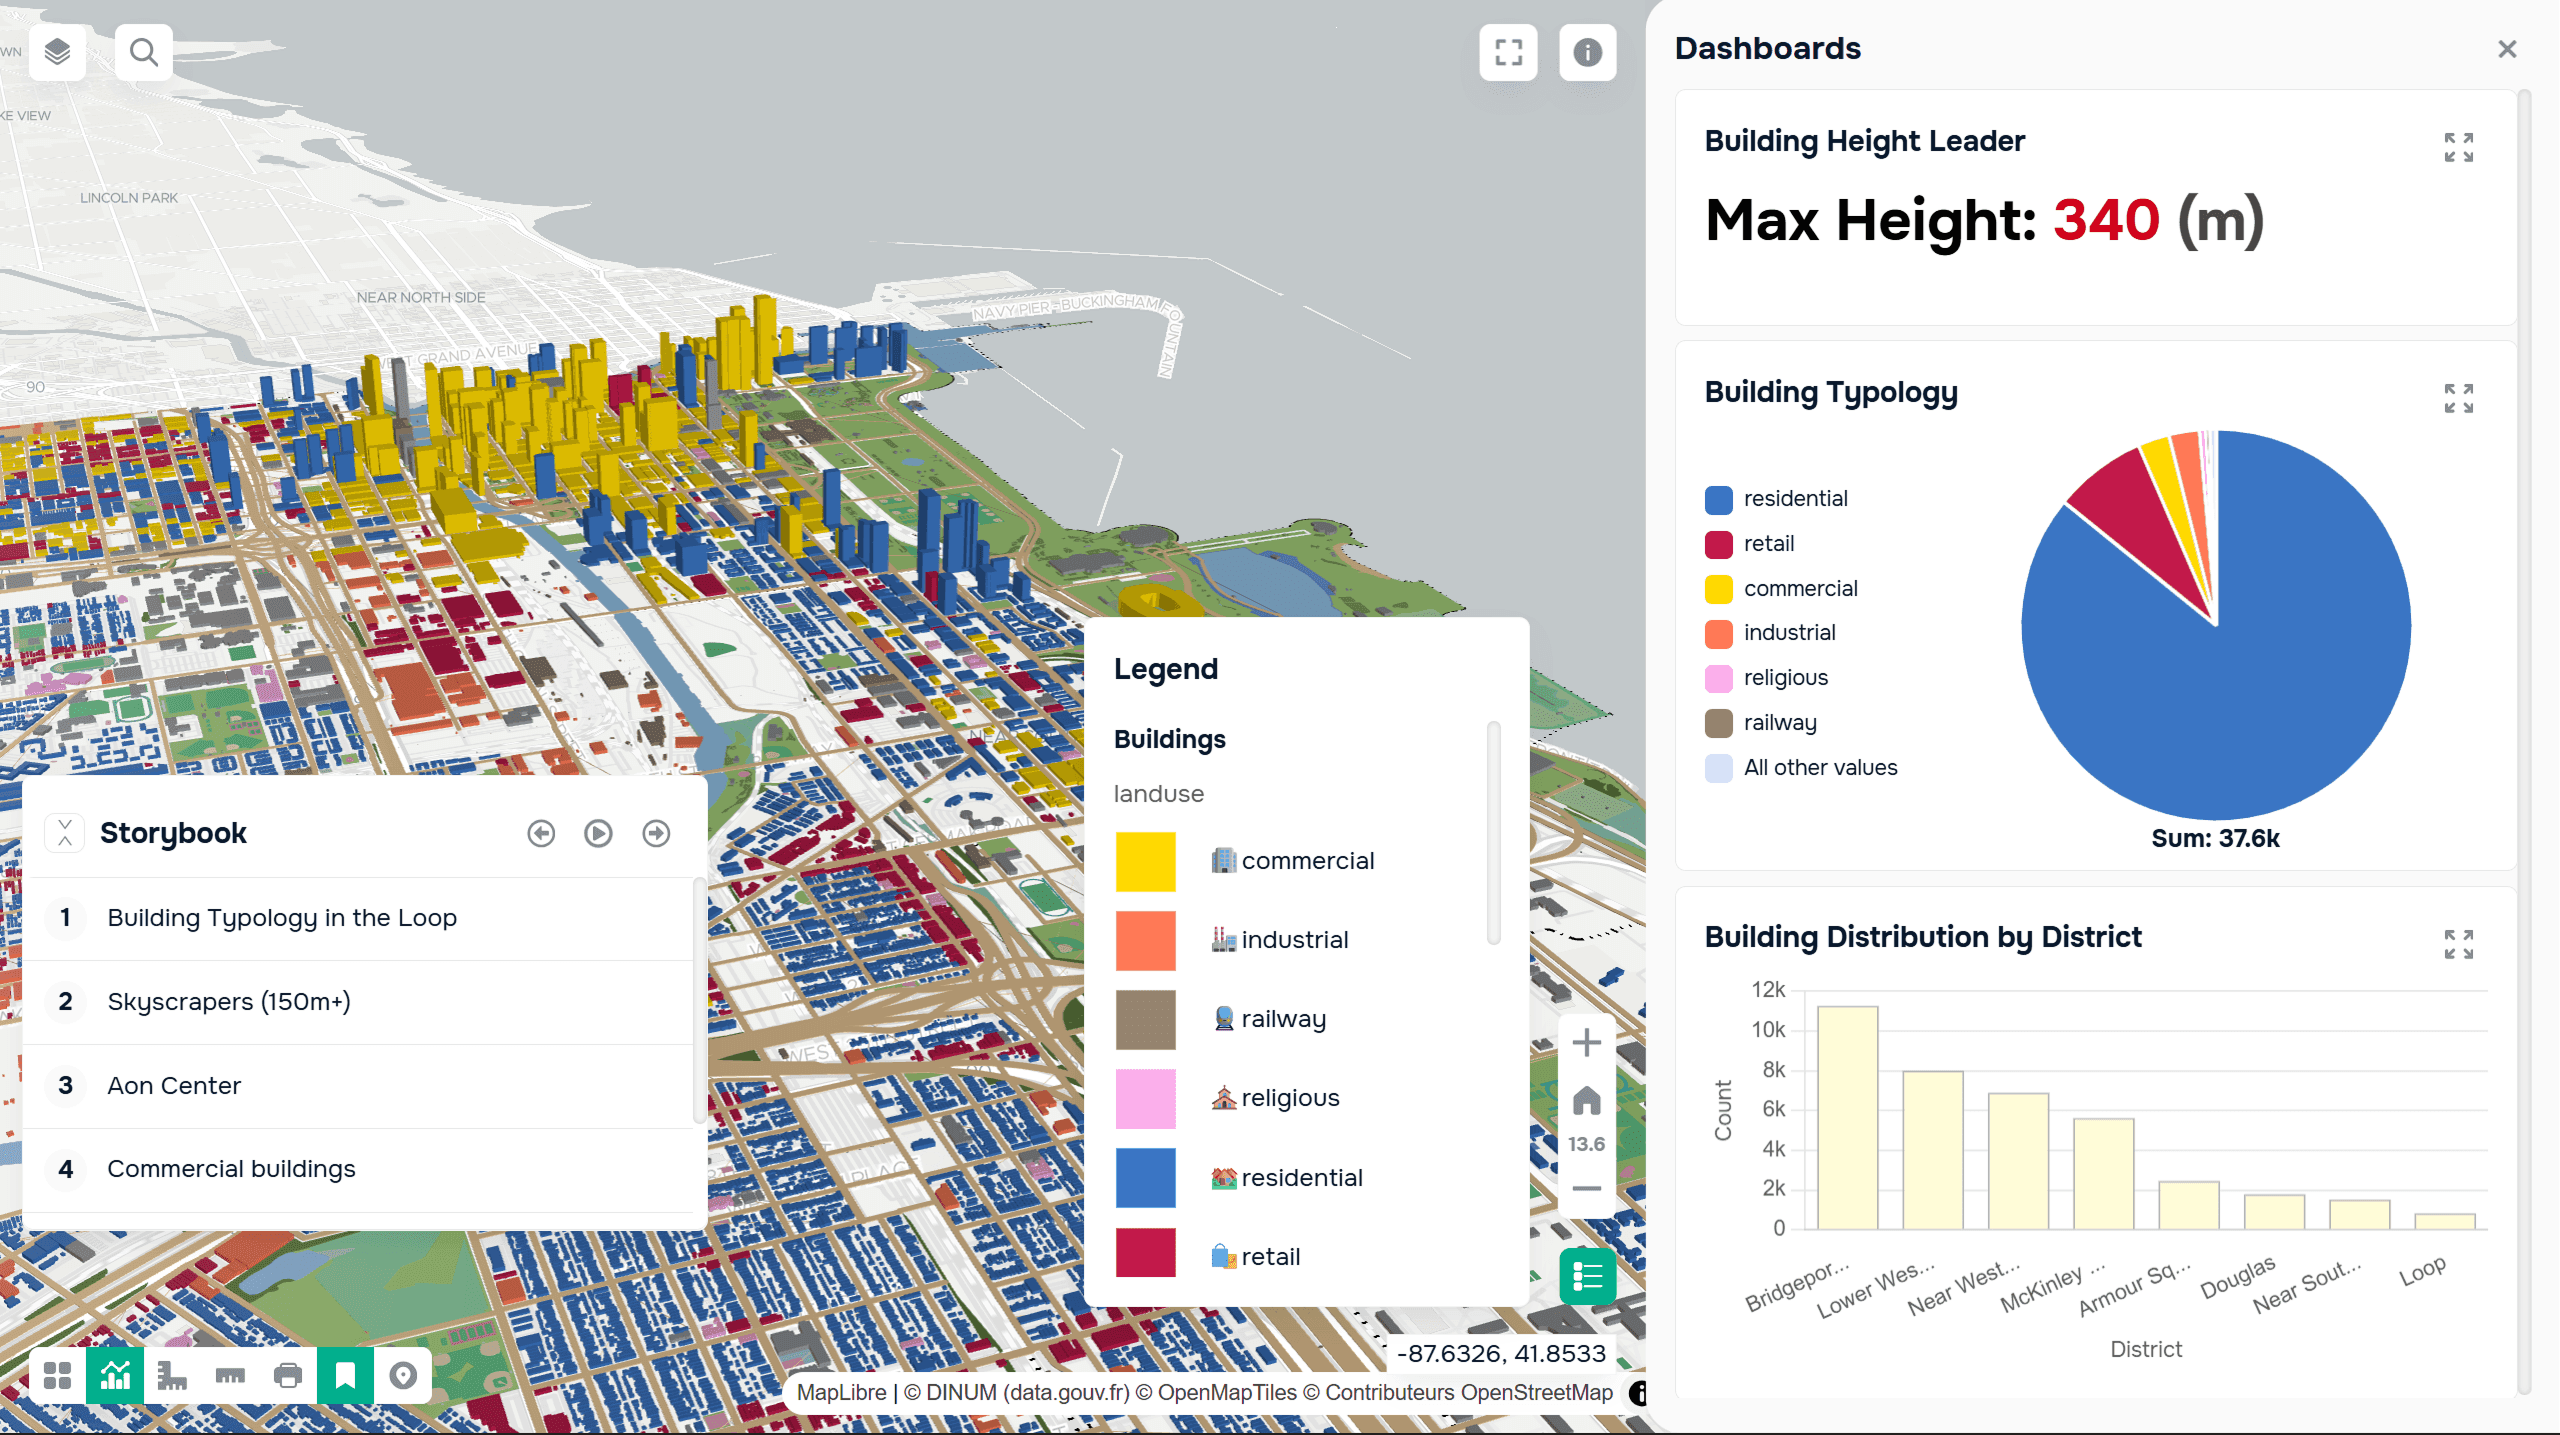
The Chicago project displays urban typology in 3D. These maps allow you to:
analyze building density
assess urban morphology
visualize urban structure
Storytelling and custom GIS projects
Interactive Map of Middle-Earth
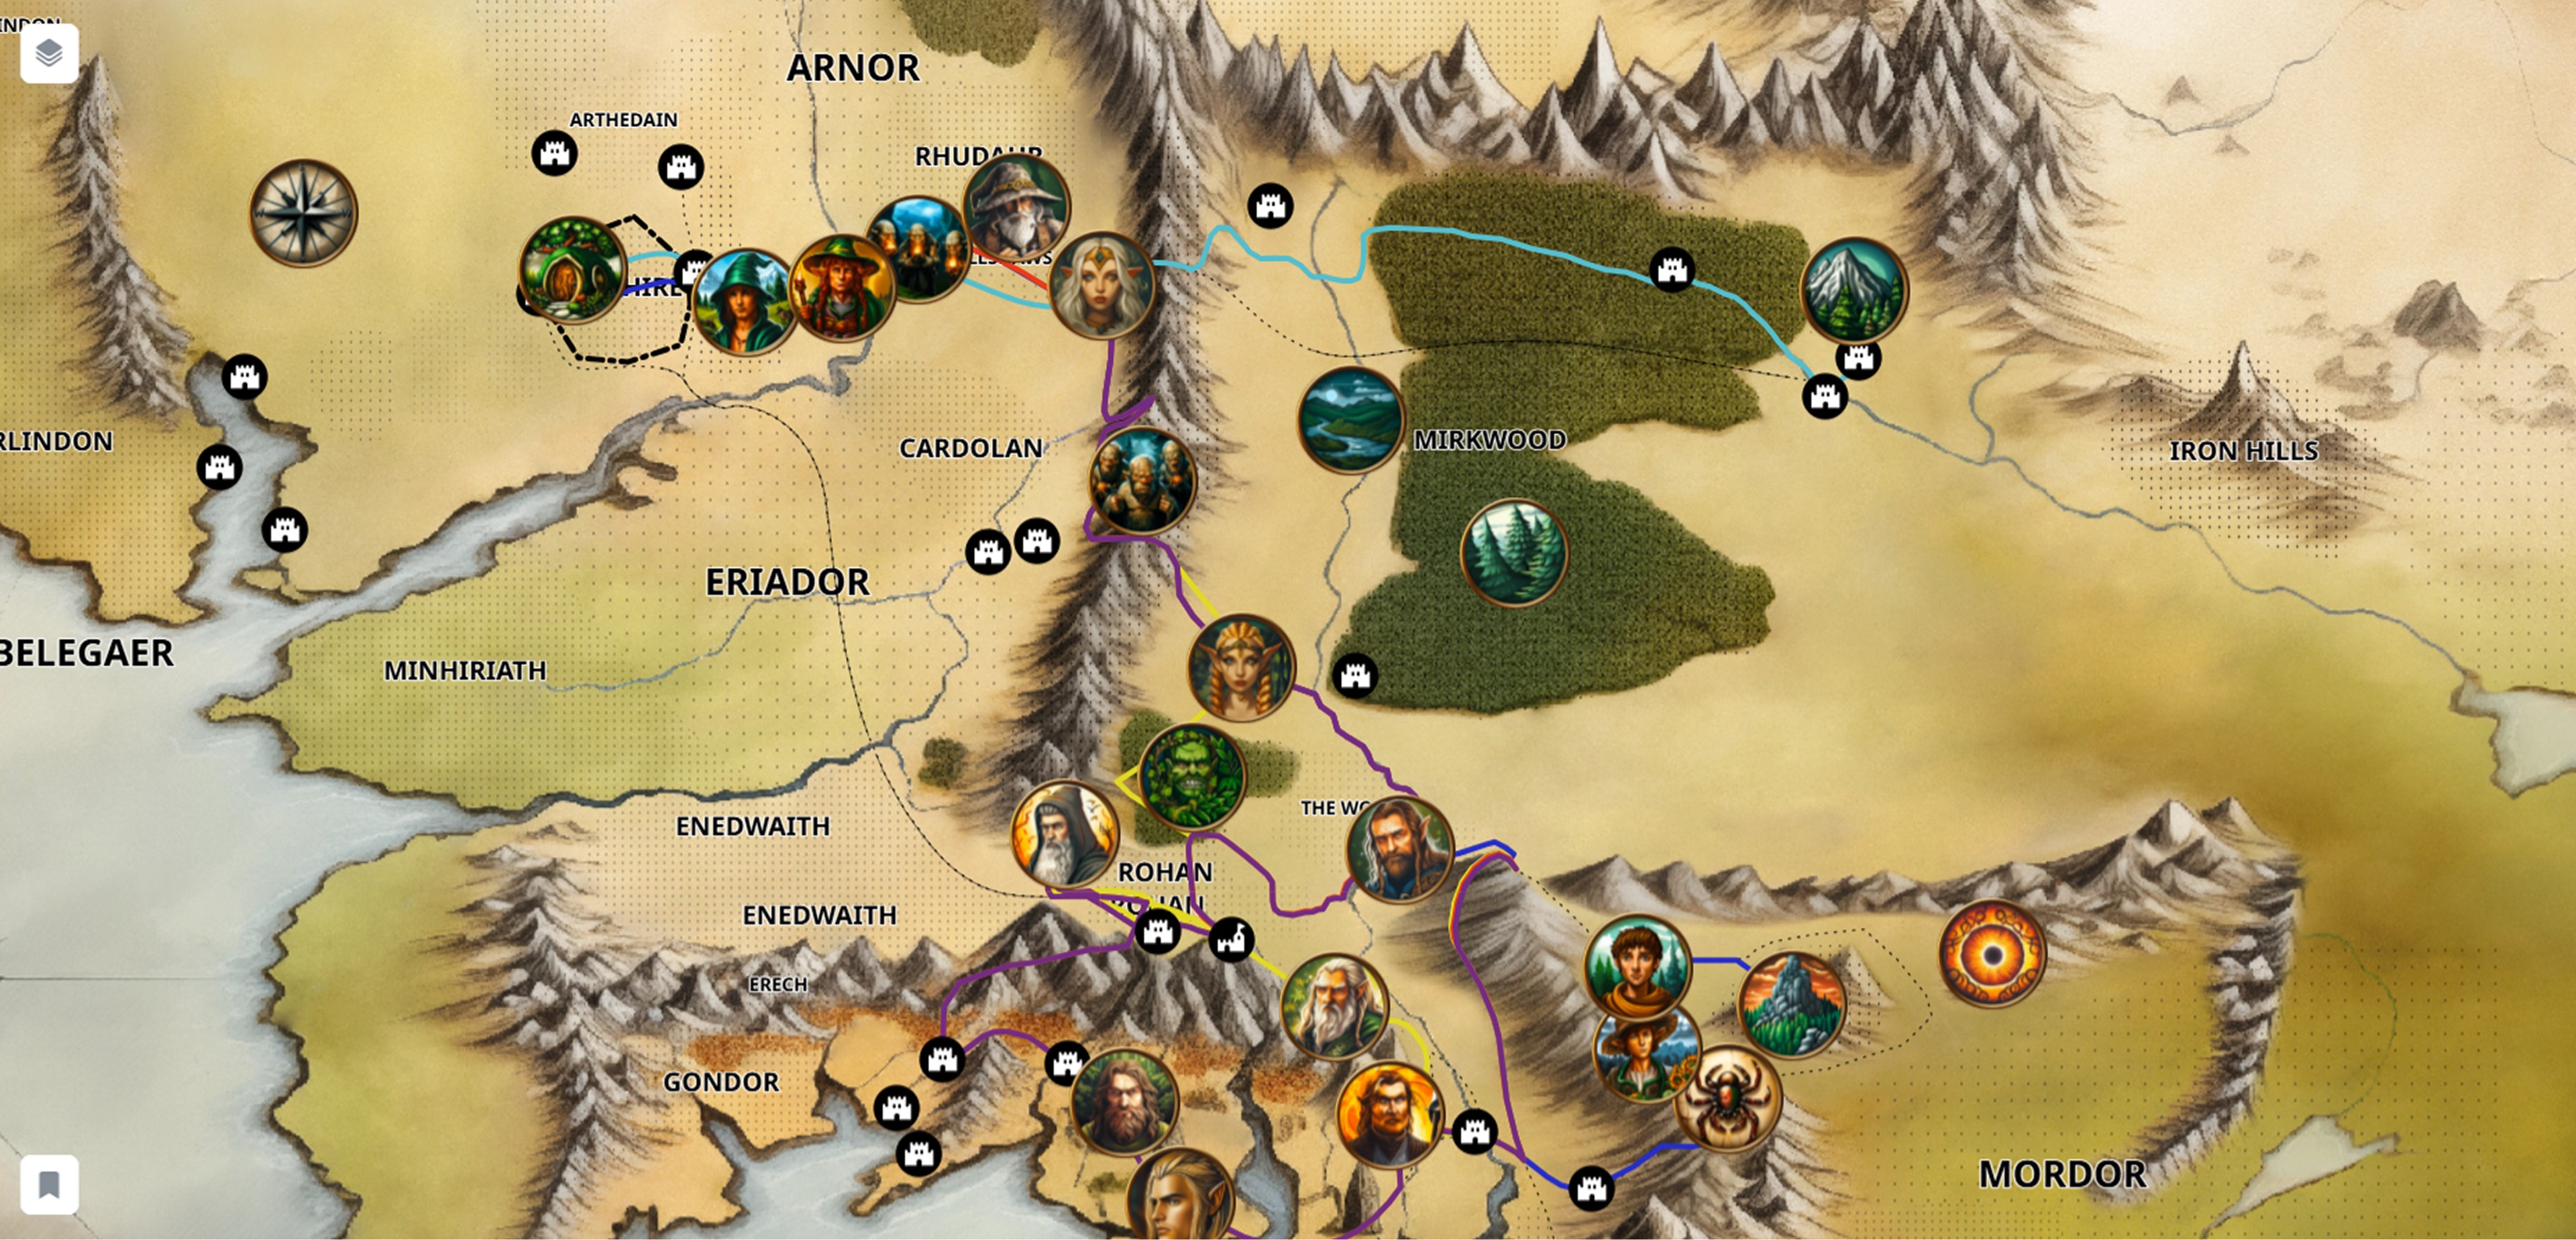
One of the gallery's most unusual projects is an interactive map of Middle-earth. This project demonstrates that GIS can be used not only for real-world data but also for fantasy world building. The map combines:
interactive navigation
stylized cartography
storytelling elements
Such projects clearly demonstrate the flexibility of modern web GIS platforms.
Why explore the Map Gallery
This section demonstrates how diverse GIS projects can be. It helps:
find ideas for your own projects
learn visualization methods
understand the capabilities of web GIS
explore different approaches to spatial analysis
Furthermore, such projects make GIS more accessible to a wider audience, demonstrating that maps can be not only a technical tool but also a means of research, communication, and storytelling.


