
In real estate, space and location have always been key. The value of a property depends not only on the building itself but also on its surroundings: transportation accessibility, demographics, infrastructure, environmental conditions, and the quality of the urban environment. This is why geographic information systems (GIS) are so essential in modern real estate analysis.
GIS allows you to work not just with tables and addresses, but with spatial relationships. Instead of analyzing properties individually, you can evaluate them in the context of the city, infrastructure, and surrounding area.
A GIS project may include:
plot boundaries
transportation network
demographic indicators
zoning data
environmental restrictions
accessibility indicators
This approach allows you to discover patterns. For example, two residential complexes with identical characteristics may have completely different investment potential due to differences in transportation accessibility, population density, or surrounding infrastructure.
Data Sources for Real Estate Analysis
Various types of data are used for spatial analysis of real estate. Cadastral and administrative data contain information on property boundaries, land use types, and development regulations. This data helps determine what types of construction are permitted in a given area.
Demographic data allows for the analysis of population density, income levels, age structure, and migration. These indicators directly impact demand for housing, commercial real estate, and office space.
Infrastructure data helps assess the accessibility of facilities. Roads, metro stations, airports, schools, hospitals, and shopping centers have a significant impact on the attractiveness of an area.
Ecological data, such as flood zones, noise pollution, topography, and the presence of green spaces, are also increasingly important. These factors are important both for quality of life and for risk assessment.
By combining all this data in a GIS, a much more comprehensive picture of the area can be obtained.
Location Selection
One of the most popular GIS tasks in real estate is choosing the optimal location.
Developers and investors use spatial analysis to select sites for residential and commercial properties. Instead of subjective assessments, decisions are made based on specific indicators.
For example, when choosing a location for a shopping center, one can compare:
population density
transport accessibility
level of competition
traffic flows
infrastructure availability
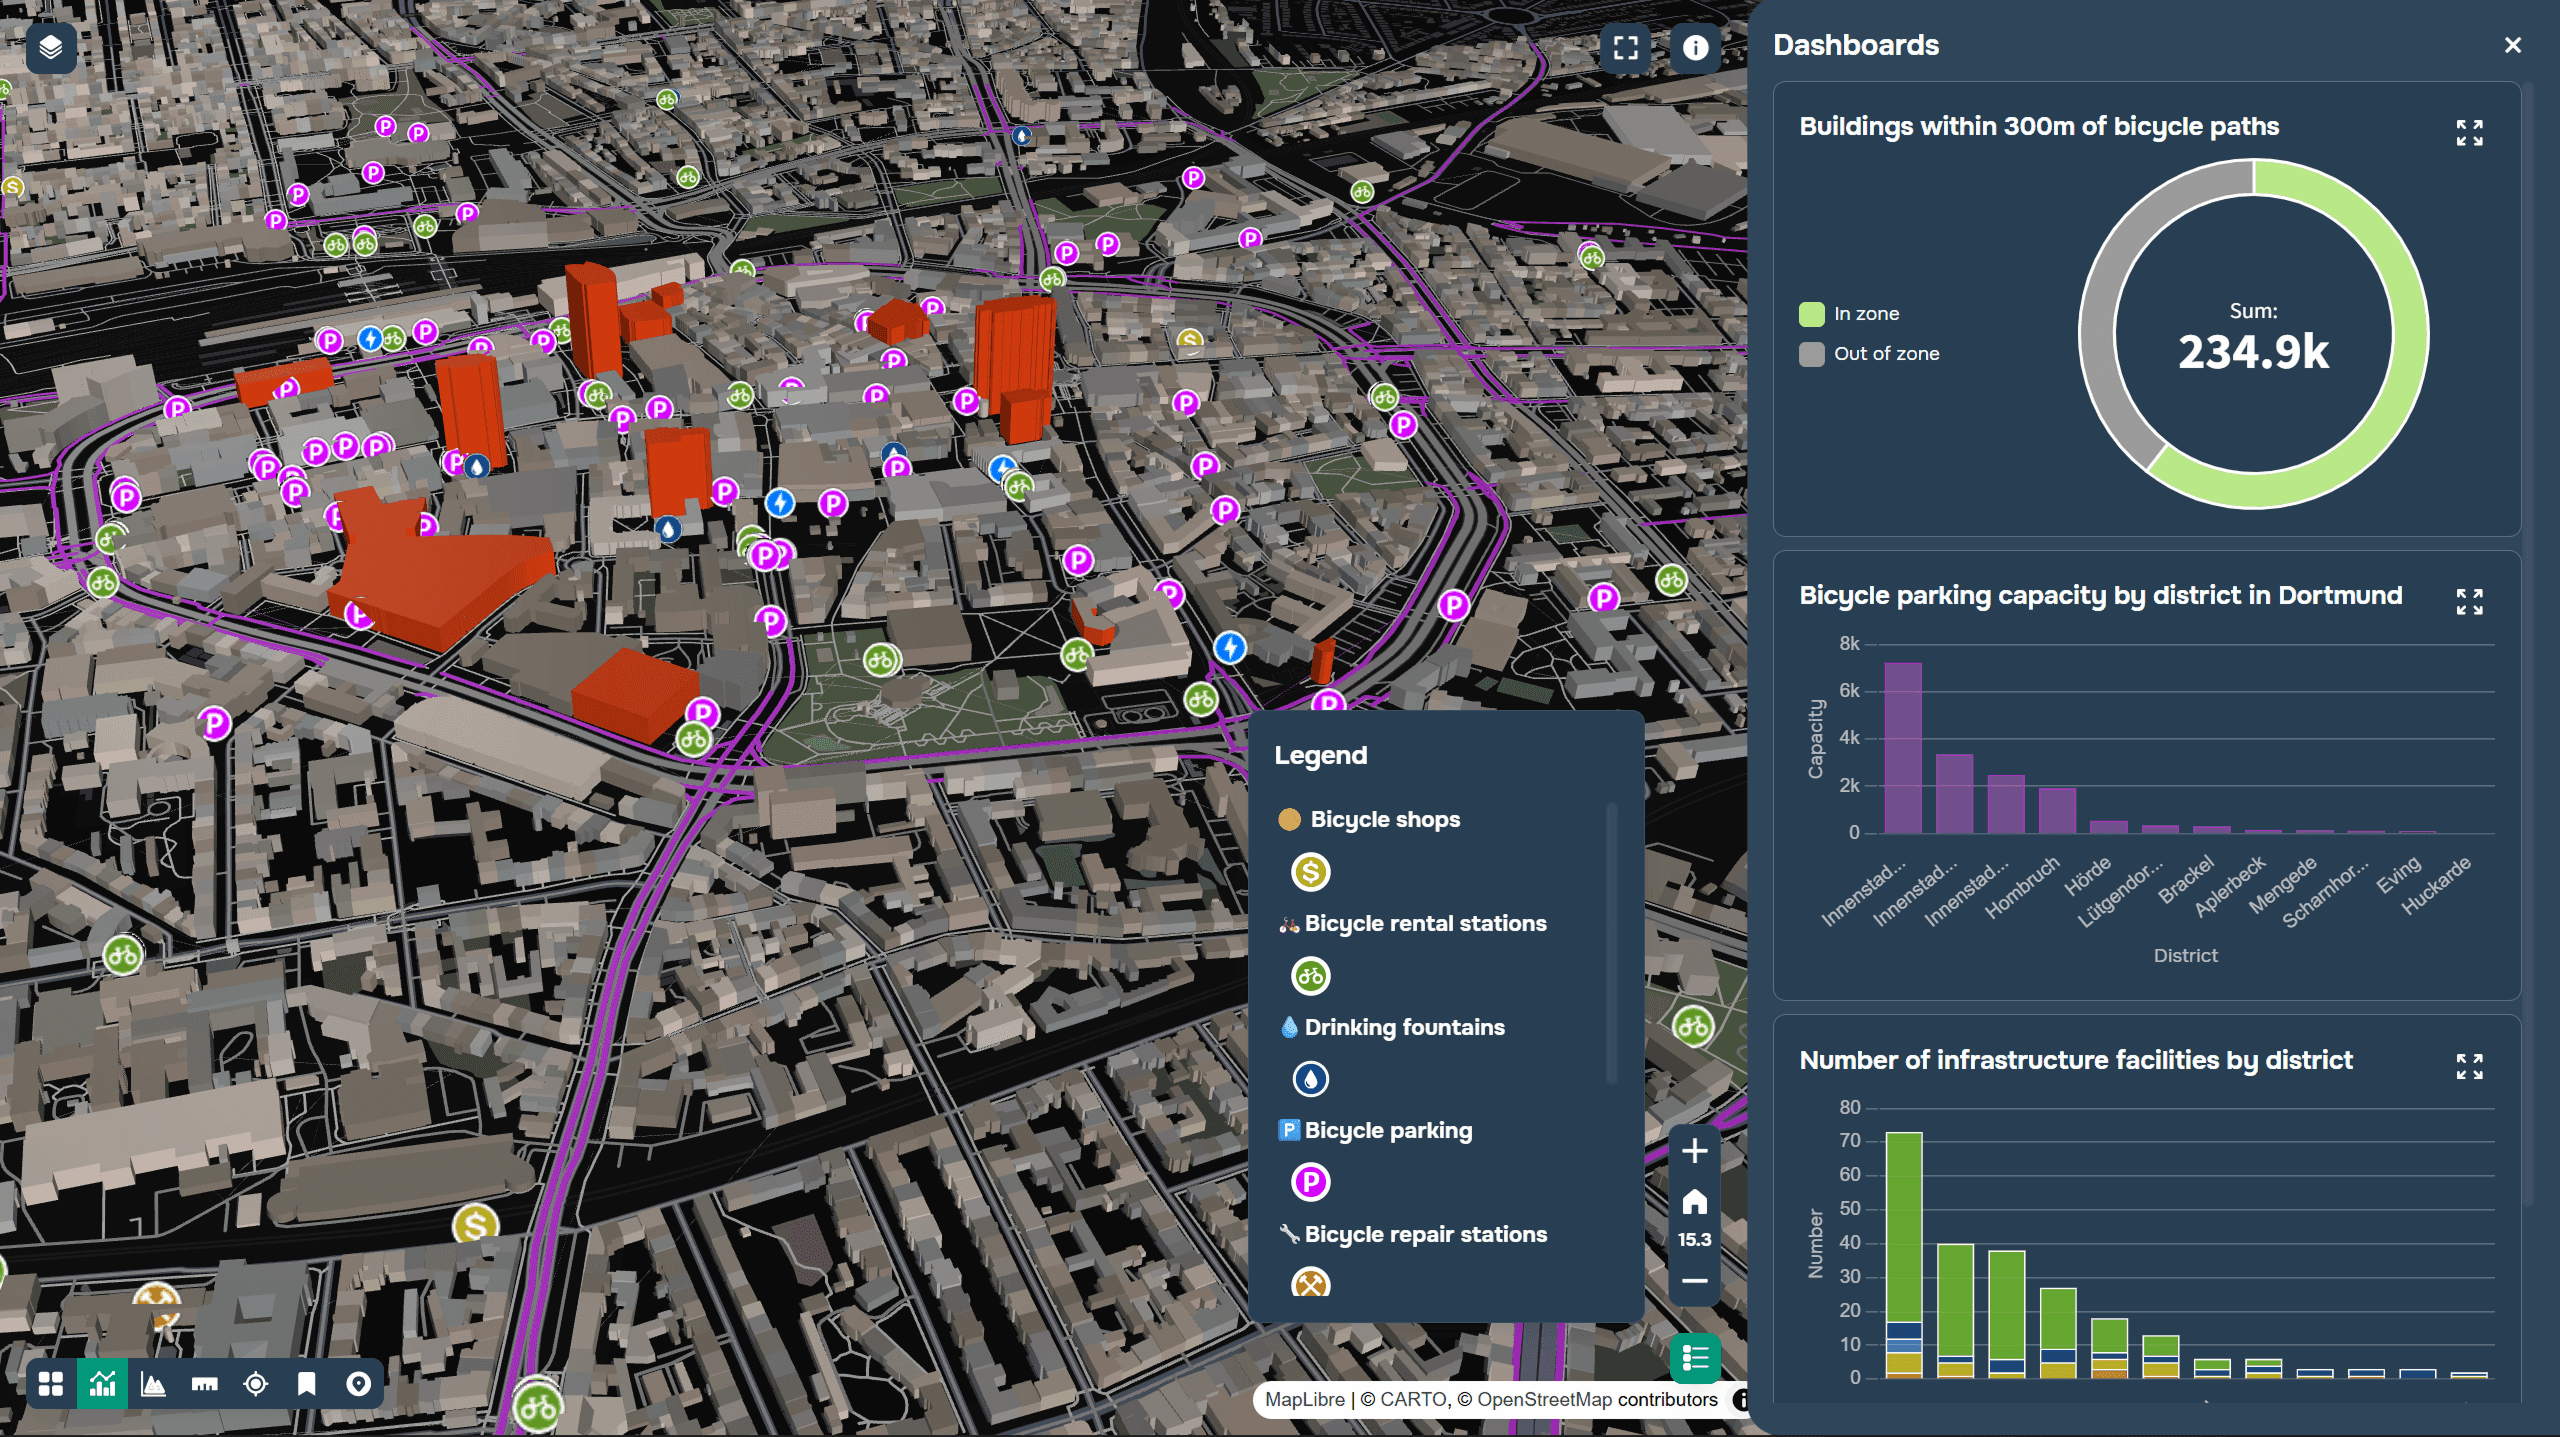
An example of a mapping project about bicycle infrastructure accessibility in Dortmund, compiled on GISCARTA. Link to the project
here.
Risk Assessment
Real estate analysis includes not only the search for promising areas but also risk assessment.
GIS help identify:
flood zones
landslide areas
environmental restrictions
complex terrain
Flood analysis is especially important for coastal and riverine areas. The use of digital elevation models allows one to identify areas with increased risk.
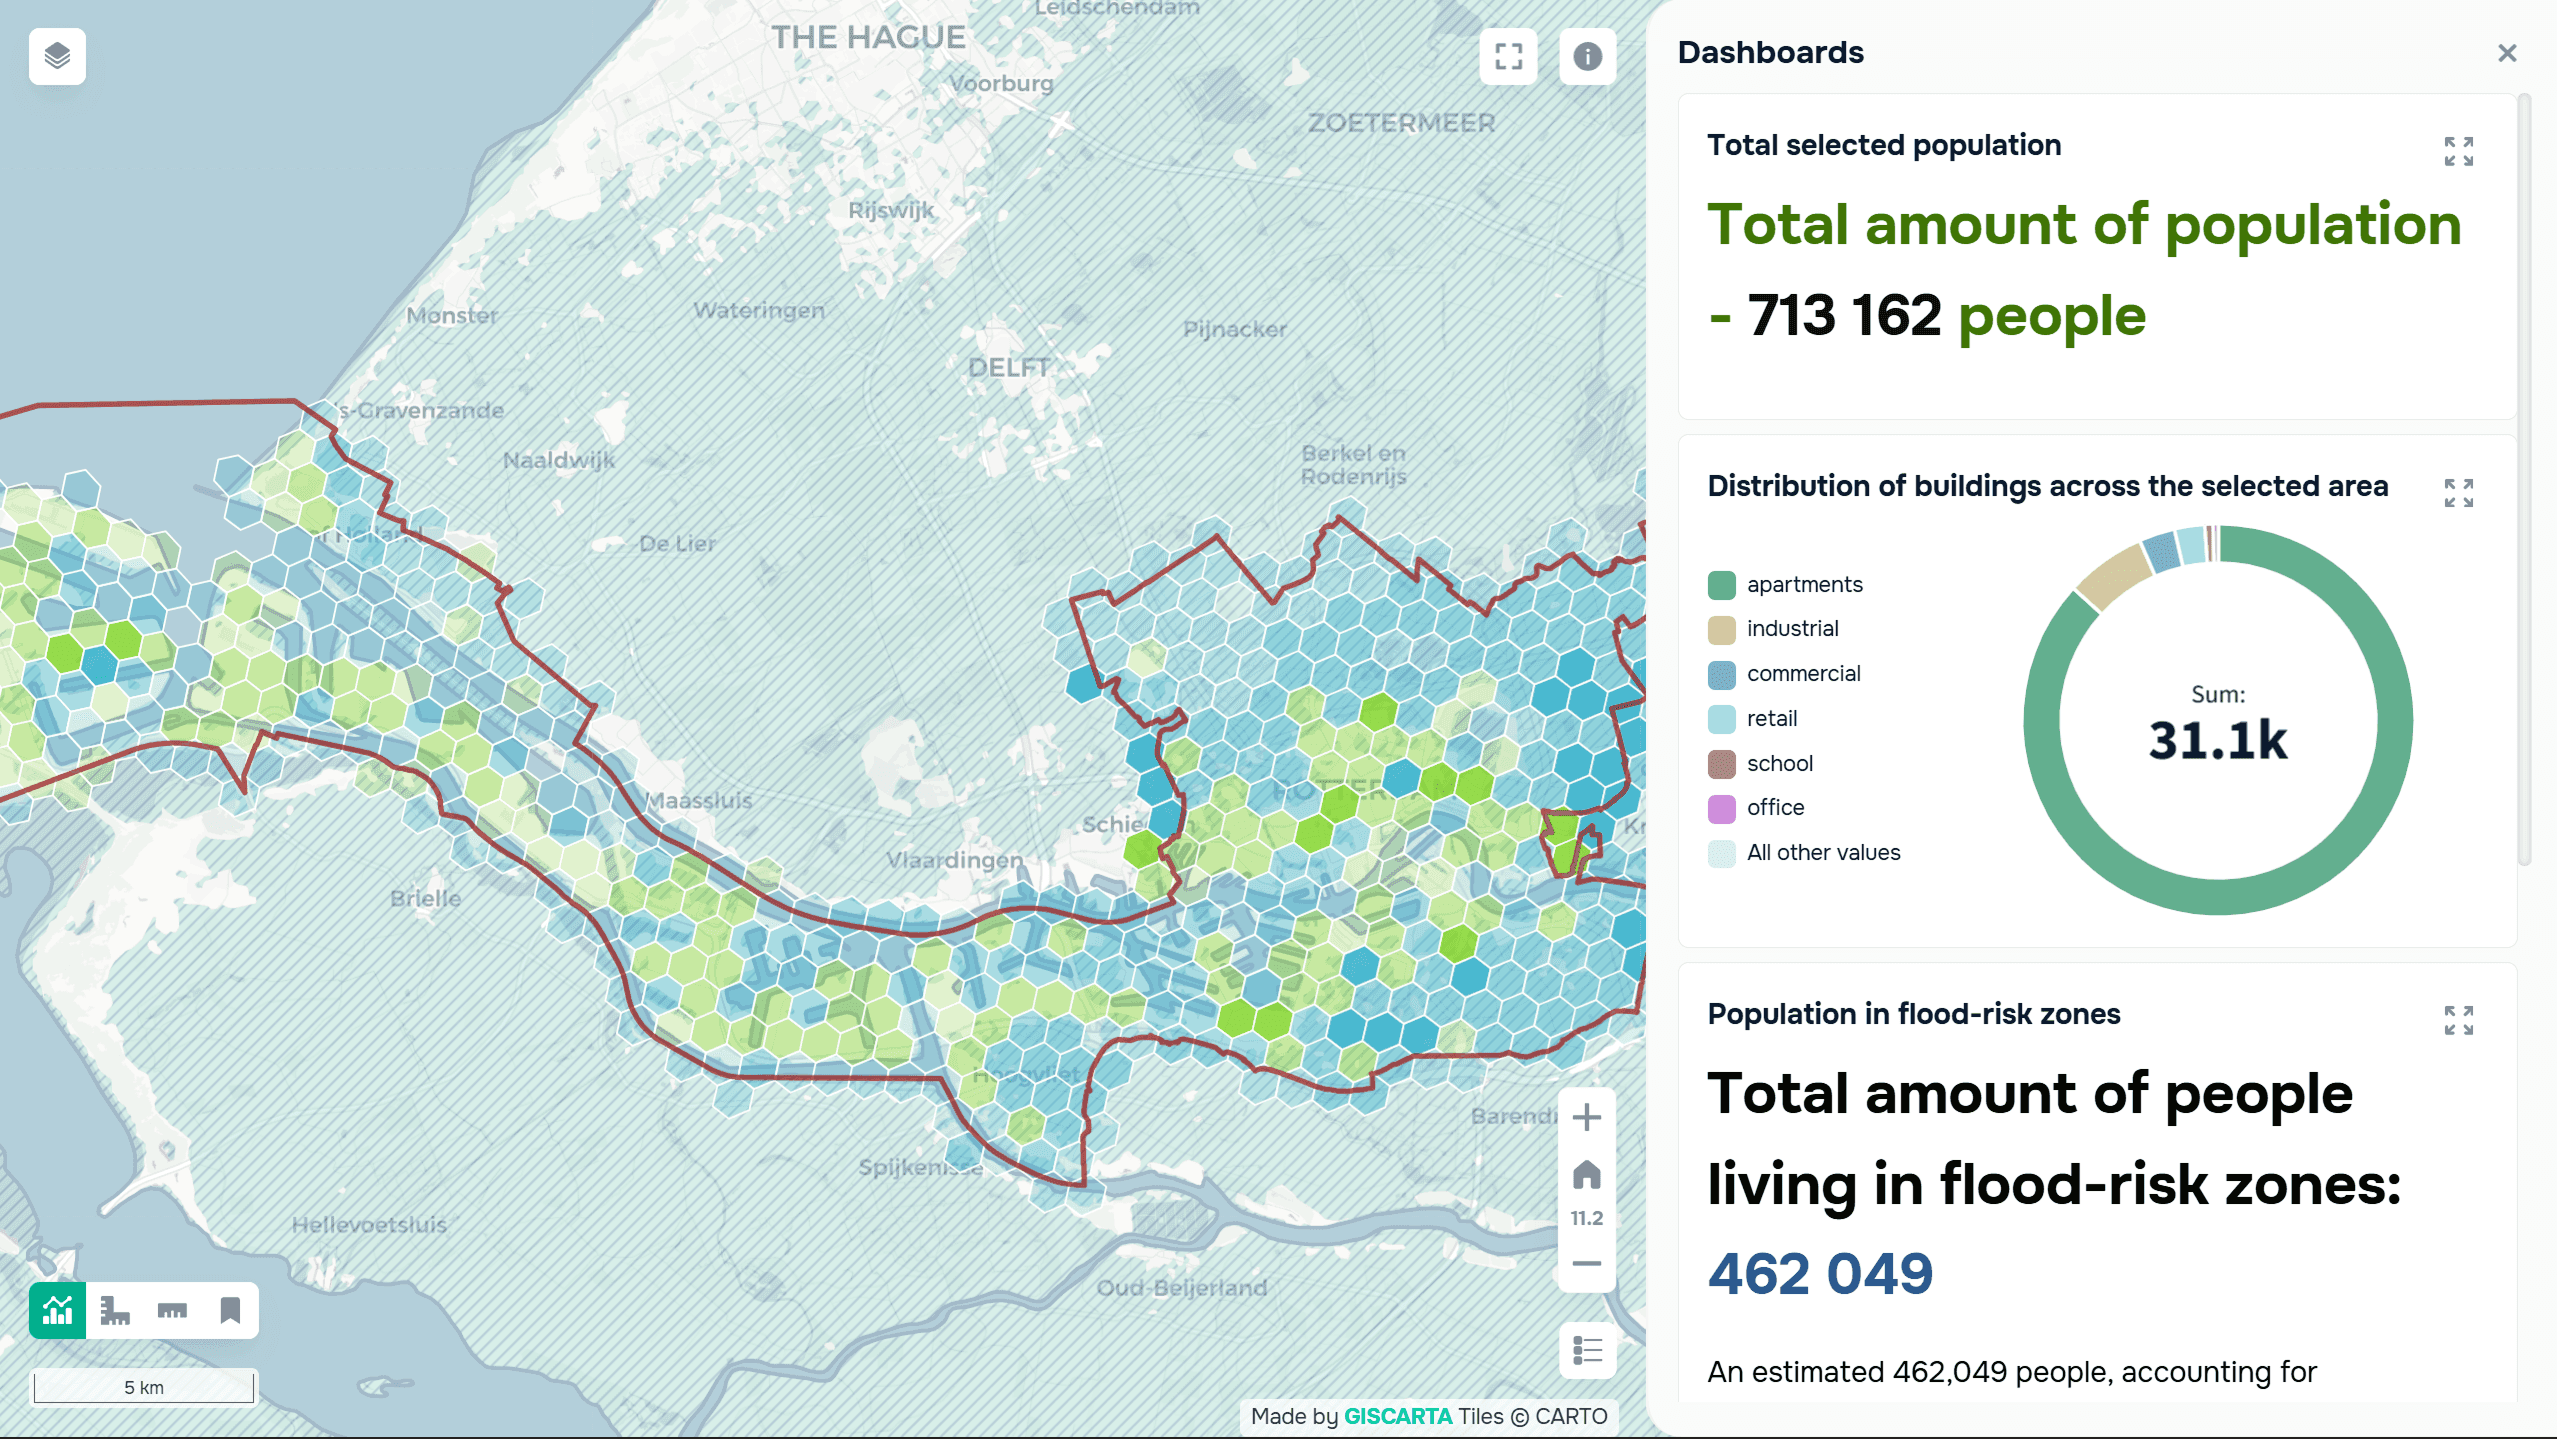
An example of a mapping project about potential flood zones in Rotterdam, compiled on GISCARTA. Link to the project
here.
Environmental factors such as noise pollution, air quality, and proximity to industrial facilities are also increasingly being considered.
Investment Analysis
GIS is useful not only for analyzing individual properties but also for managing investment portfolios. Spatial visualization allows you to compare assets across regions and analyze their distribution.
The map can display:
property distribution
profitability by district
market dynamics
accessibility indicators
This helps quickly identify promising areas and make more informed investment decisions.
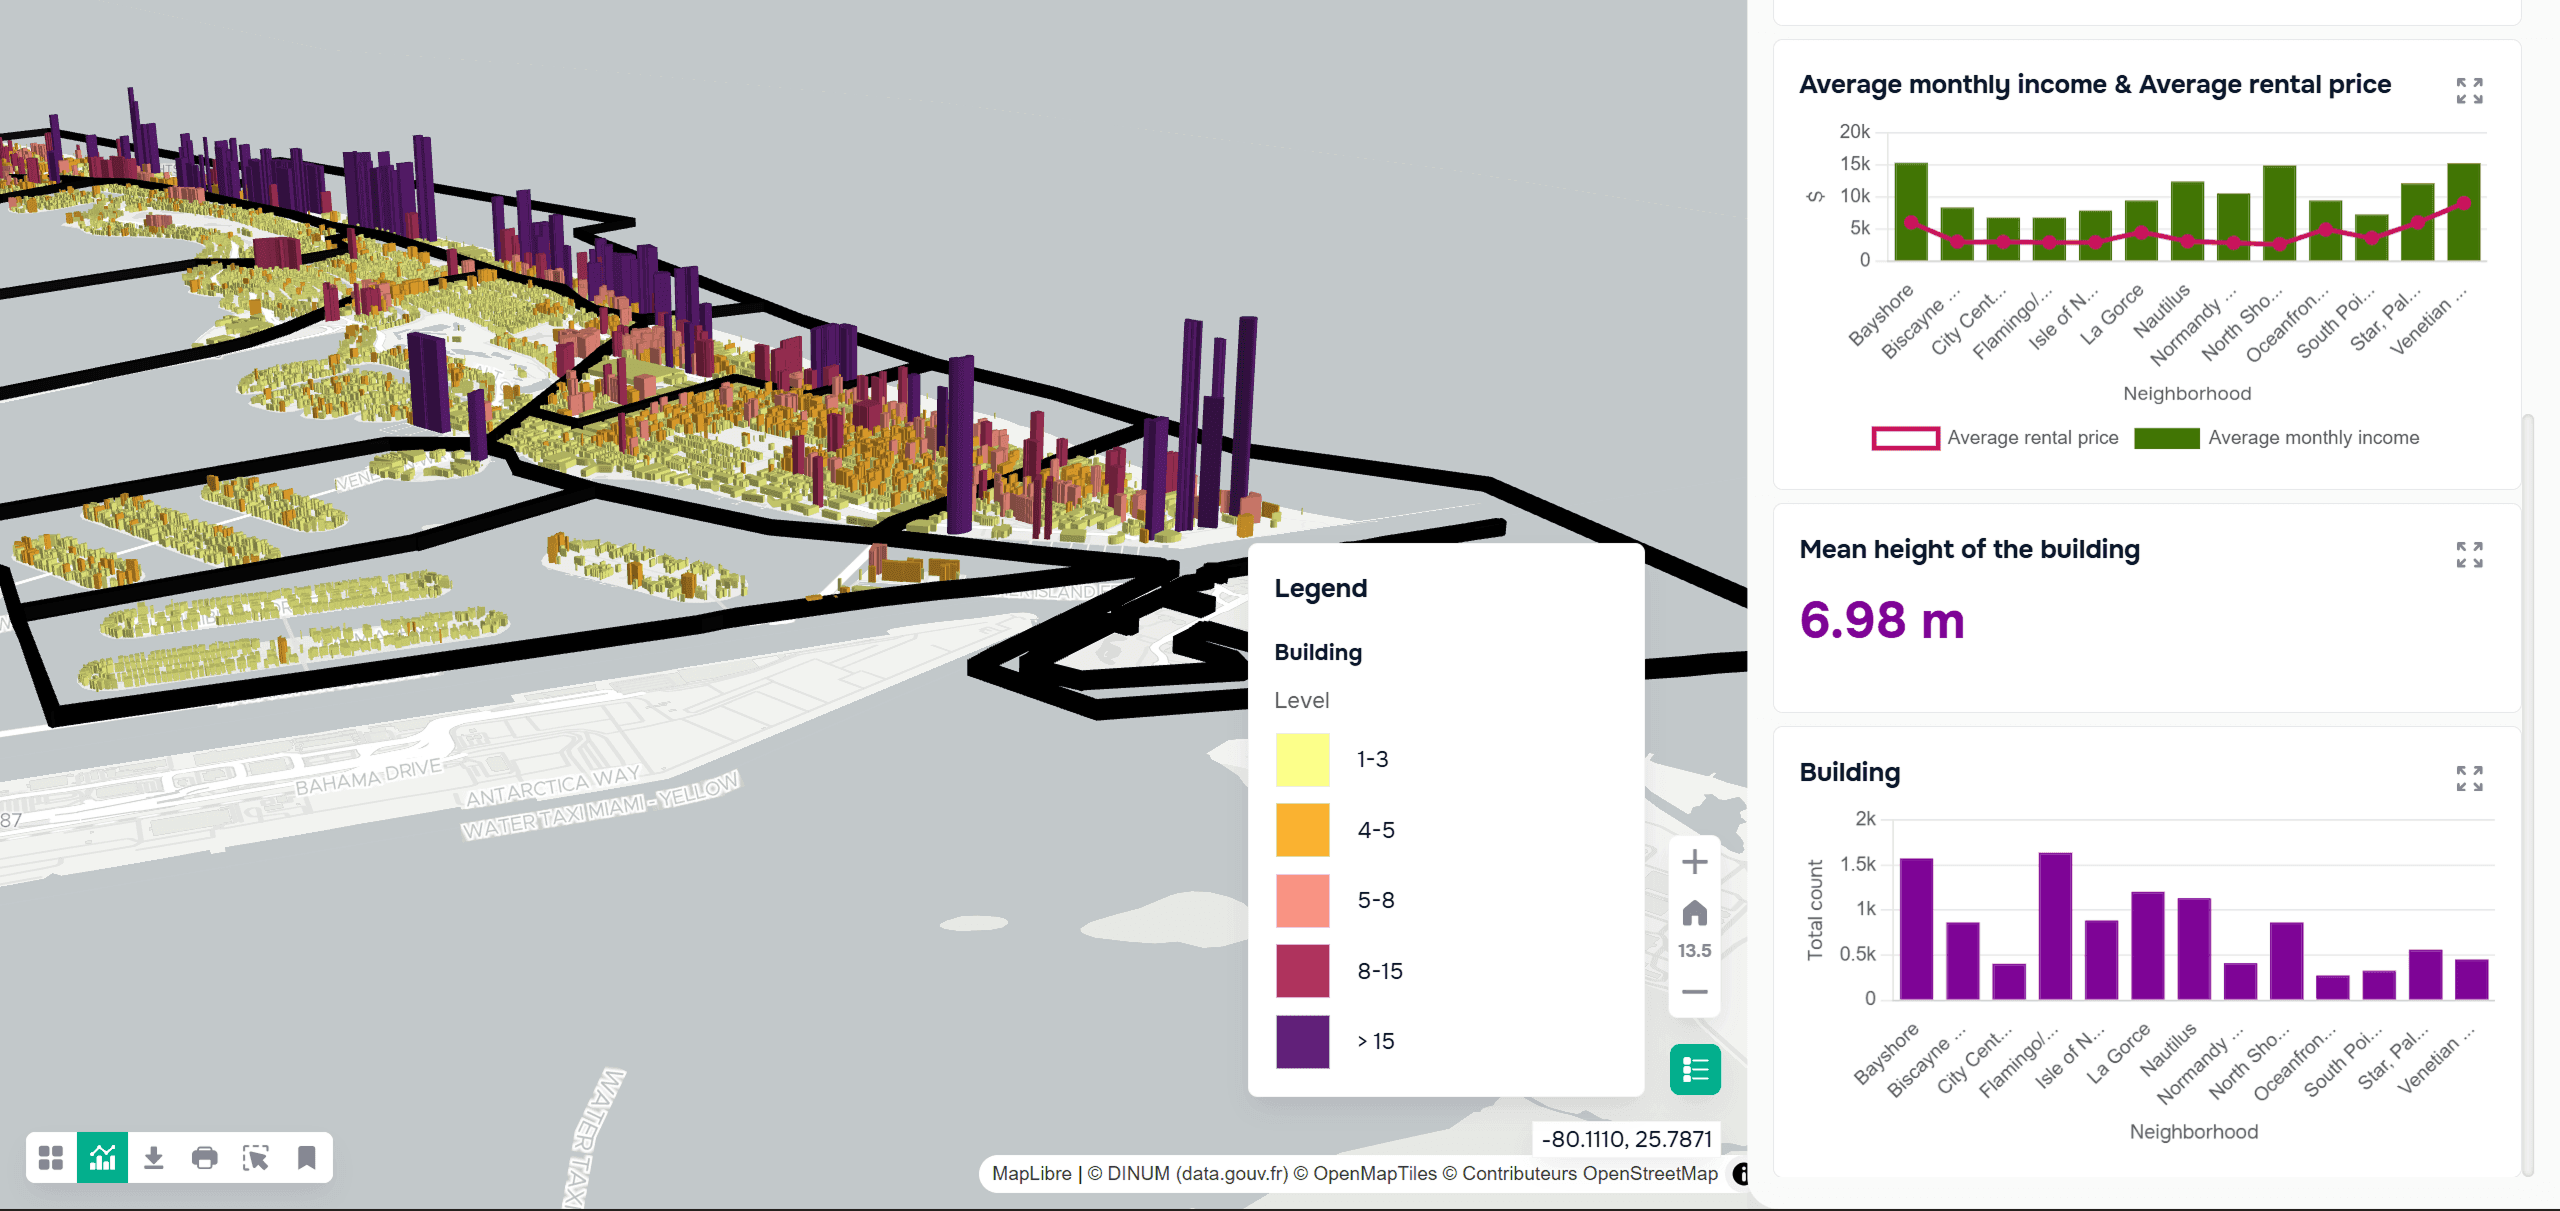
An example of a mapping project about the Miami real estate market, compiled on GISCARTA. Link to the project
here.
Spatial Analysis Methods
Several basic spatial analysis methods are used in real estate.
Buffer analysis helps estimate the distance to infrastructure such as schools, subways, shopping centers, and parks.
Heat maps are used to visualize demand density, asset concentration, or property values.
Overlay analysis allows you to combine multiple data layers, such as demographics, transportation, and zoning.
Network analysis is used to calculate routes and travel times.
Suitability analysis helps find the most suitable areas for construction based on multiple criteria simultaneously.
Dashboards and Visualization
Real estate projects typically involve a large amount of information, so dashboards play a crucial role.
A dashboard combines:
maps
graphs
metrics
filters
This allows you to quickly compare neighborhoods, analyze the market, and interact with the data.
For example, a map might show property prices by neighborhood, while graphs show demographics and transportation accessibility.
Interactive visualizations significantly simplify communication between analysts, investors, and clients.
Trends
The role of GIS in real estate continues to grow.
Modern projects increasingly utilize:
real-time mobility data
AI forecasting models
digital twins of cities
urban environment analytics
integration with smart city systems
PropTech companies are actively integrating geoanalytics into real estate valuation and investment analysis platforms.
As data volumes grow, spatial analysis is becoming a standard part of real estate work.
FAQ
Why is GIS important for real estate?
Because the value and attractiveness of a property are directly linked to its location, infrastructure, and surroundings.
Can GIS be used to predict prices?
Not directly, but GIS helps identify spatial patterns and factors that influence value.
Is GIS only suitable for large companies?
No. Modern web GIS platforms make spatial analysis accessible even to small teams.
Key Takeaways
GIS allows you to analyze not only the property but also its spatial context.
Transportation accessibility, demographics, and infrastructure directly impact property values.
Spatial analysis helps you more accurately select locations and evaluate investment potential.
Interactive maps and dashboards make it easier to work with large volumes of data.


