
Land Surface Temperature (LST) is one of the most in-demand remote sensing products. Unlike air temperature, which is measured by weather stations, LST shows how hot the surface itself is—soil, vegetation, water, asphalt, or buildings.
Today, surface temperature data is used in agriculture, ecology, urban studies, and climate research. Thanks to open satellite data, this information is available free of charge and without field measurements.
Different types of surface absorb and release heat differently. Water warms more slowly than land, vegetation cools through evaporation, and urban areas with large amounts of concrete and asphalt often form so-called heat islands.
Which satellites measure surface temperature?
Satellites equipped with thermal infrared sensors are used to determine surface temperature. Landsat 8 and Landsat 9 are among the most popular sources. They provide a spatial resolution of approximately 100 meters for thermal channels and are suitable for detailed analysis of individual areas.
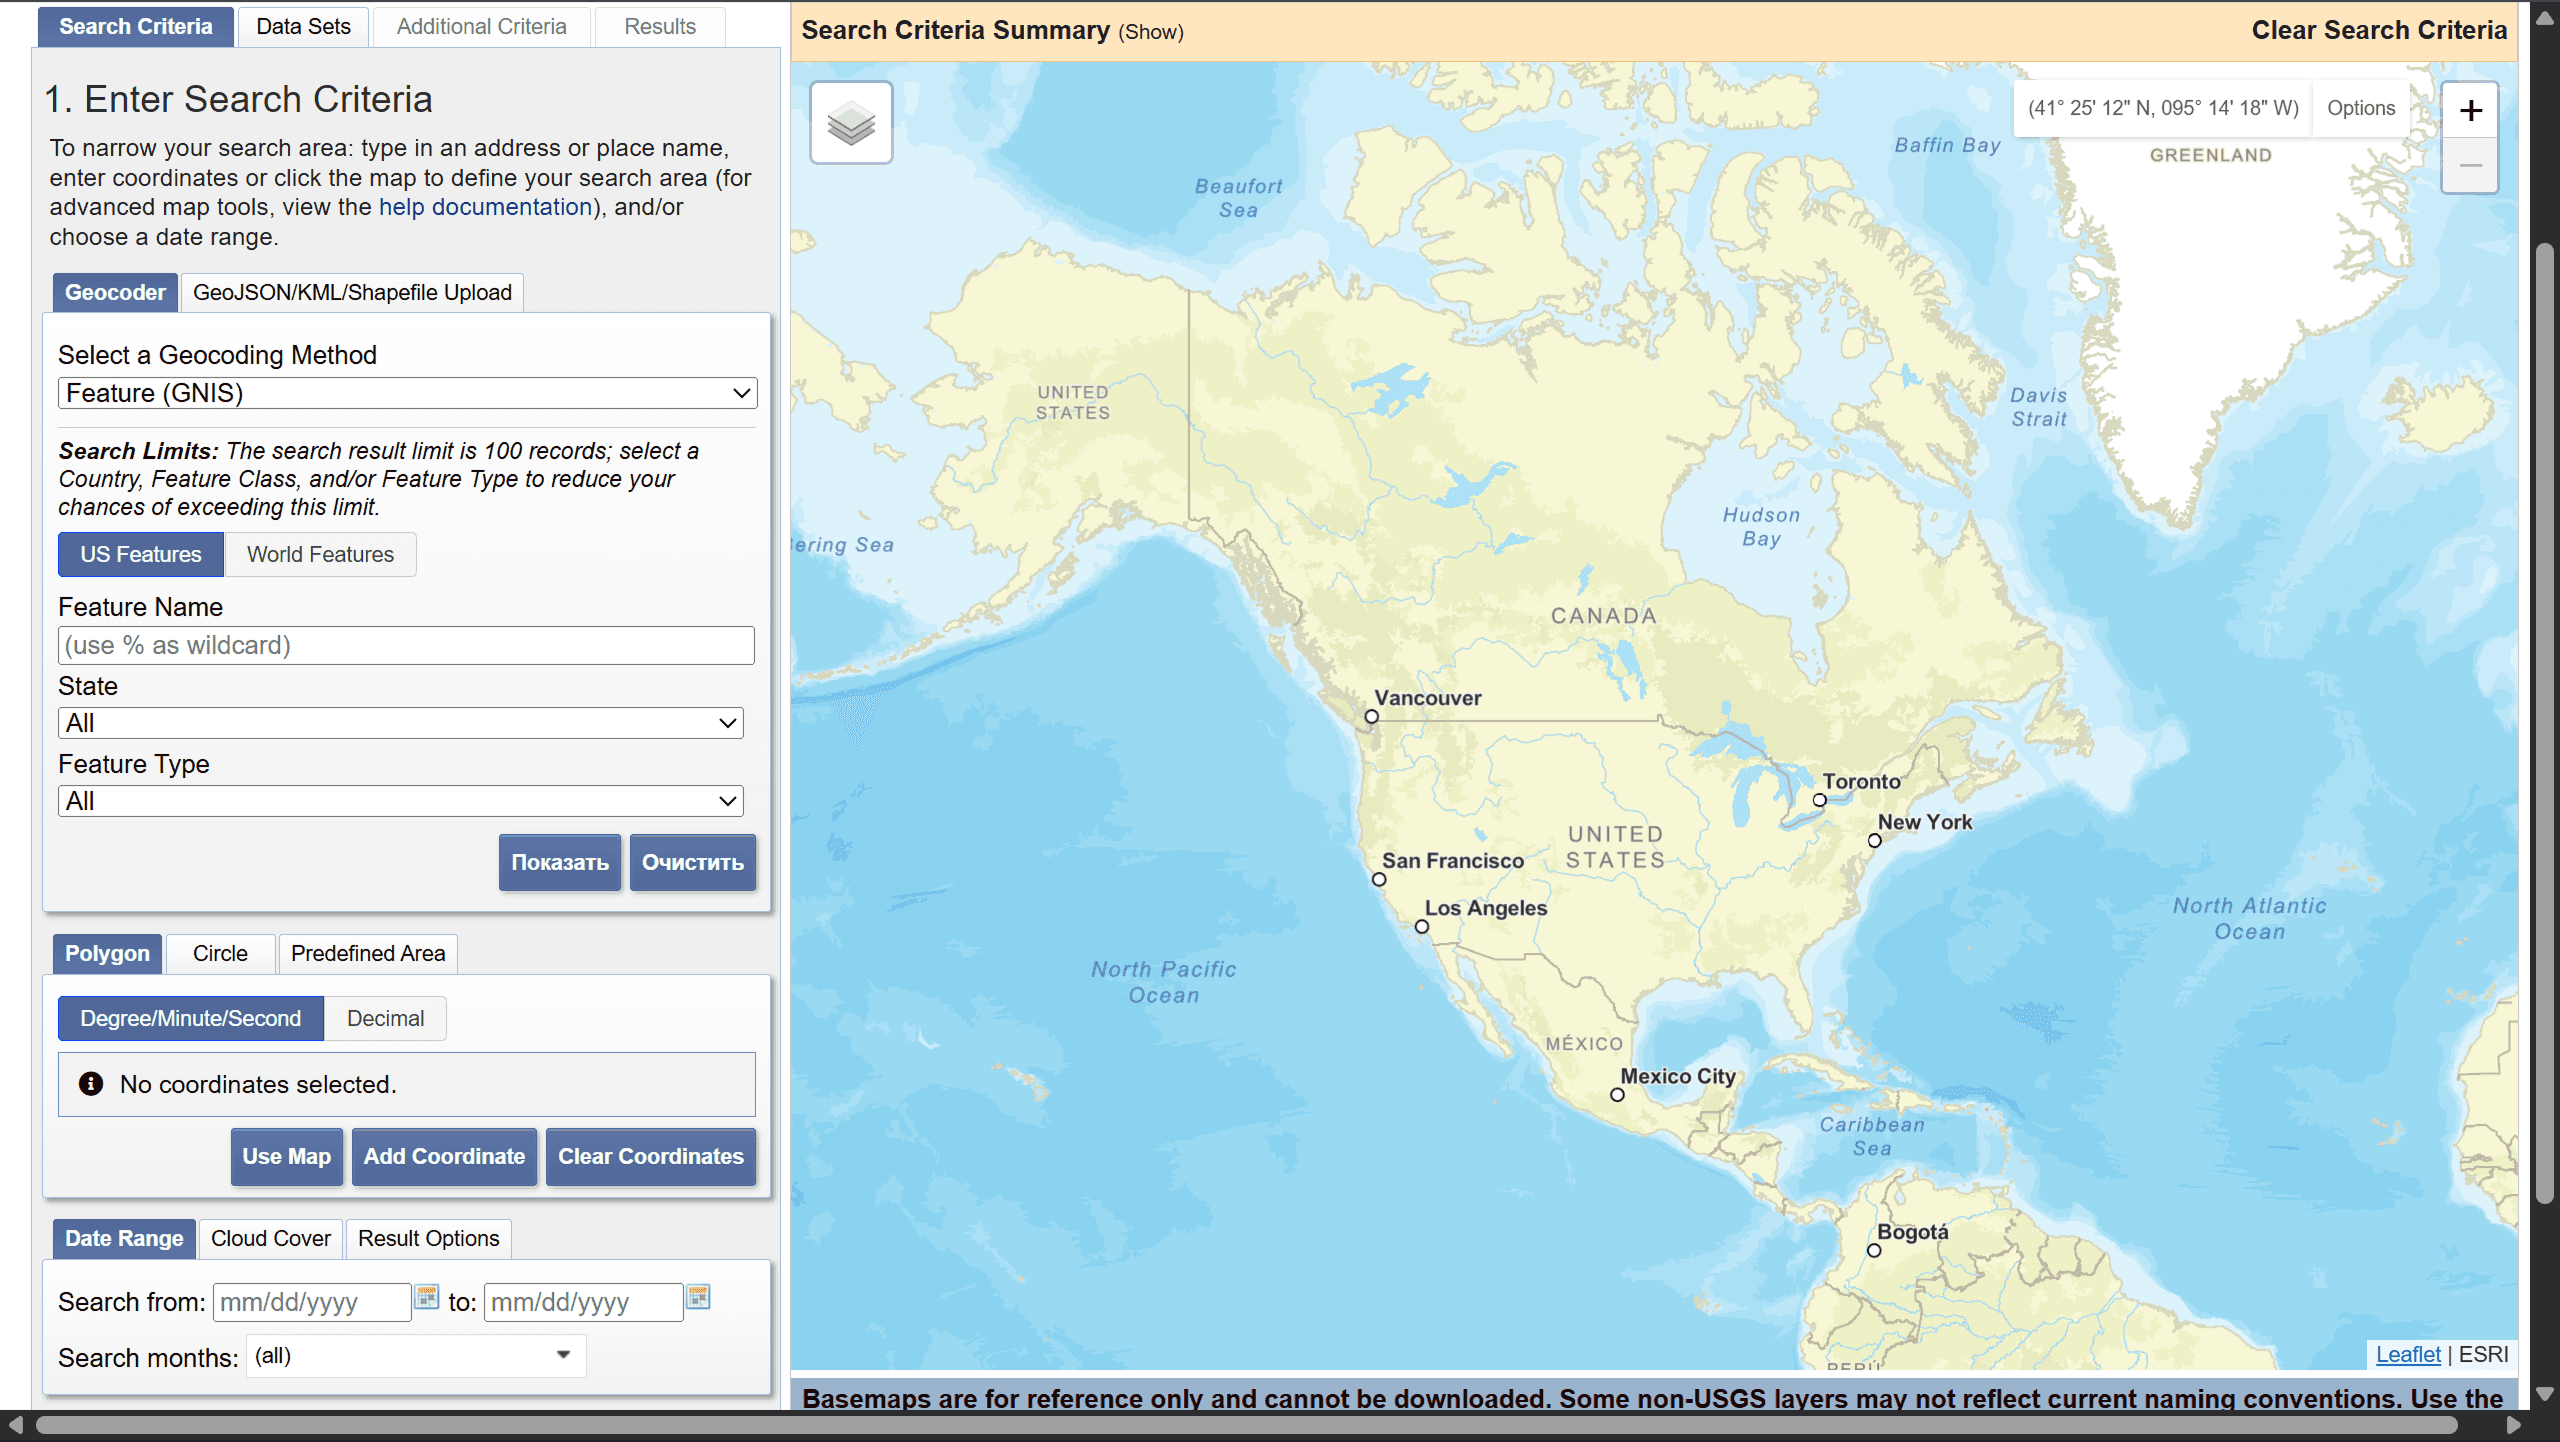
USGS EarthExplorer satellite imagery download portal
MODIS data from the Terra and Aqua satellites is widely used for global monitoring. Their advantage is their daily data updates, allowing for temperature changes to be tracked in near real time.
Another promising source is the ECOSTRESS mission on the International Space Station. It provides high-resolution surface temperature data and is used to study plant water stress and urban heat islands. It is important to note that the popular Sentinel-2 satellite does not have thermal channels, so direct surface temperature measurements from its data are impossible.
How Satellites Determine Temperature
Any object with a temperature above absolute zero emits infrared energy. Satellite sensors record this thermal radiation and convert it into numerical values for each pixel.
However, it's not the temperature itself that is measured, but the intensity of thermal radiation. To obtain the final temperature, it's necessary to consider the properties of the surface, particularly its emissivity—its ability to emit thermal energy.
For example, water, soil, concrete, and vegetation have different emissivities, so similarly heated objects may appear differently on a satellite image. Modern data processing algorithms take these characteristics into account and produce fairly accurate estimates of surface temperature.
This results in maps where each pixel corresponds to a specific temperature value.
How to obtain surface temperature data
There are two main approaches.
The first is to use ready-made LST products. Many organizations already perform the necessary calculations and publish ready-made temperature maps. For example, NASA distributes MODIS Land Surface Temperature products, and ready-made Surface Temperature layers are available for Landsat.
If ready-made products are insufficient, surface temperature can be calculated independently using Landsat satellite thermal band data using a raster calculator in any available GIS program, such as QGIS or ArcGIS. This approach allows you to obtain results for specific dates, areas, and research objectives.
In the classic method, the calculation is performed in several stages. First, digital pixel values (DN) are converted into spectral radiation.

Spectral Radiance Calculation Formula
where:
Lλ = TOA spectral radiance (Watts/(m2 * srad * μm))
ML = Band-specific multiplicative rescaling factor from the metadata (RADIANCE_MULT_BAND_x, where x is the band number)
AL = Band-specific additive rescaling factor from the metadata (RADIANCE_ADD_BAND_x, where x is the band number)
Qcal = Quantized and calibrated standard product pixel values (DN)
Then the brightness temperature is calculated:

Brightness temperature formula
where:
Lλ = TOA spectral radiance (Watts/(m2 * srad * μm))
K1 = Band-specific thermal conversion constant from the metadata (K1_CONSTANT_BAND_x, where x is the thermal band number)
K2 = Band-specific thermal conversion constant from the metadata (K2_CONSTANT_BAND_x, where x is the thermal band number)
In the final step, a correction for surface emissivity is performed and the surface temperature (LST) is calculated:
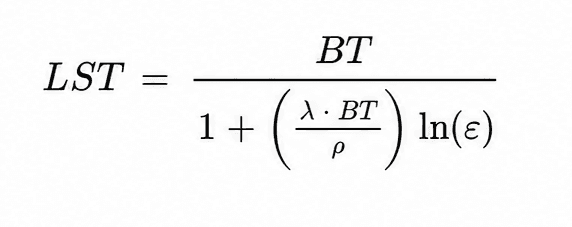
Land Surface Temperature Formula
Where:
ε = surface emissivity;
λ = wavelength of the thermal channel;
ρ = a physical constant.
In practice, most users rarely perform all the calculations manually. QGIS offers ready-made tools and plugins for this:
Semi-Automatic Classification Plugin (SCP)
One of the most popular plugins for processing Landsat and Sentinel data. It automatically downloads data, performs atmospheric correction, and calculates surface temperature based on Landsat data.
Suitable for:
calculating LST;
classifying images;
calculating NDVI and other indices.
Google Earth Engine + QGIS
For large areas, a combination of Google Earth Engine and QGIS is often used. Temperature calculations are performed in the cloud using Landsat Surface Temperature or MODIS LST collections, and the results are exported to QGIS for further analysis and visualization.
For most practical tasks (urban heat islands, agricultural analysis, drought monitoring), it is now easier to use ready-made Landsat Collection 2 Surface Temperature or MODIS LST products than to calculate the temperature from scratch. However, understanding the basic calculation steps helps to correctly interpret the results and evaluate their accuracy.
Where Surface Temperature is Used
Temperature maps are used in many areas.
In agriculture, they help identify areas with moisture stress and assess crop health. Elevated surface temperatures often indicate plant water stress and can be used to make irrigation decisions.
In urban studies, LST data helps identify heat islands—areas where the temperature is significantly higher than the surrounding area. This helps plan greening and urban infrastructure development. In environmental research, surface temperature is used to monitor droughts, land degradation, and the impacts of climate change.
Furthermore, temperature data is used in wildfire detection, water body analysis, and ecosystem health assessments.

Example of the Landsat Surface Temperature Science Product from Yellowstone National Park on September 11, 2018. Source: USGS
FAQ
How is surface temperature different from air temperature?
Surface temperature measures the heating of soil, vegetation, water, or urban areas, while air temperature is measured at an altitude of approximately 2 meters above ground.
Which satellites are used to determine surface temperature?
The most common are Landsat 8/9, MODIS, and ECOSTRESS, which are equipped with thermal infrared sensors.
Can I get surface temperature data for free?
Yes. Many satellite data and LST products are available free of charge through open catalogs and data analysis platforms.
Key Takeaways
Surface temperature is determined by thermal infrared radiation recorded by satellites.
Landsat, MODIS, and ECOSTRESS data are most often used to calculate LST.
Temperature maps are used in agriculture, urban studies, ecology, and climate research.


