
GISCARTA is a web platform for visualizing and analyzing spatial data. In addition to working with maps and layers, the platform provides a set of widgets that help automate spatial analysis and visualize results in a convenient interactive format.
Let's look at the main geoanalytics tools available in GISCARTA.
Geoprocessing
The Geoprocessing widget is the foundation of most analytical tasks in GIS. It allows you to perform operations on spatial objects and generate new data based on existing layers.
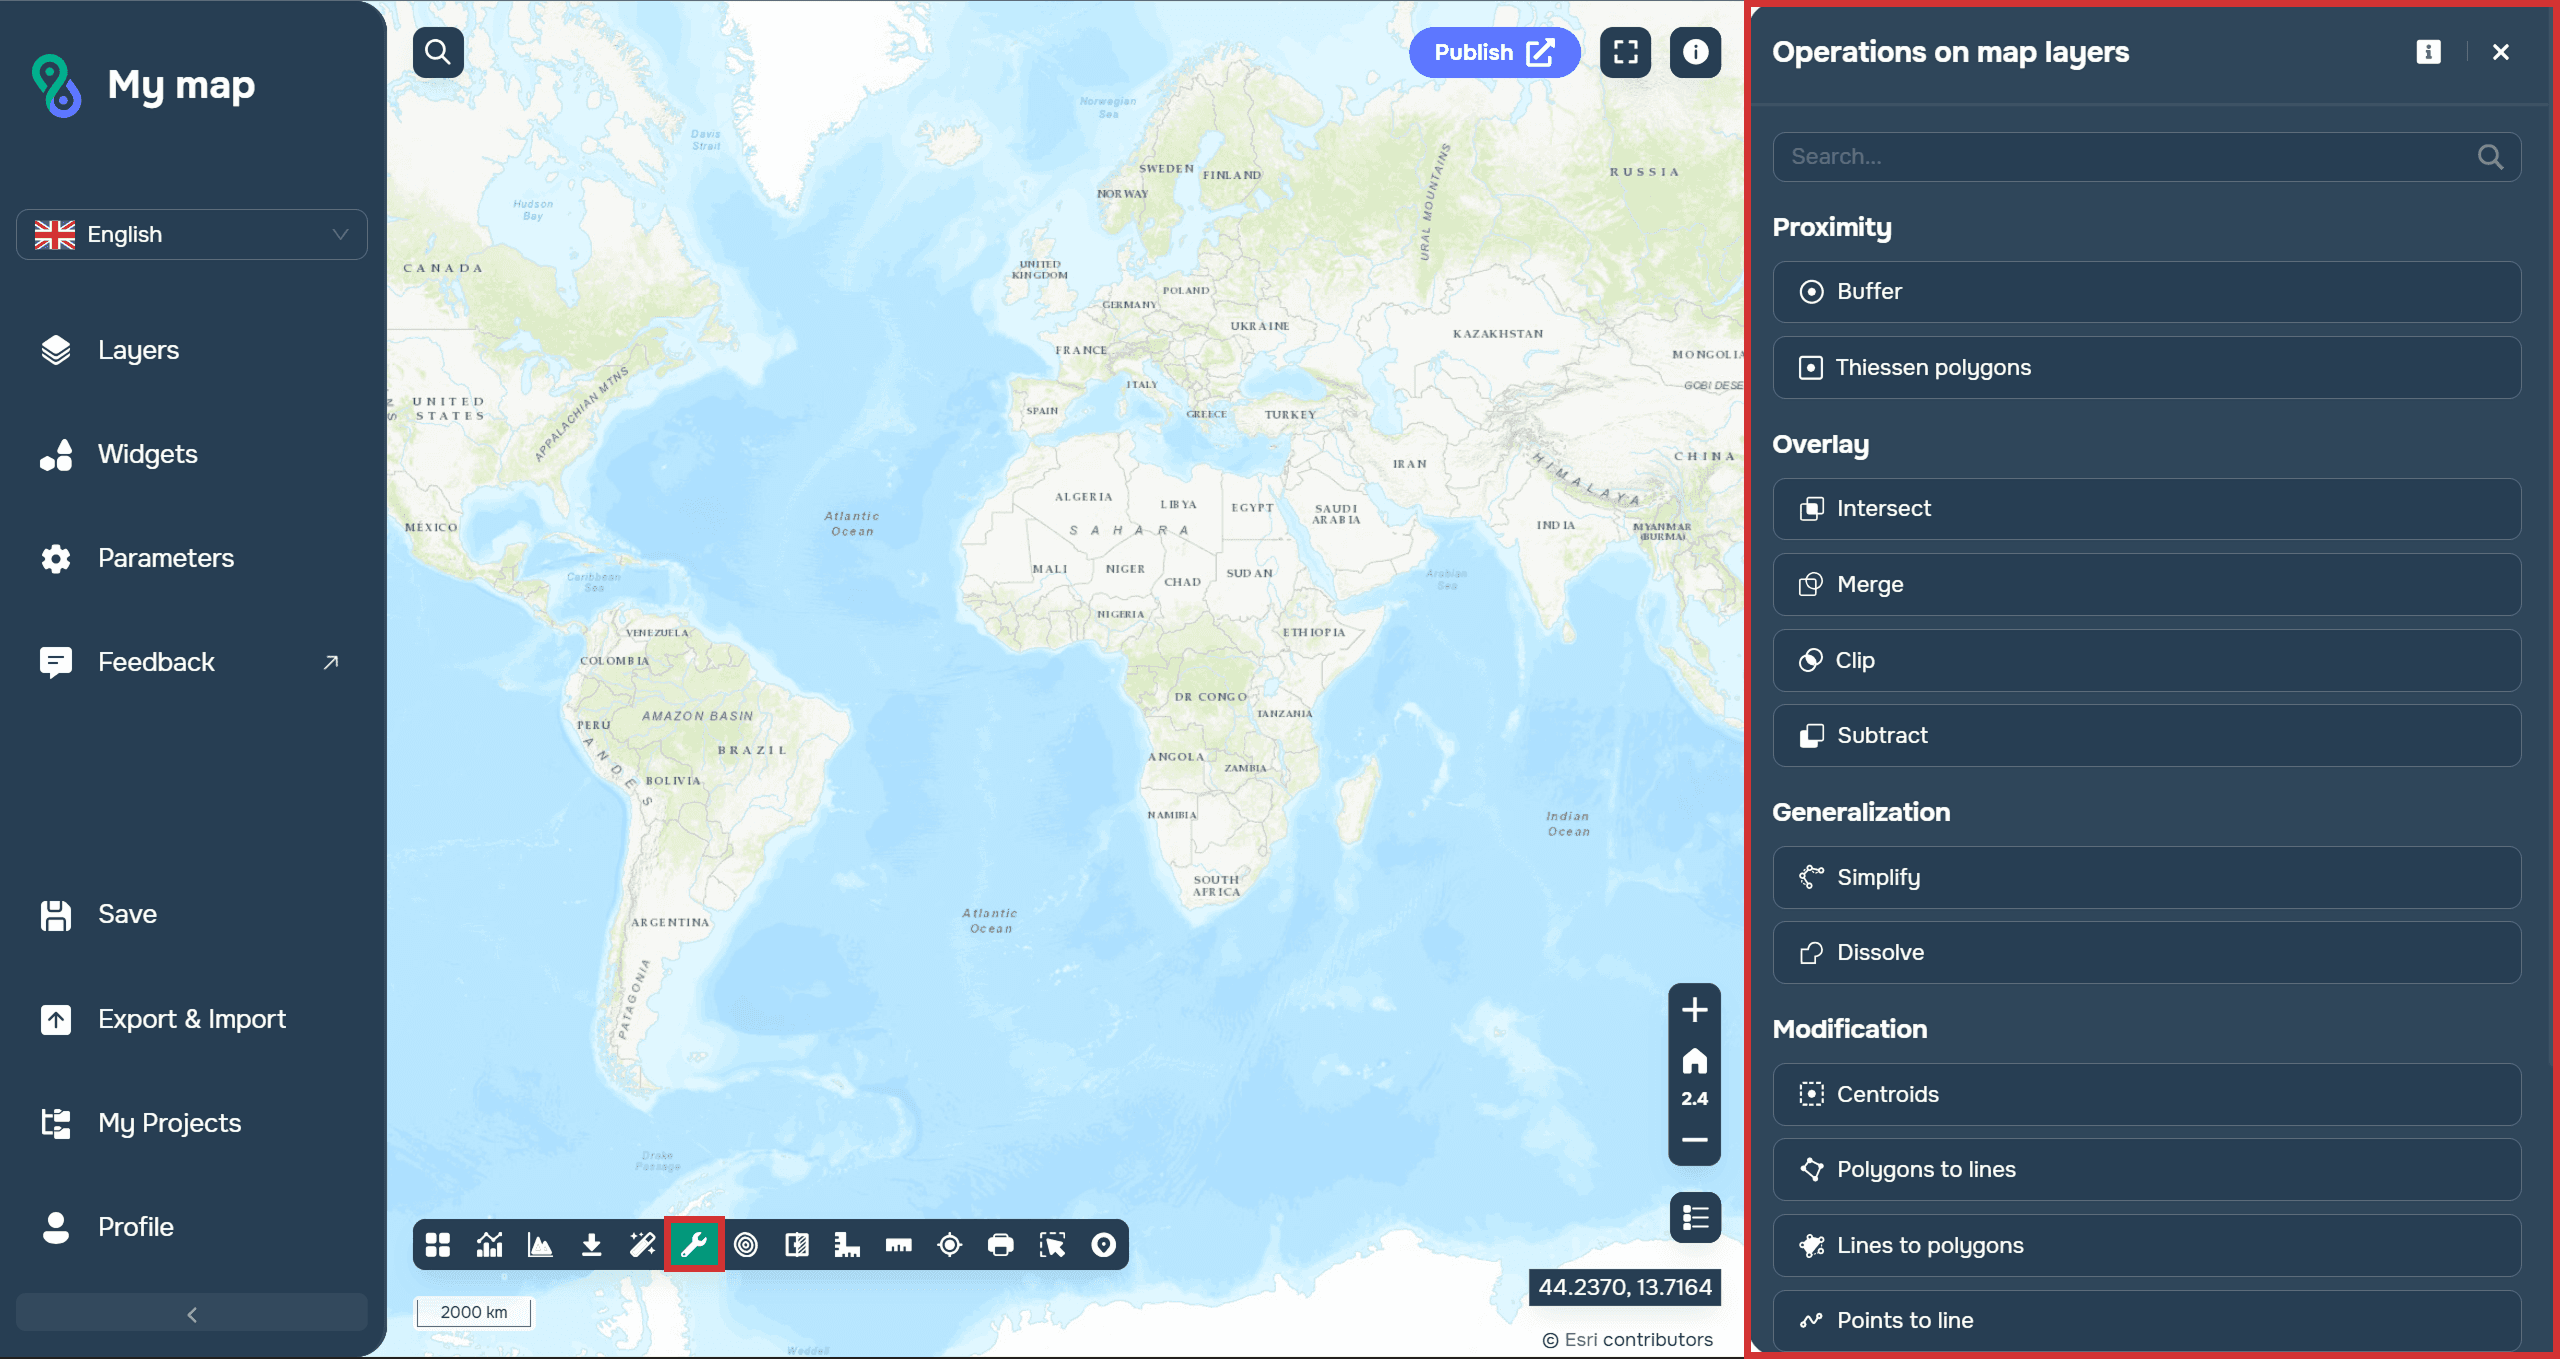
Using this widget, users can perform the following operations:
Proximity (Buffer, Thiessen polygons)
Overlay (Intersect, Merge, Clip, Subtract)
Generalization (Simplify, Dissolve)
Modification (Centroids, Polygons to lines, Lines to polygons, Points to line)
Generation (Points along lines, Grid)
Statistics (Spatial analysis)
For example, when planning the placement of social infrastructure, you can automatically determine the settlements within the service area of a new facility. For businesses, such tools allow you to analyze customer coverage areas and evaluate the viability of new locations.
More details about the widget can be found in the docs.
Dashboards
When working with large volumes of spatial data, it's important not only to analyze it but also to present the results in an easy-to-understand format. The Dashboards widget can be used for these tasks.
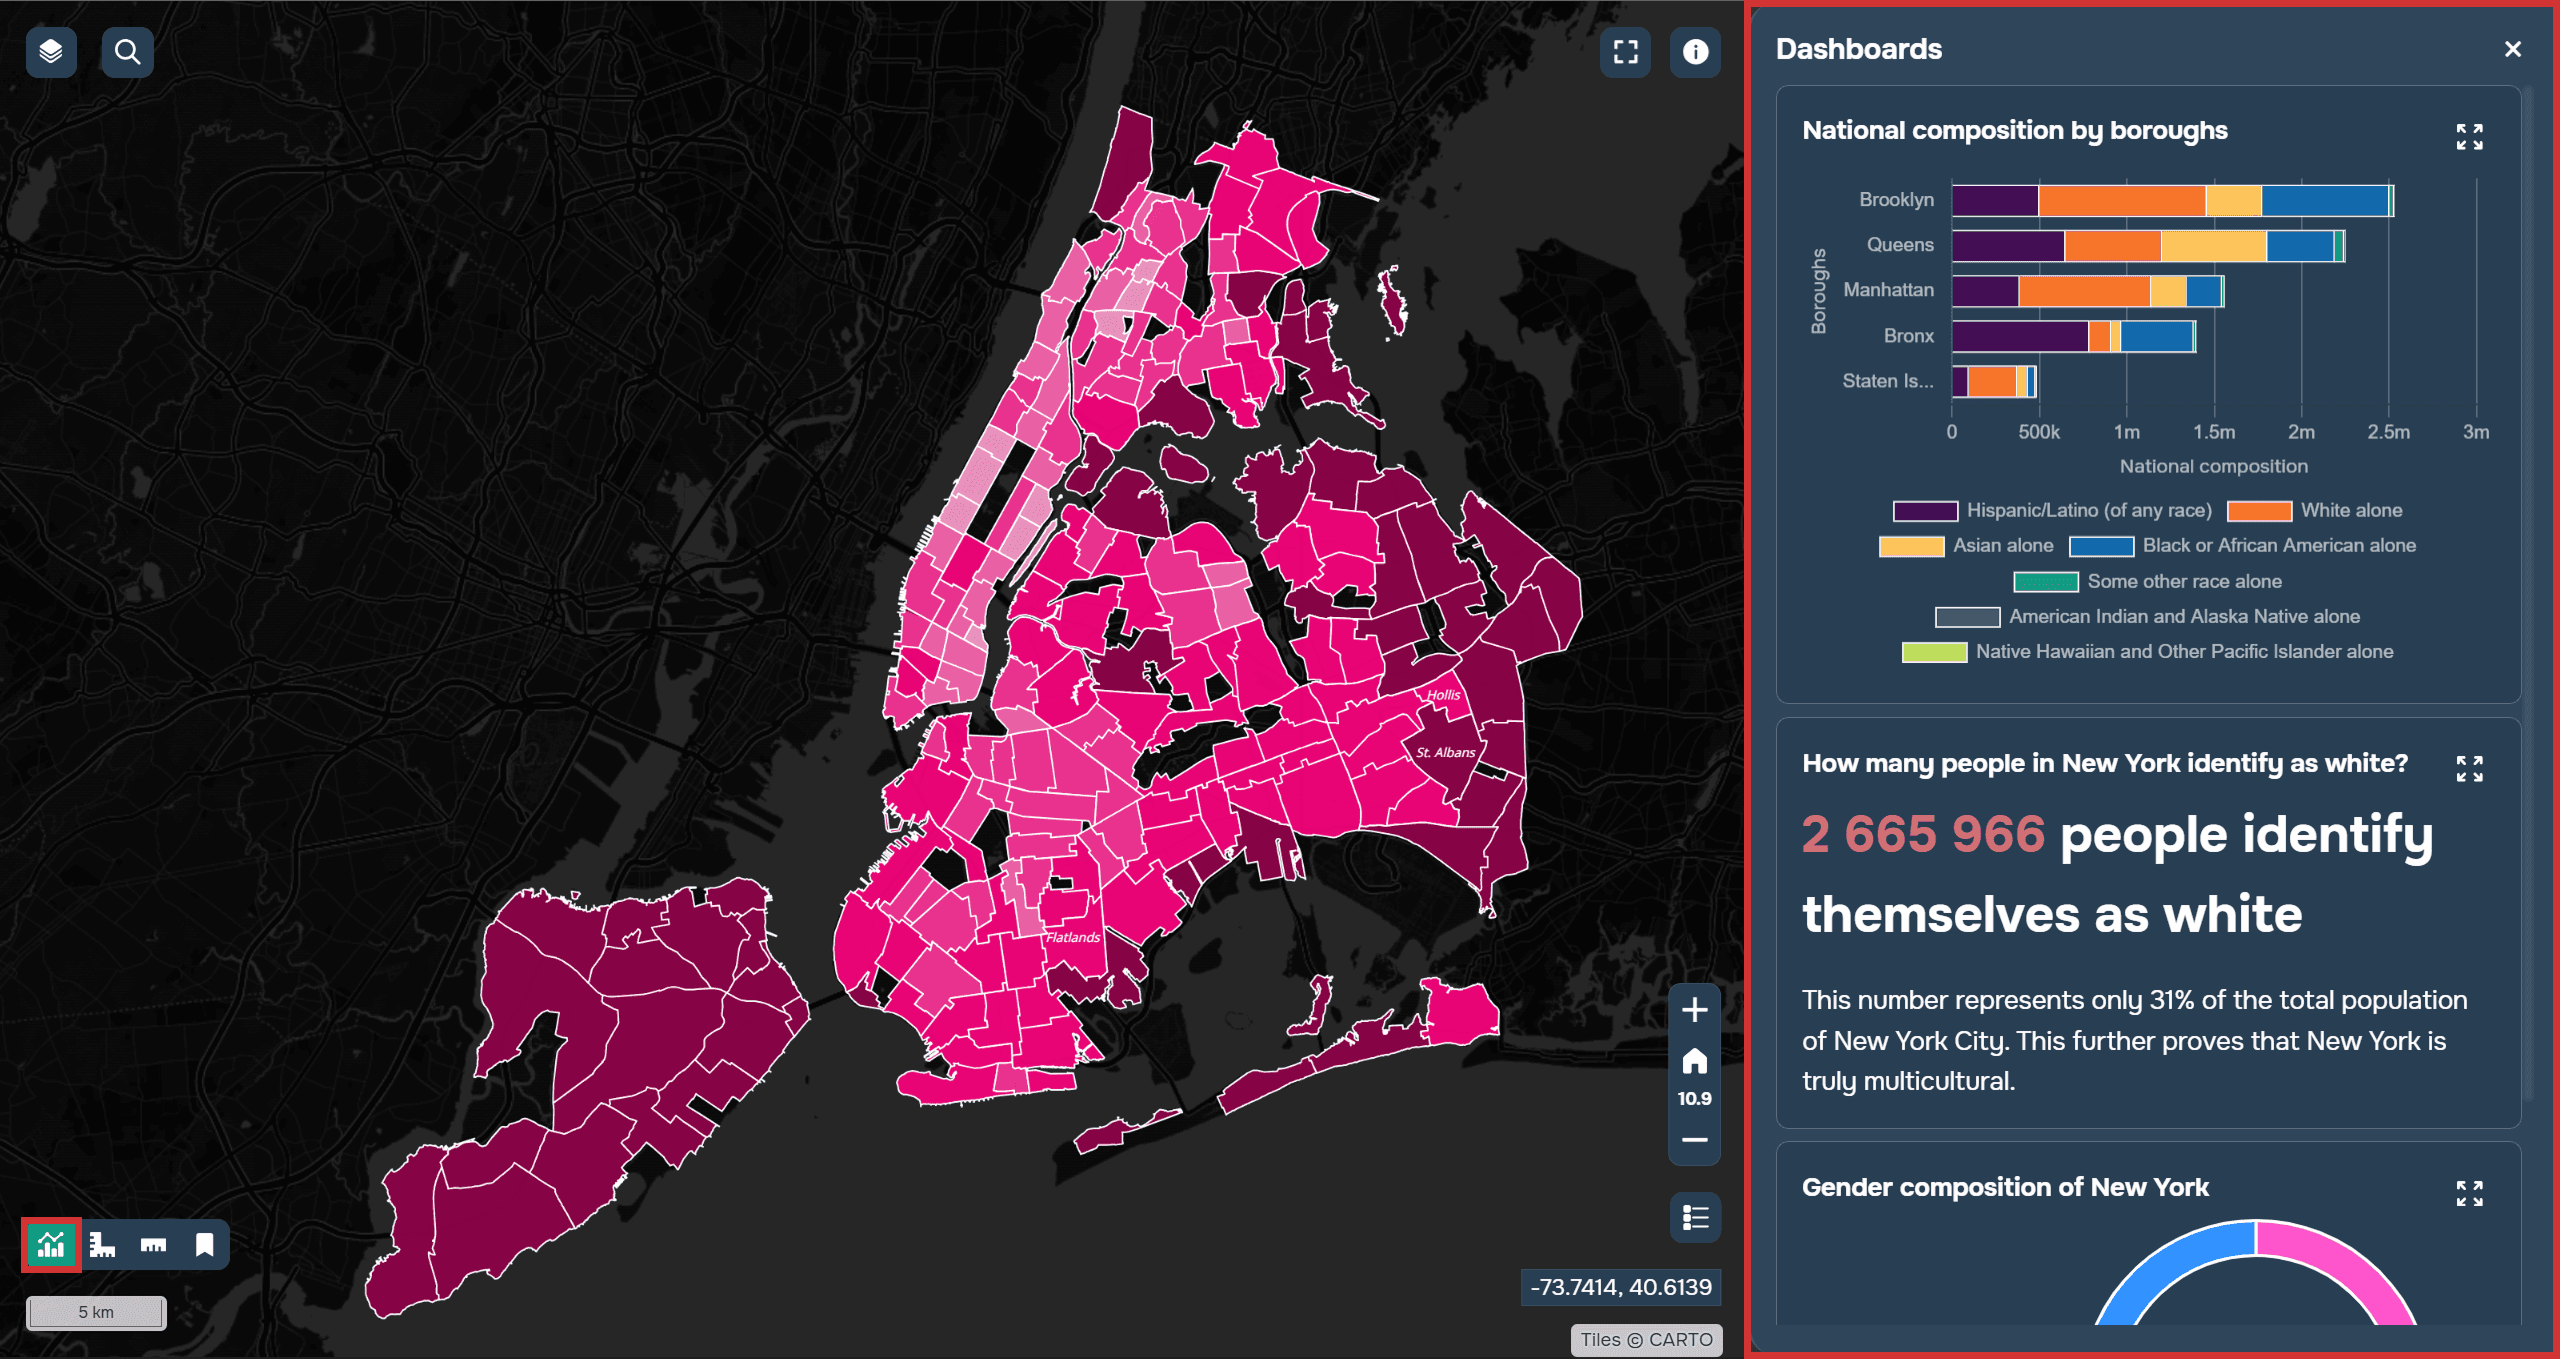
It combines graphs, charts, and key metrics in a single interface. Users can monitor data changes in real time and quickly get information about the status of objects or territories. Dashboards are interactive, meaning they change based on the selection of objects and layer filters on the map.
More details about the widget can be found in the docs.
Elevation Profile
In many projects, not only the location of objects but also the terrain features play a crucial role. To address these challenges, GISCARTA uses the Elevation Profile widget.
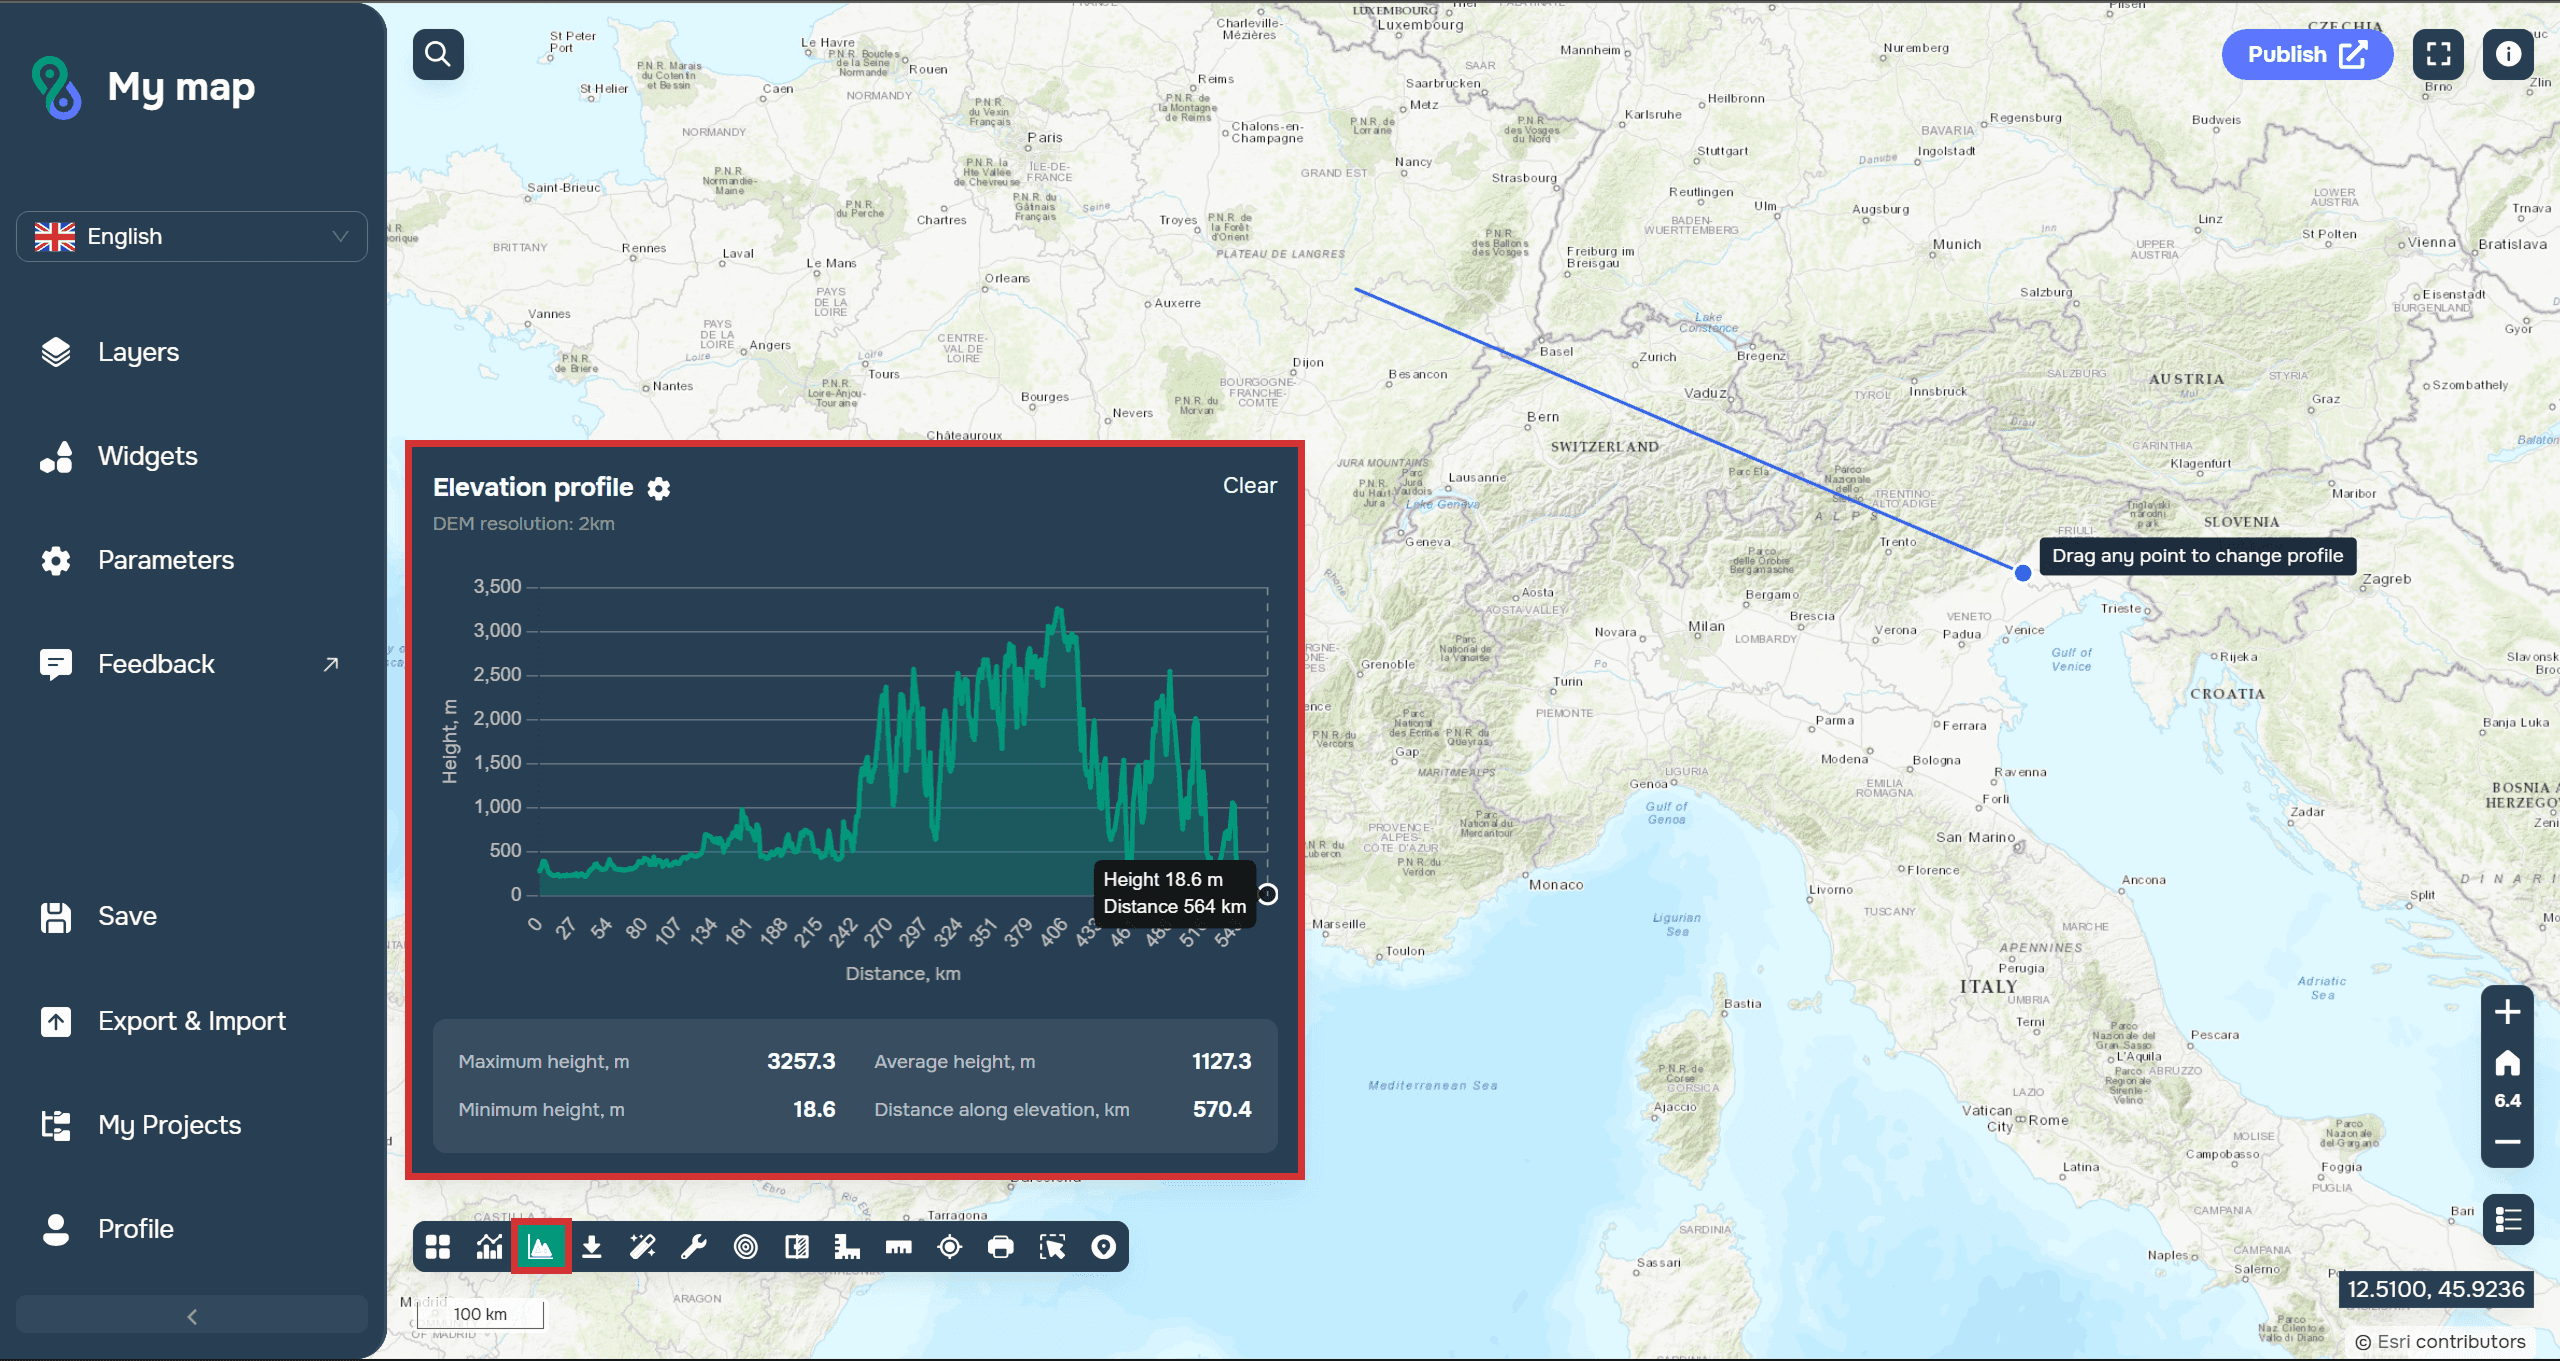
It allows you to create an elevation profile along a selected route or line and clearly show changes in the terrain. The user receives a graph showing ascents, descents, maximum and minimum elevations, and slopes of individual sections.
Terrain visualization helps quickly identify potential limitations and take terrain features into account even at the planning stage.
More details about the widget can be found in the docs.
Transport Analysis
Transport analytics is one of the most in-demand areas of modern geoanalytics. The Transport Analysis widget allows you to assess the transport accessibility of territories and model travel between objects.

One of the key features is the creation of isochrones—zones showing areas that can be reached within a given time on foot, by car, or by public transport. This analysis helps determine the accessibility of medical facilities, schools, shopping centers, and other infrastructure.
In addition to isochrones, the tool allows for route calculations and travel time analysis. Such capabilities are in demand in logistics, retail, urban planning, and transport infrastructure development.
More details about the widget's operation can be found in the docs.
Layer Comparison
In many projects, it is important not only to analyze current data but also to track changes over time. GISCARTA provides the Layer Comparison widget for these tasks.
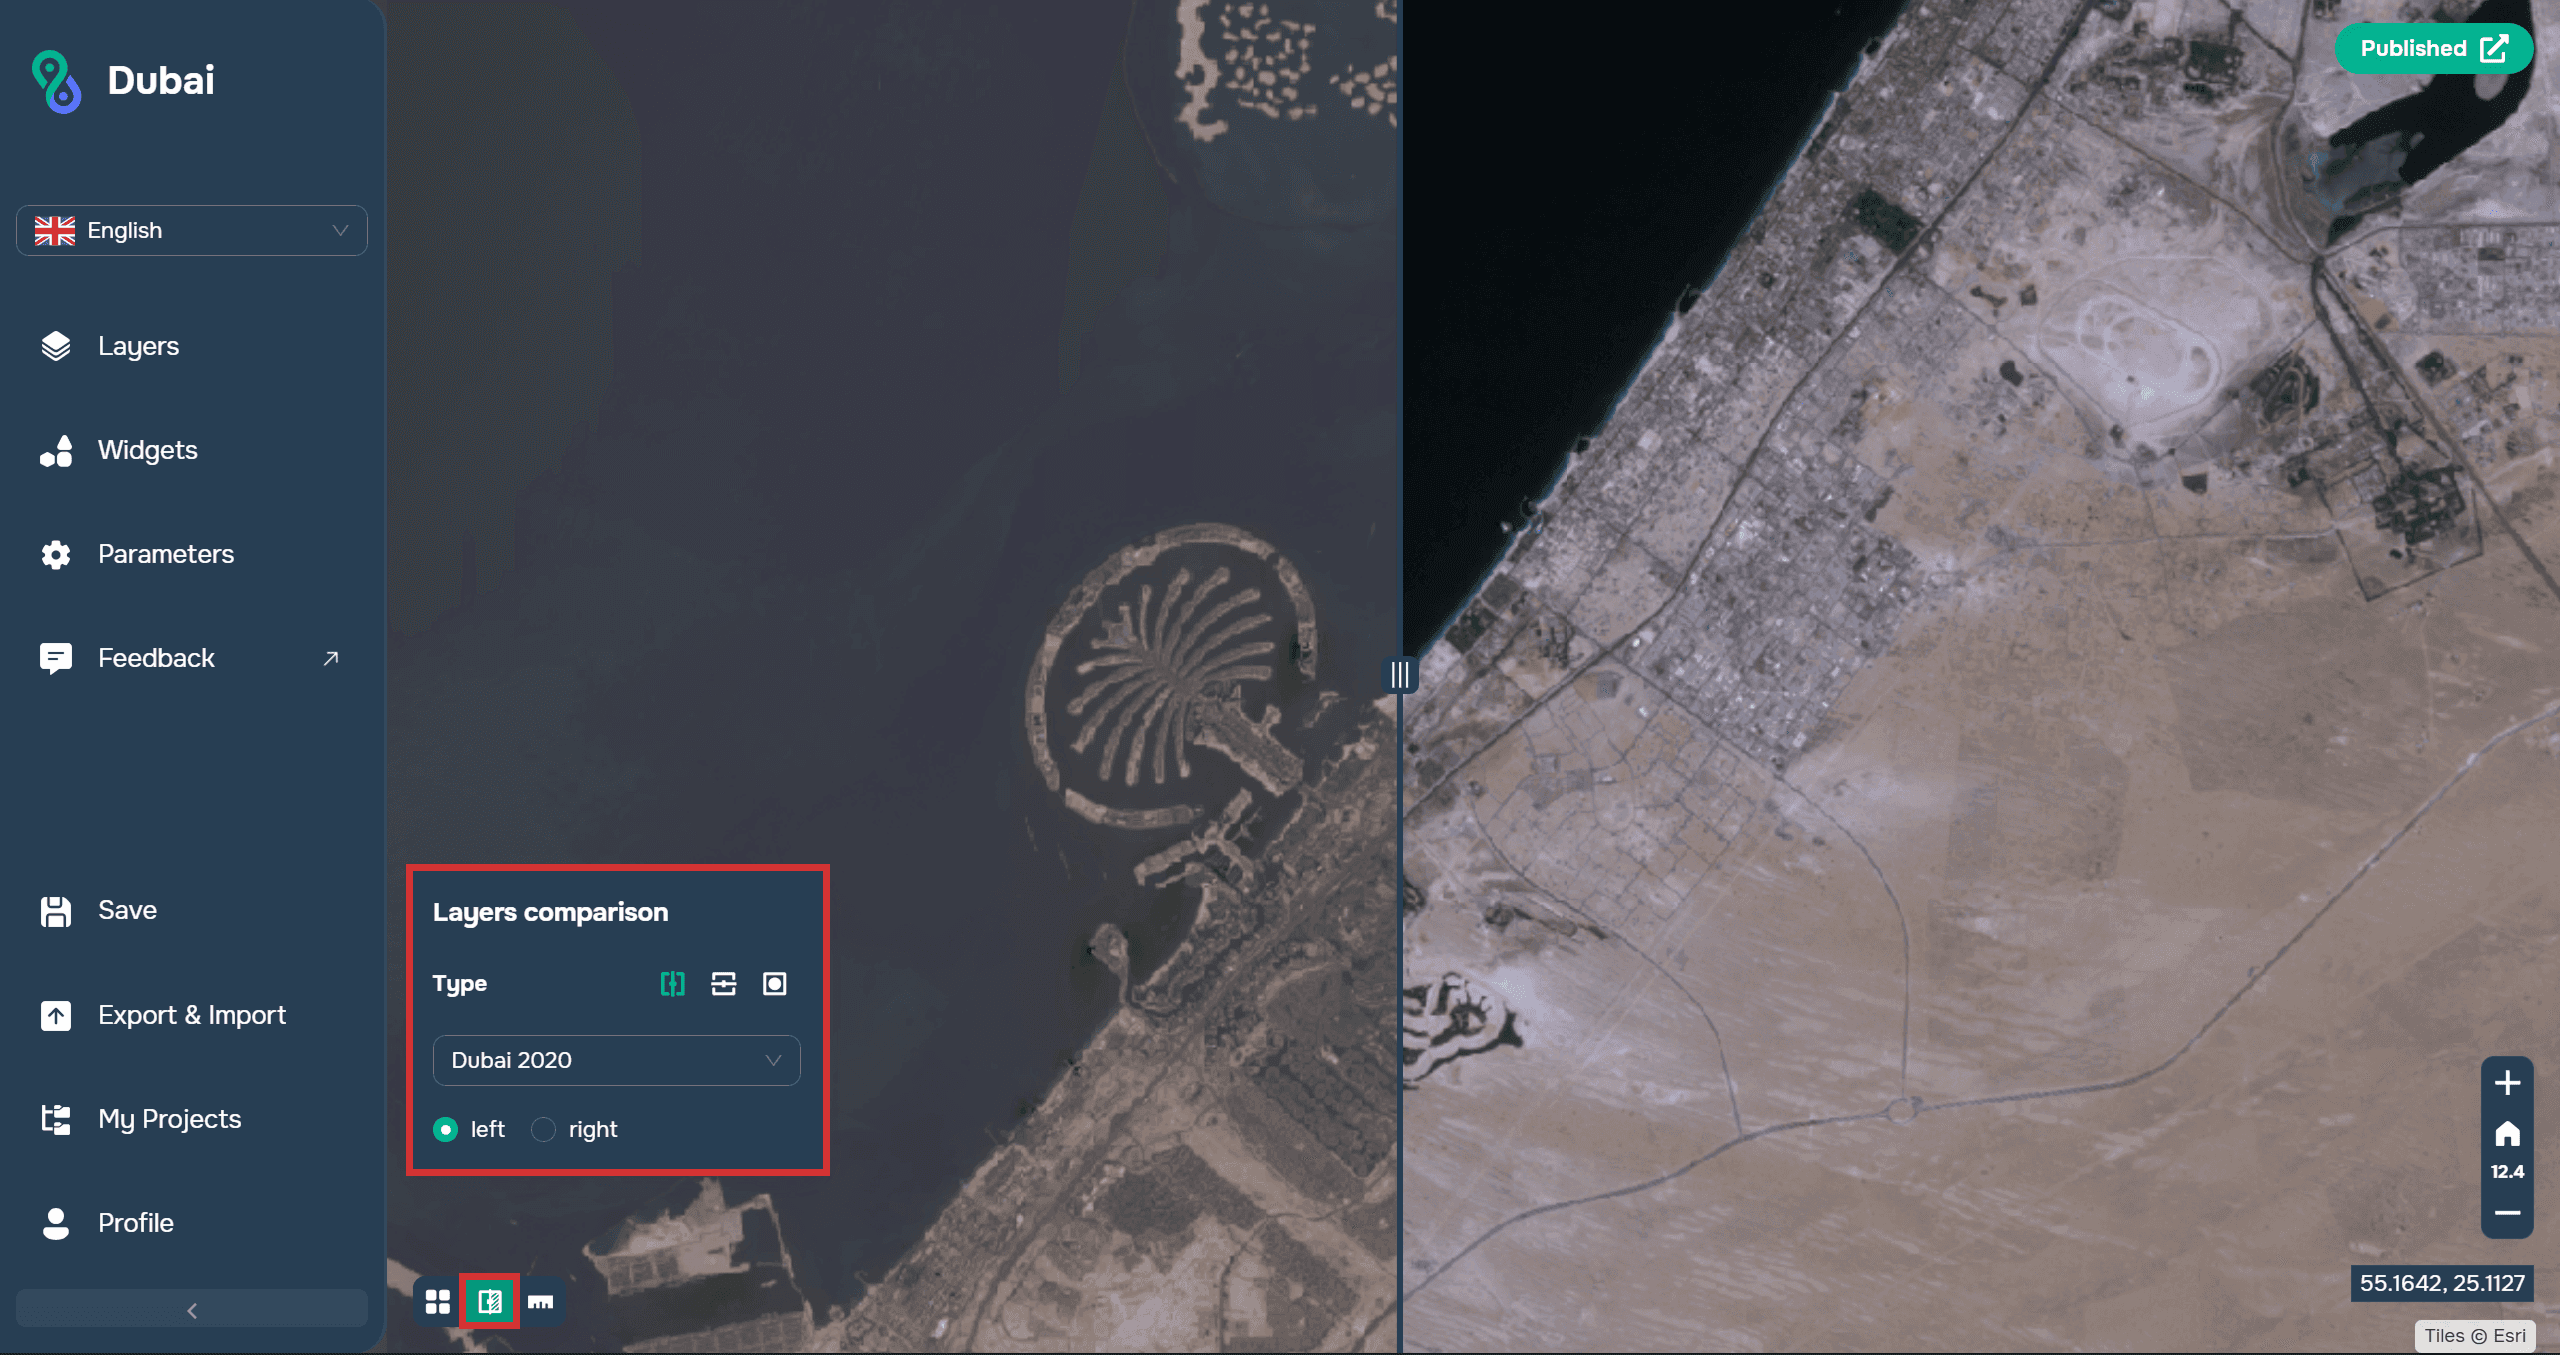
It allows you to simultaneously display two datasets and compare them using an interactive slider or other overlay modes. This approach helps you quickly identify differences between images, maps, or analytical results.
This tool is especially useful when working with Earth remote sensing data. For example, it can be used to compare satellite images from different years to analyze urban growth, coastal changes, deforestation, or the impact of natural disasters.
You can read more about the widget in the docs.
FAQ
What tasks can be solved using GISCARTA geoanalytics tools?
The platform allows you to perform spatial analysis, assess transportation accessibility, analyze terrain, compare geodata, and visualize the results in interactive dashboards.
What is the Geoprocessing widget used for?
The widget is designed to perform spatial operations such as buffering, intersection, union, generalization, and statistical analysis of geodata.
How does the Layer Comparison widget help analyze territorial change?
It allows you to compare two layers or datasets in a single map window, which is convenient for monitoring changes in urban development, natural features, and analysis results over different time periods.
Key Takeaways
GISCARTA combines spatial analysis, visualization, and geoprocessing tools in a single web platform.
Geoprocessing, Elevation Profile, and Transport Analysis widgets help automate analytical tasks and generate new spatial data.
Dashboards and Layer Comparison allow you to visually present analysis results and track territorial changes over time.


