
Modern cartography offers a variety of ways to visualize spatial data. One such tool is tile maps (or tile grid maps). They allow you to present statistical data on territories in a more visual and analytically convenient form, since all territories are represented by figures of equal area. Tile maps are often used in news publications, such as the New York Times.
What is a Tile Map?
A tile map is a method of displaying territorial units in which each region is replaced by an equally sized geometric shape: a square, hexagon, or other element of a regular grid. While the approximate relative positions of objects are preserved, the actual boundaries of the territories are not displayed.
Each object is given equal visual weight, making comparisons between territories more objective.
For example, when displaying the population of US states on a traditional map, large territories visually attract more attention, even if their populations are low. On a tile map, all regions are the same size, so the user's attention is focused solely on the data values.
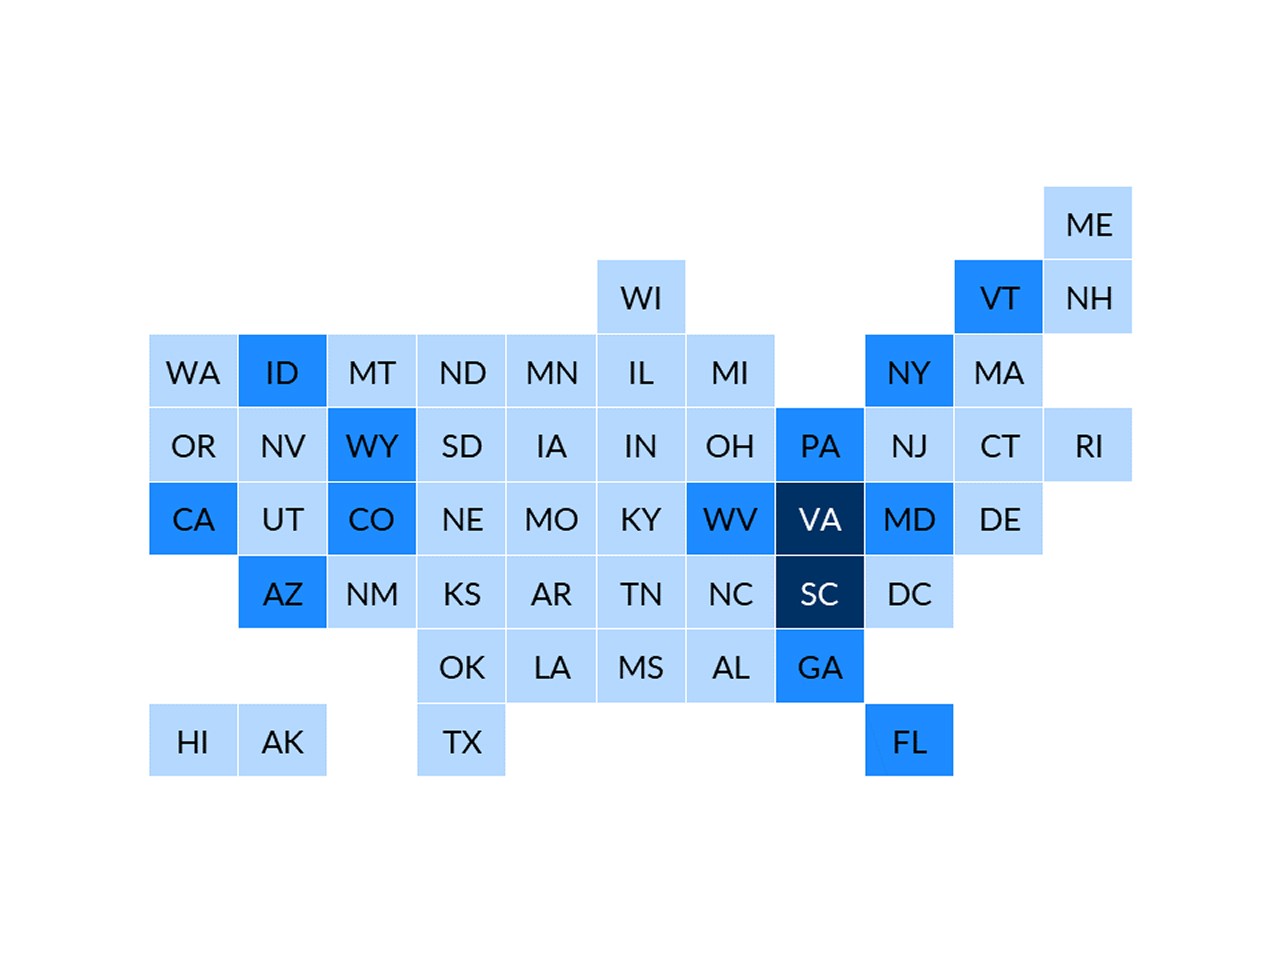
An example of a tiled map of the US states
Why Tile Maps Appeared
Traditional thematic maps are well suited for depicting the spatial distribution of phenomena, but they have several limitations. Small areas can become virtually invisible, while large regions, conversely, become visually dominant.
This problem is especially noticeable when analyzing socioeconomic indicators, election results, demographic statistics, or market research. To address this issue, data visualization specialists began using tile maps, which combine geographic context with infographic principles.
This method gained widespread adoption with the advent of algorithms for automatically generating tile maps, which preserve the proximity of territories and their relative positions.
Advantages of Tile Maps
The main advantage of tile maps is their simplified information comprehension.
Firstly, all regions are displayed using identical elements. The user doesn't have to account for differences in the area of objects, making comparisons much easier.
Secondly, even the smallest areas remain clearly visible. On a traditional map, such objects can get lost among their larger neighbors, whereas on a tile map, each region receives equal space to display information.
Thirdly, tile maps are ideal for digital dashboards and analytical dashboards. Their compact structure makes them convenient to use in web applications and BI systems.
Disadvantages of the method
Despite their advantages, tiled maps cannot completely replace traditional cartographic methods. The main drawback is the loss of the true geometry of objects. The user cannot see the actual boundaries of territories and cannot assess their area or shape. It is also not always possible to preserve the exact proximity of all regions. Some territories may shift relative to their actual positions.
Therefore, tiled maps are best used in situations where the primary objective is to compare indicators between territories rather than analyze their geographic shape.
Main Types of Tile Maps
Square tile maps are the most common. They are easy to construct and well suited for most data visualization tasks.
Another popular option is hexagonal maps. Due to the structural features of the hexagonal grid, they allow for a more natural representation of adjacent territories and are often used in geoanalytics. Triangular or combined maps are less common and are used in specialized research and design projects.

An example of a tiled map in hexagons
Where are tile maps used?
Today, tile maps can be found in many fields. In demographic studies, they are used to display population size, migration, and age structure.
In socioeconomic analysis, they are used to visualize income, unemployment, investment activity, and other indicators. During elections, tile maps help display voting results without distortions due to territorial size.
FAQ
What is a tile map?
A tile map is a visualization method where geographic regions are represented by equally sized shapes, such as squares or hexagons, instead of their actual boundaries.
What are the benefits of tile maps?
Tile maps make it easier to compare data between regions, prevent large territories from dominating the visualization, and keep small regions visible.
What are the limitations of tile maps?
They do not preserve the true shape and size of geographic areas and may slightly distort the spatial relationships between regions.
Key Takeaways
Tile maps represent territories using equal-sized grid cells, improving data comparison.
They are commonly used in demographics, elections, business intelligence, and socioeconomic analysis.
Tile maps prioritize statistical clarity over geographic accuracy.


