Widget settings
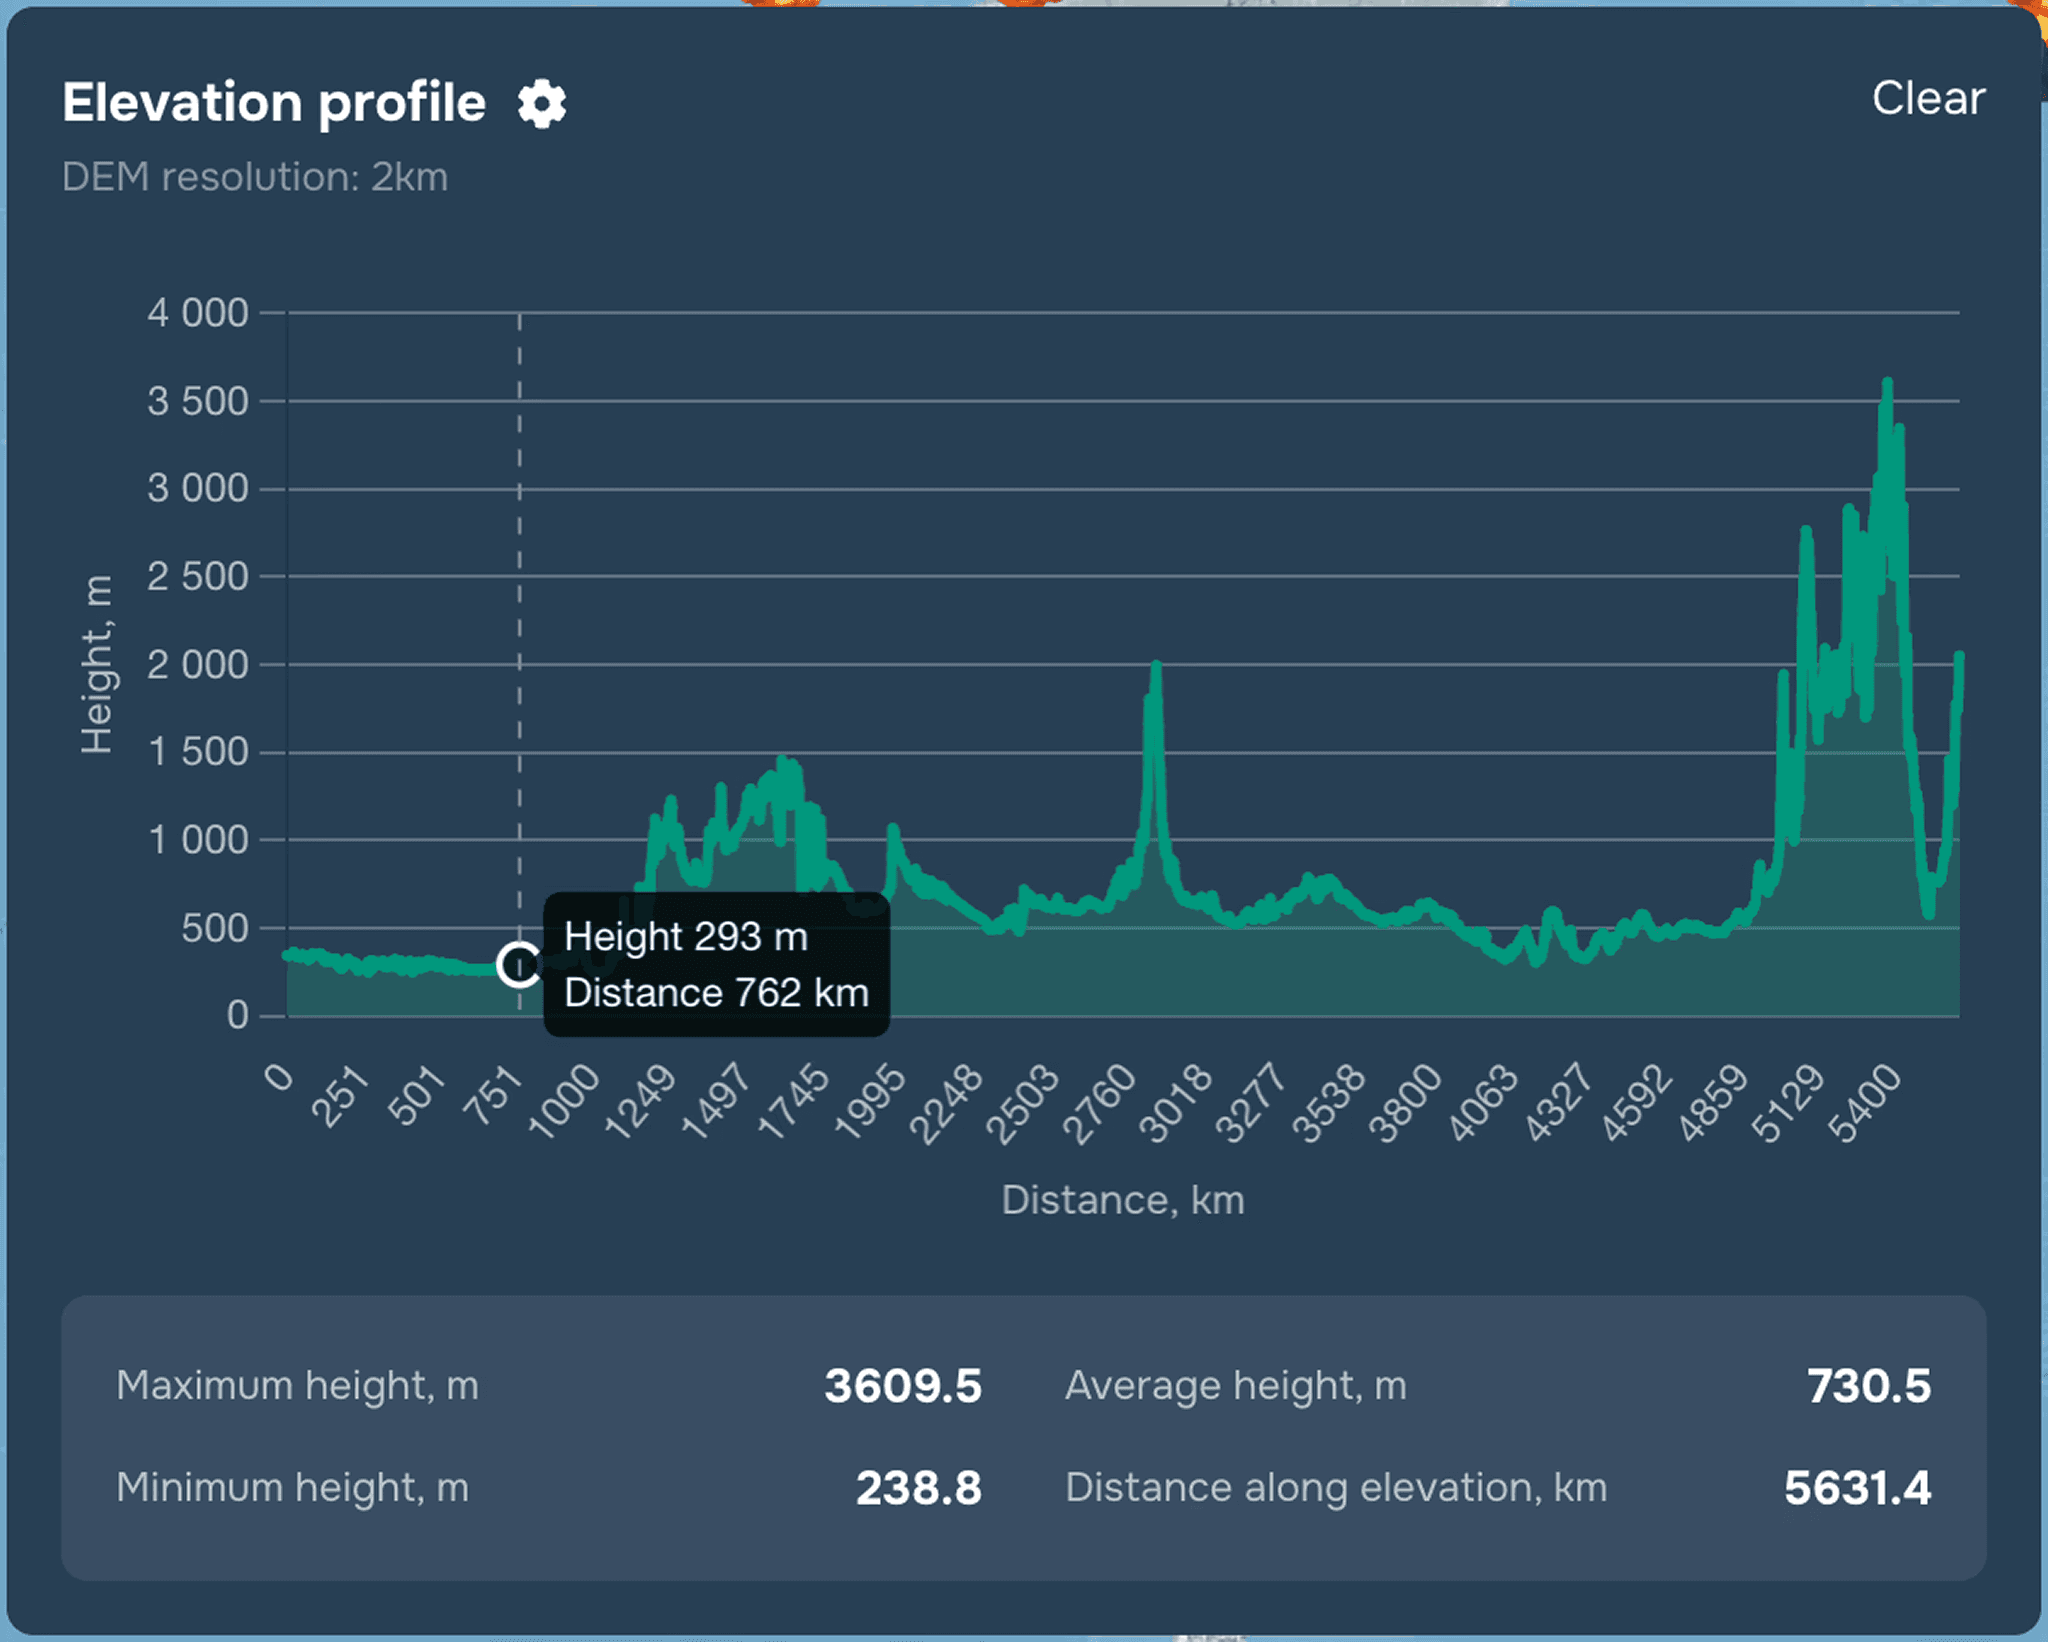
To customise the widget, click on the three dots next to the widget name and select "Configure or click on the settings icon next to the widget name." Then you can change the color of the line and fill of the elevation profile chart, select the units of measurement for the graph’s axes, as well as add or exclude statistics on heights along the profile line (see Figure 1).
Widget description
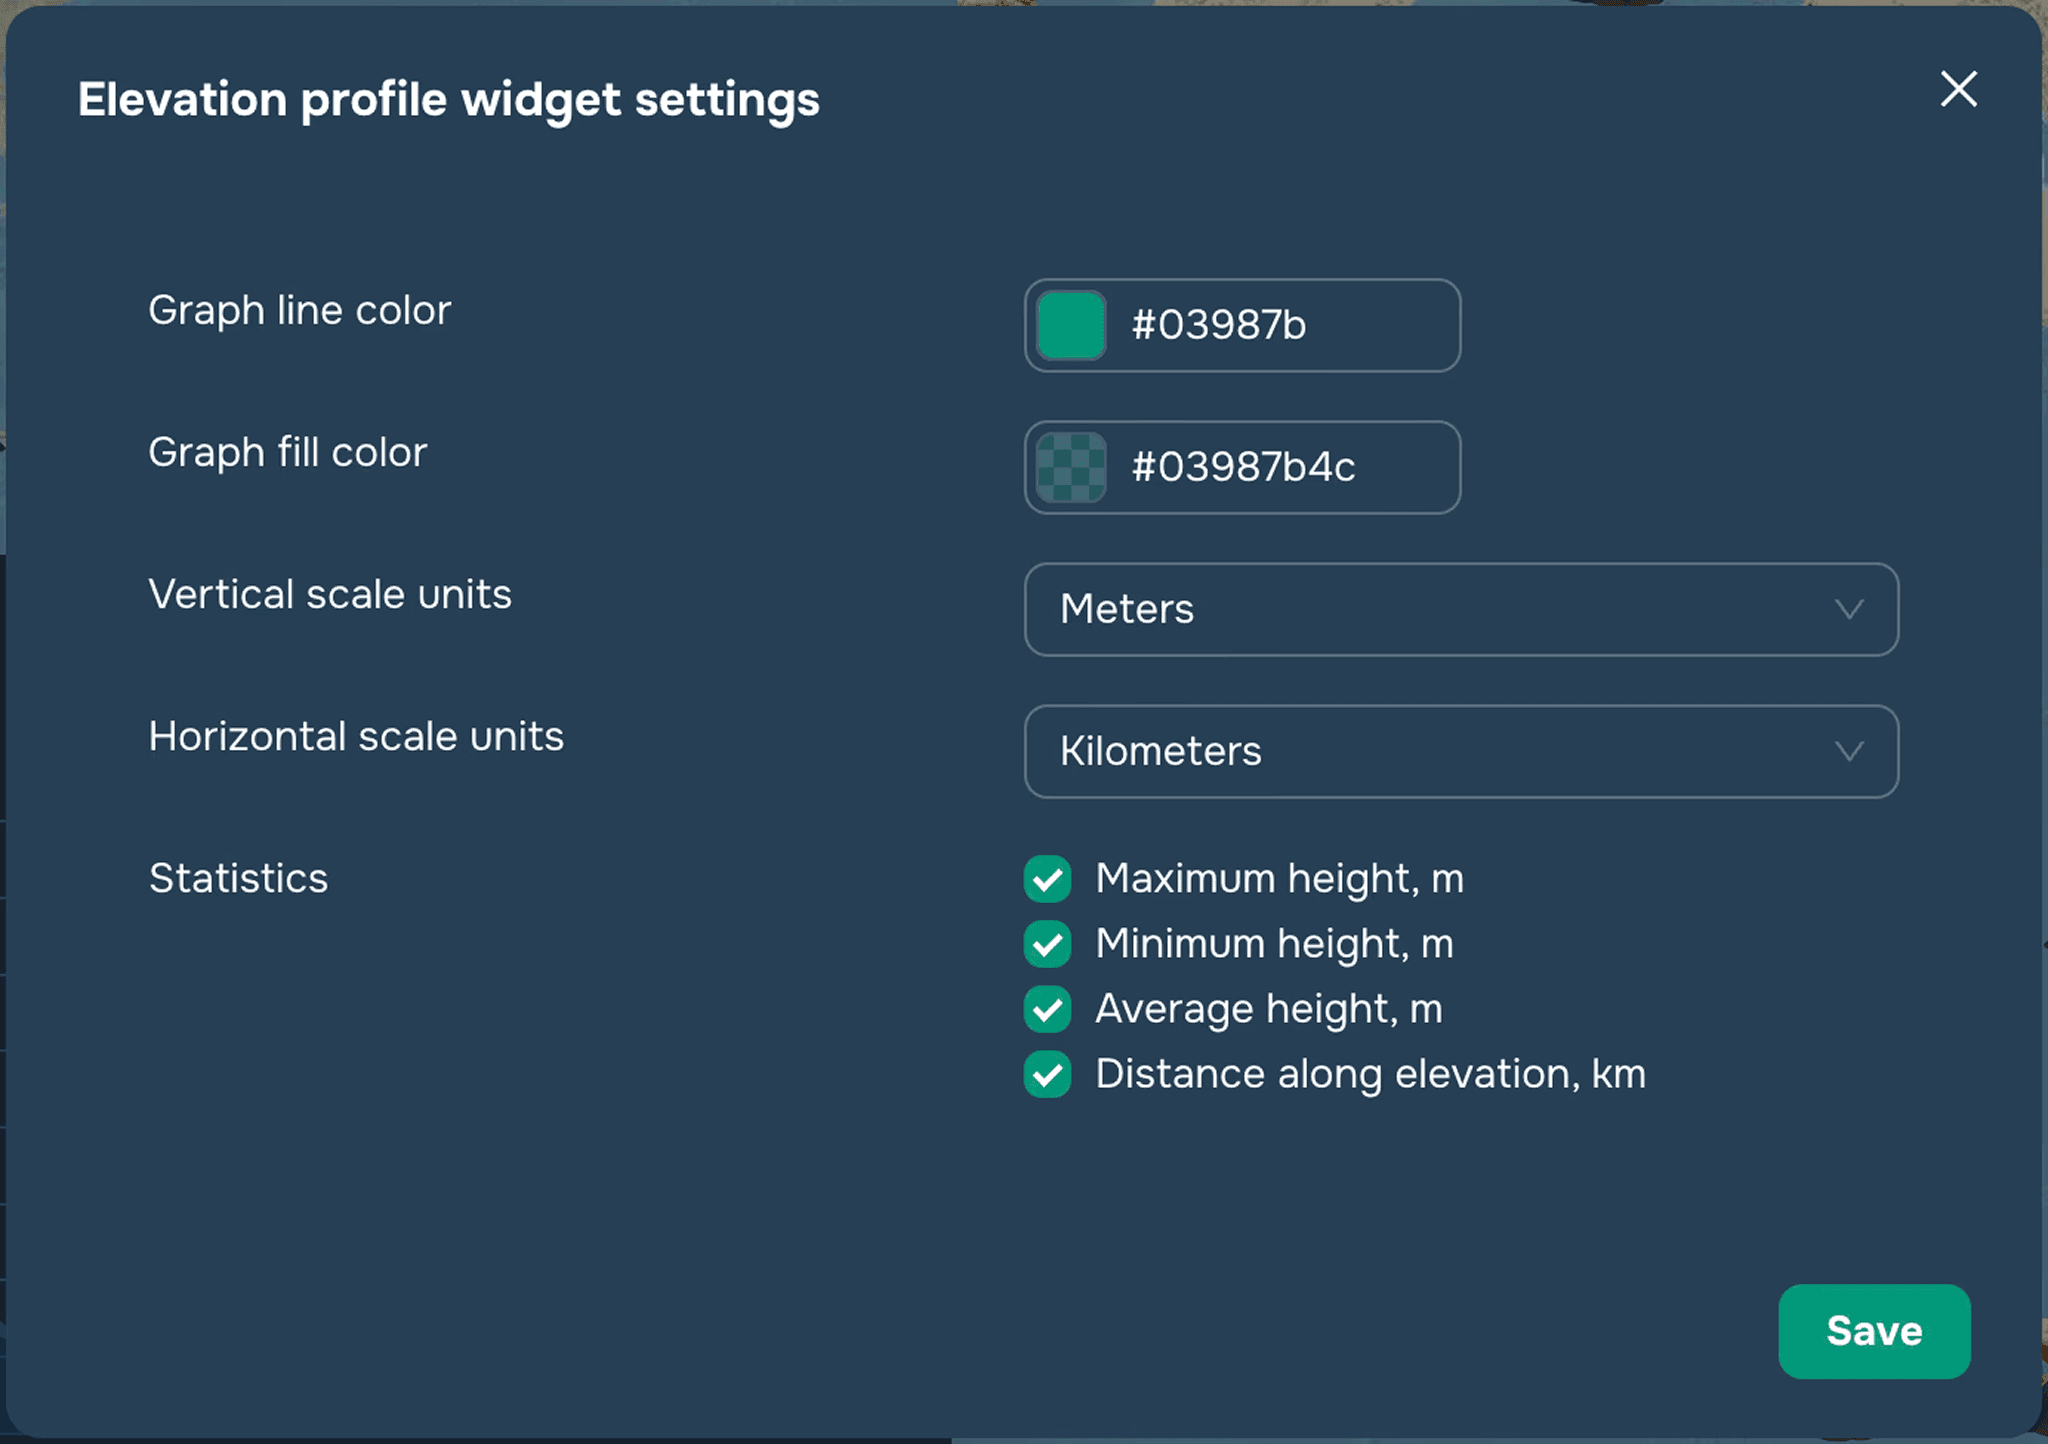
This widget allows the end user to draw a profile line on the terrain (either a broken line by successive clicks on the map, or a curve by clicking and holding the shift key) and get a graph of heights plotted along the profile line (see Figure 2). When you hover the cursor over the graph, the height of the area will be displayed, and the corresponding point on the profile line will be marked on the map. The constructed profile line on the map can be edited by dragging the corresponding line vertices.