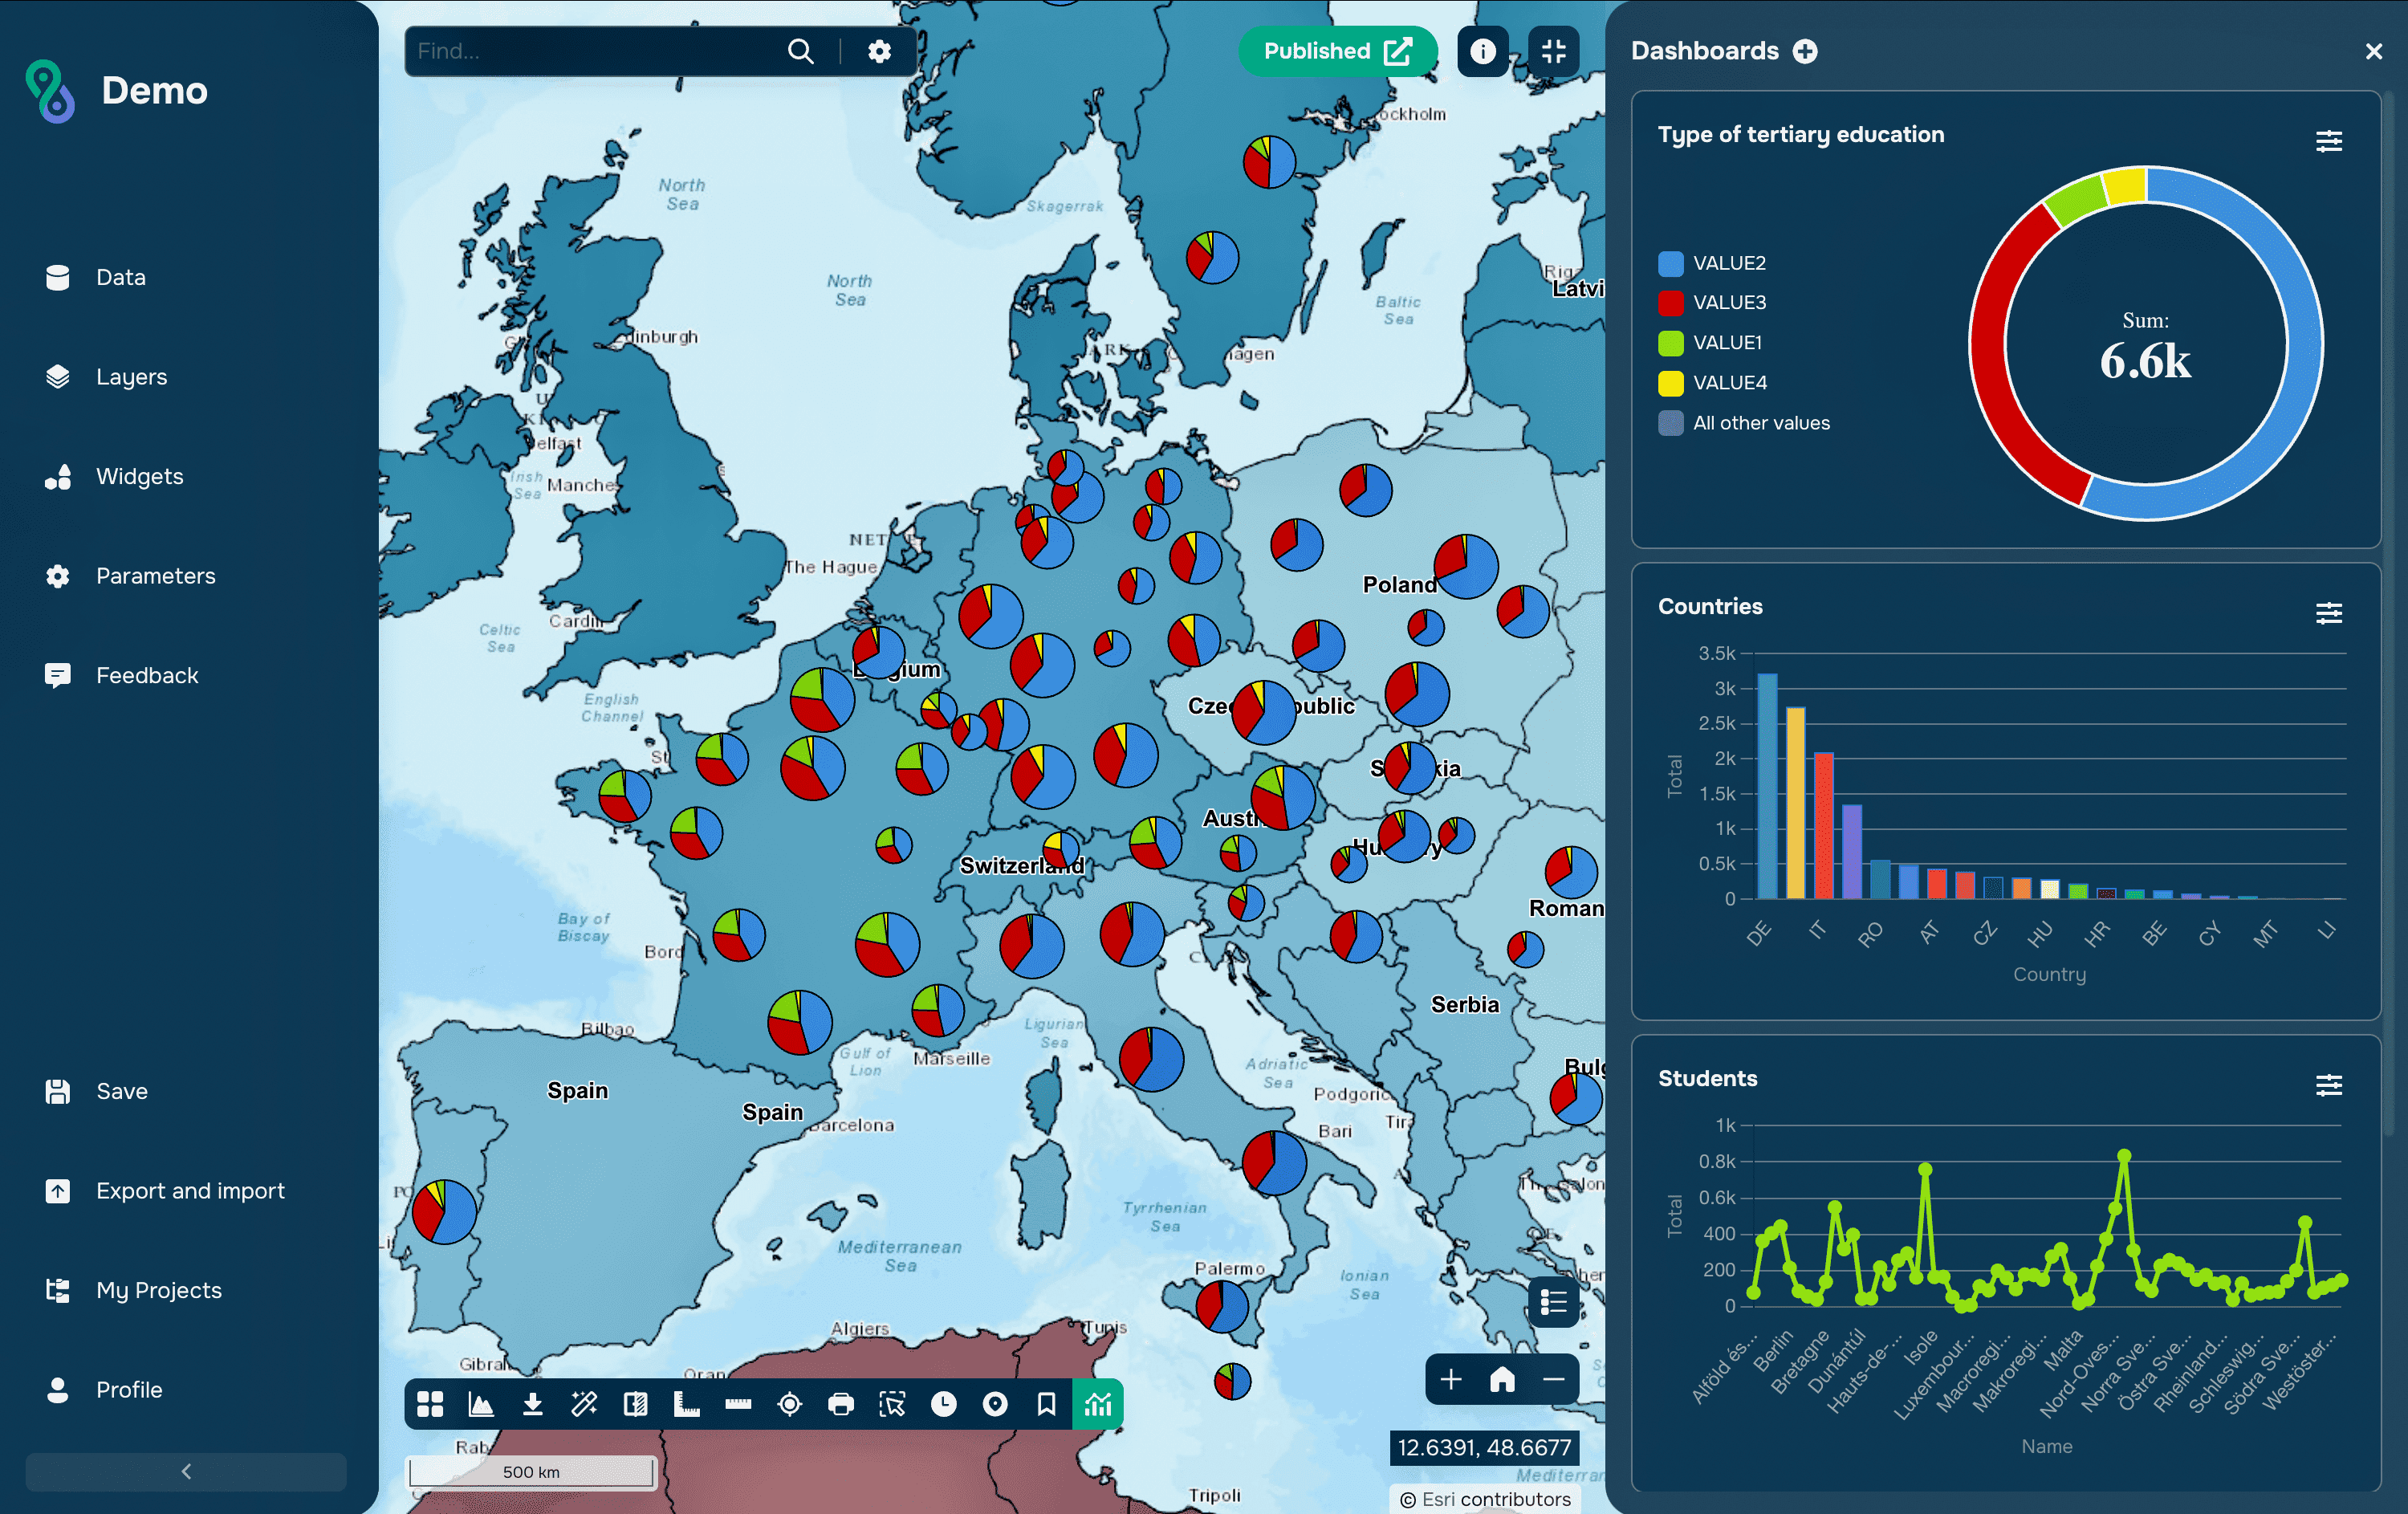
When working with spatial data, you often need to quickly select features of interest and obtain summary information about them. GISCARTA offers the Selection widget for these tasks.
To begin using the widget, user has to enable it in the Widgets section.

Selection can be accomplished in several ways:
by clicking on an object
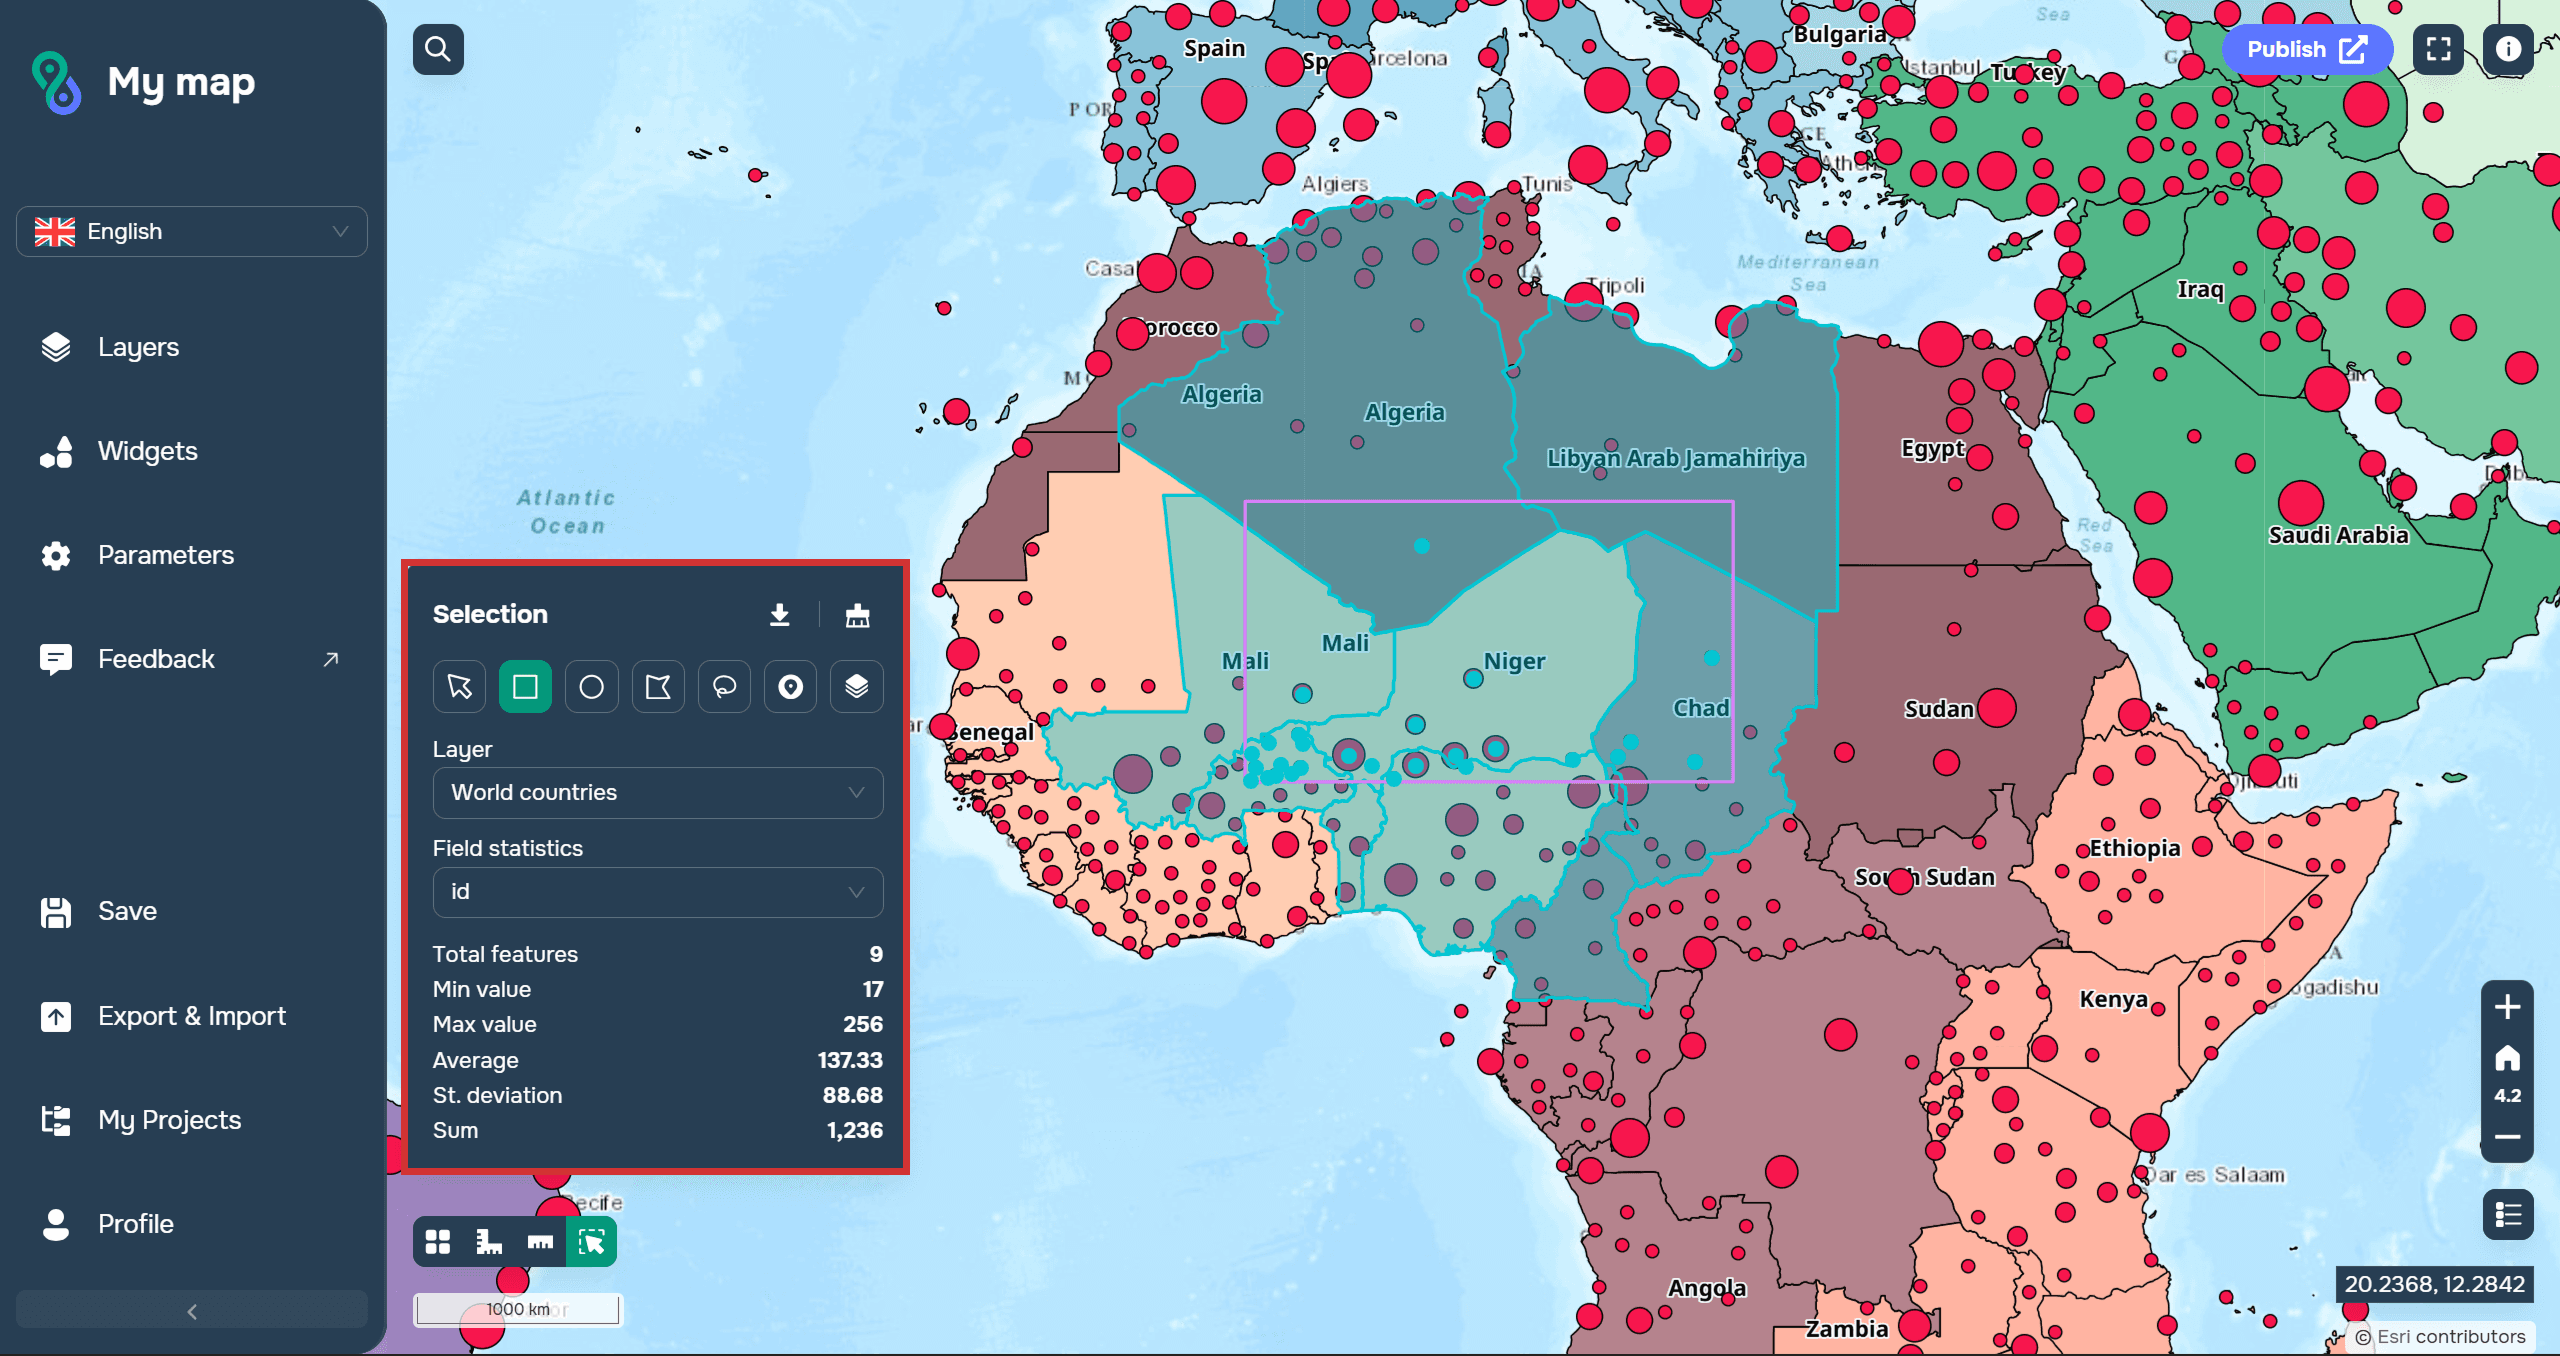
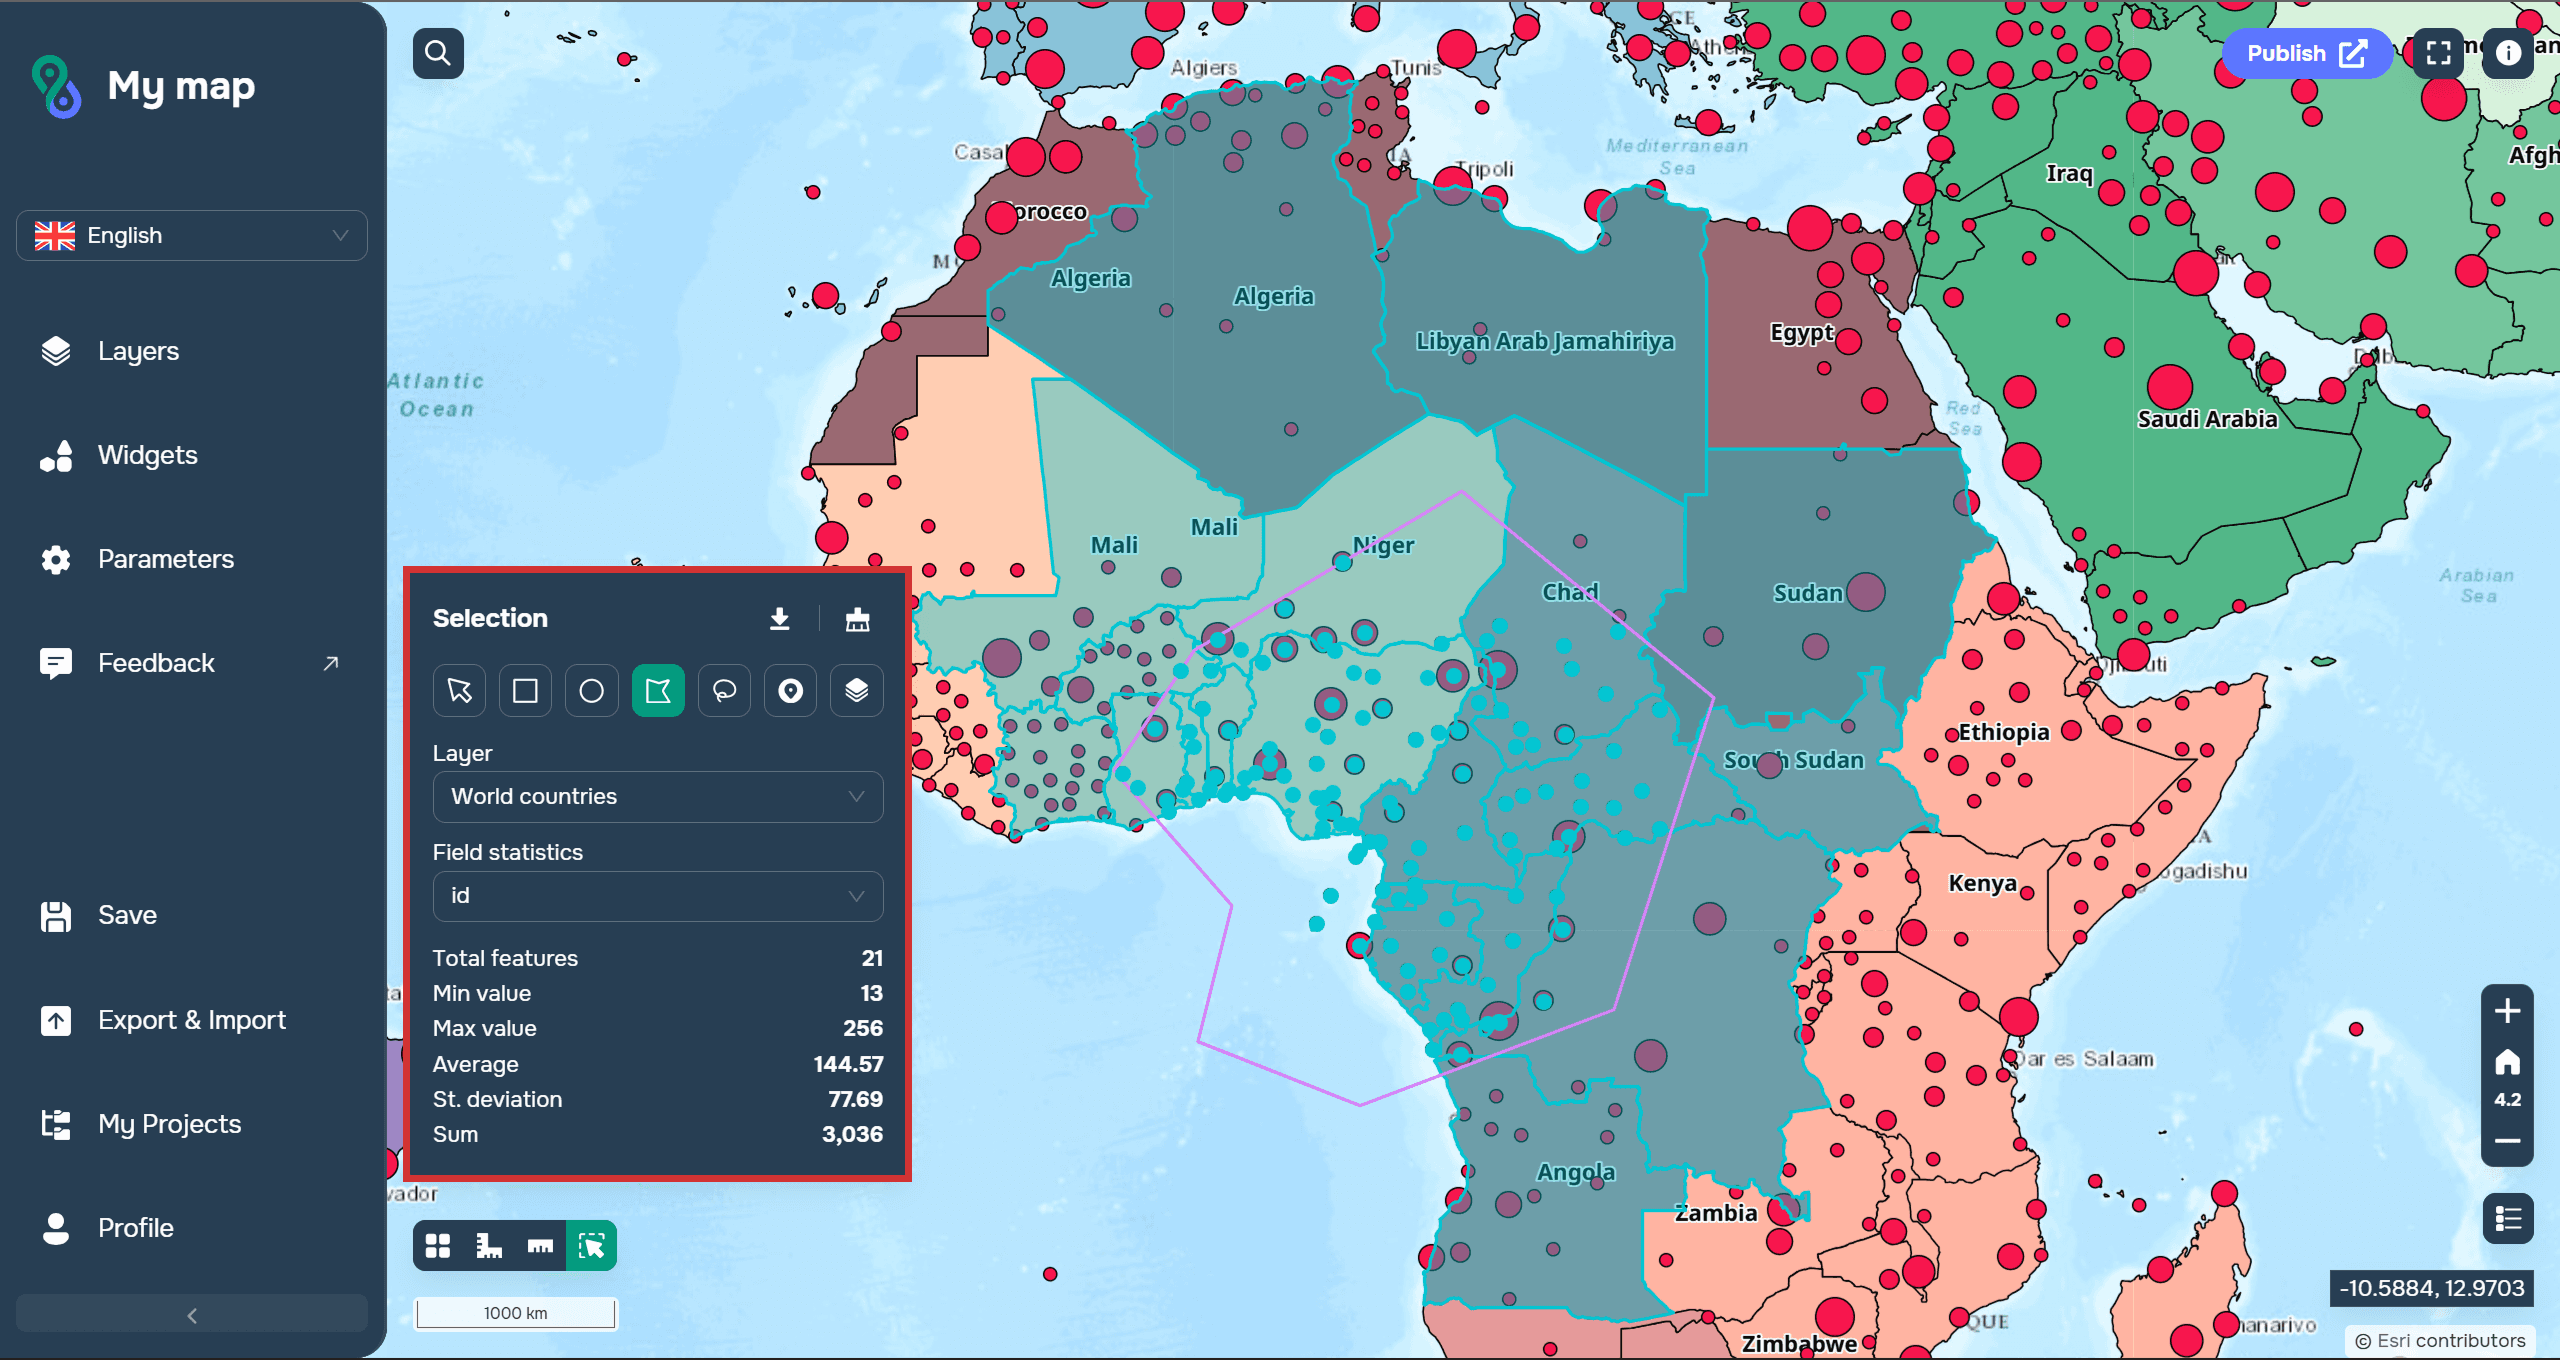
by constructing geometric shapes on the map
based on transportation accessibility zones
based on other layers

Let's look at each option separately.
Selection by clicking on an object
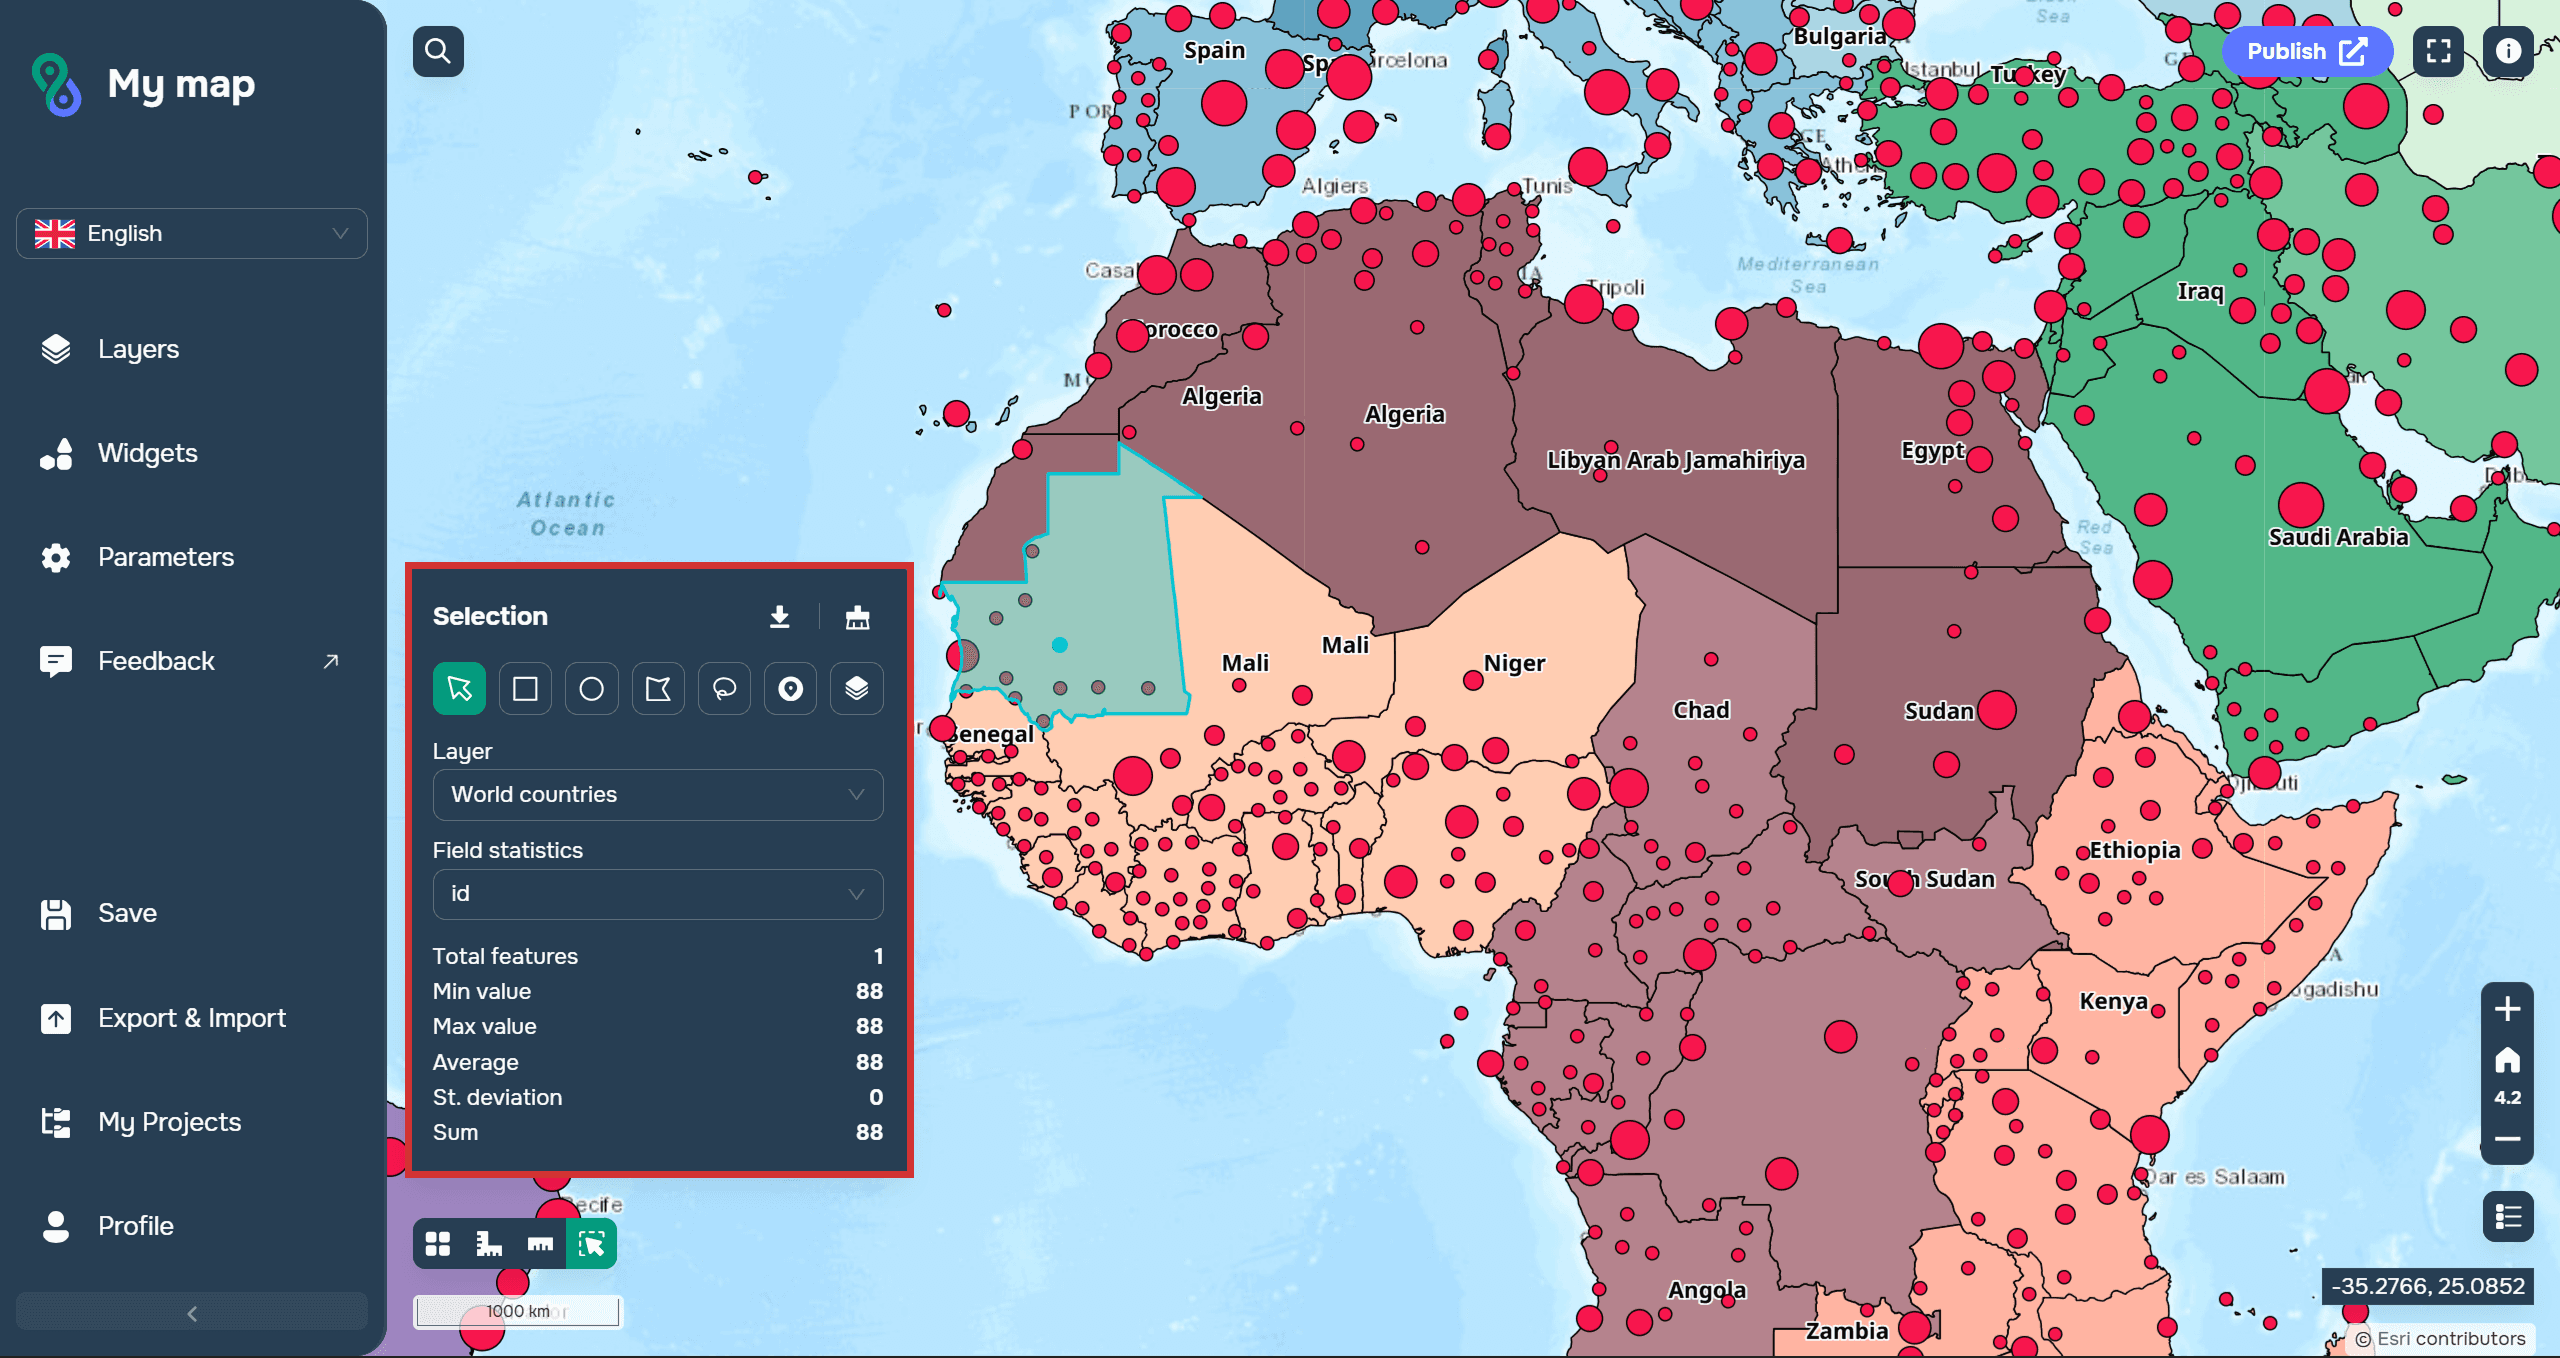
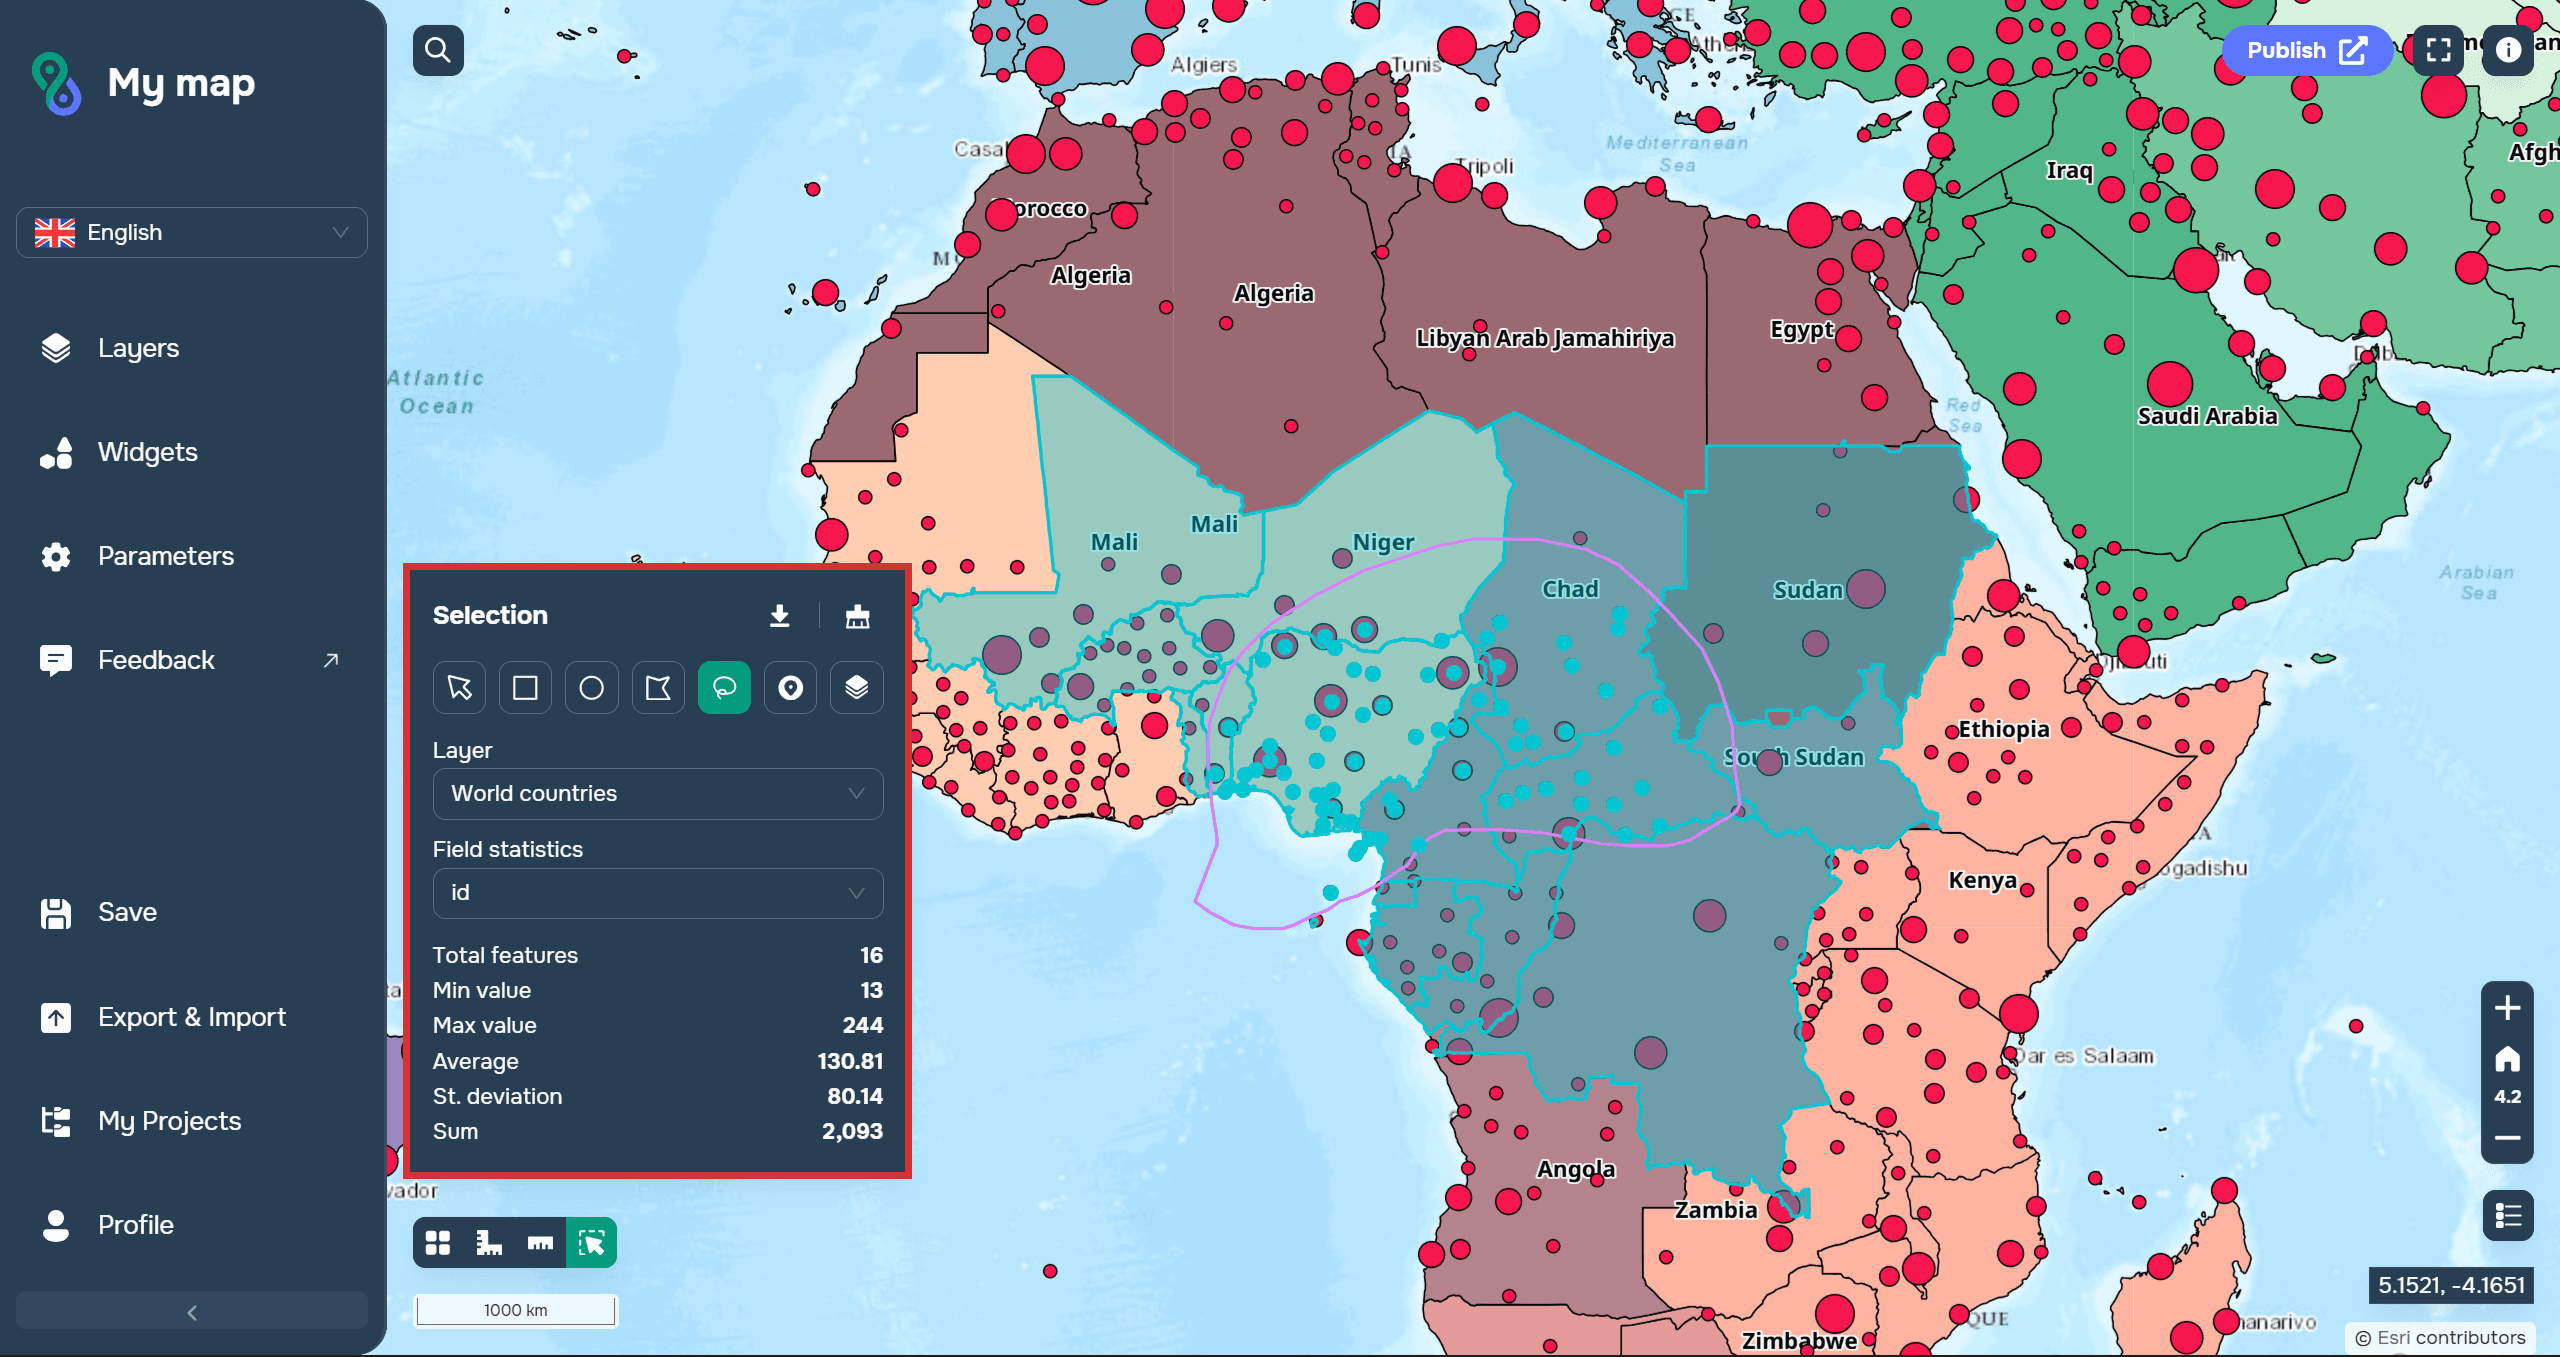
Basic statistics for this object will be available in the widget window:
number of objects
minimum/maximum value
average value
standard deviation
sum
Sampling using geometric shapes

Selection based on constructed isochrones
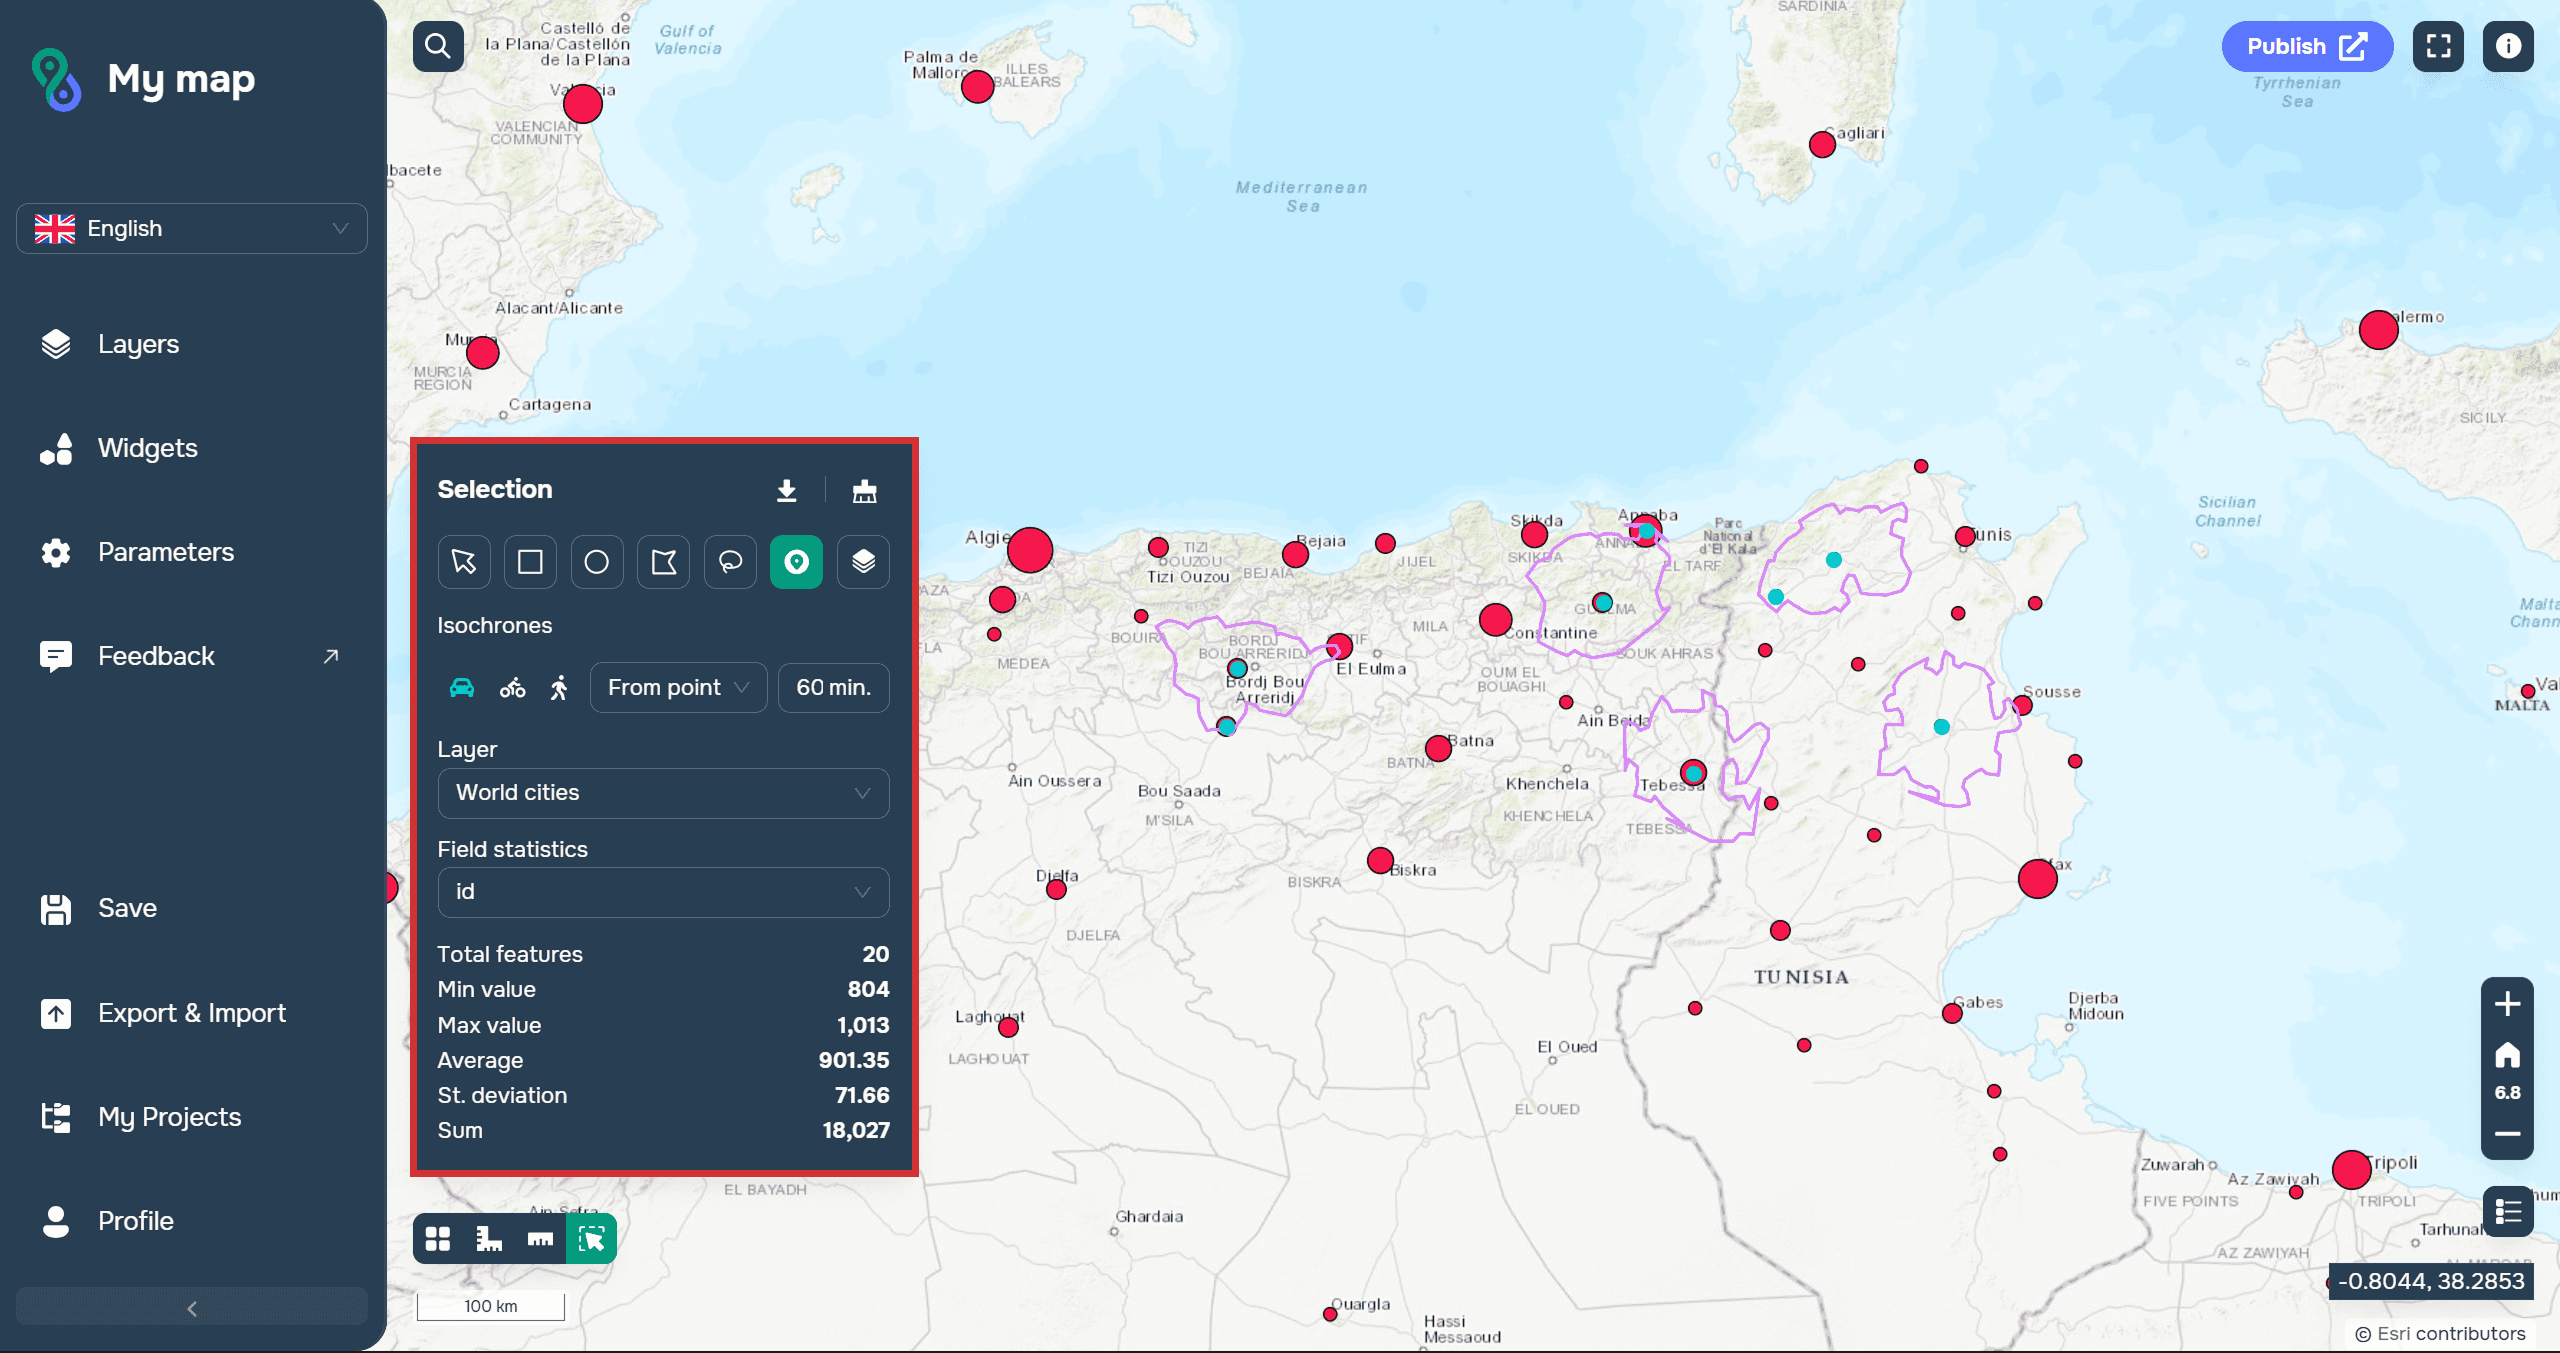
You can create pedestrian, bicycle, and vehicle isochrones from a point or to a selected point.
Selecting by another layer
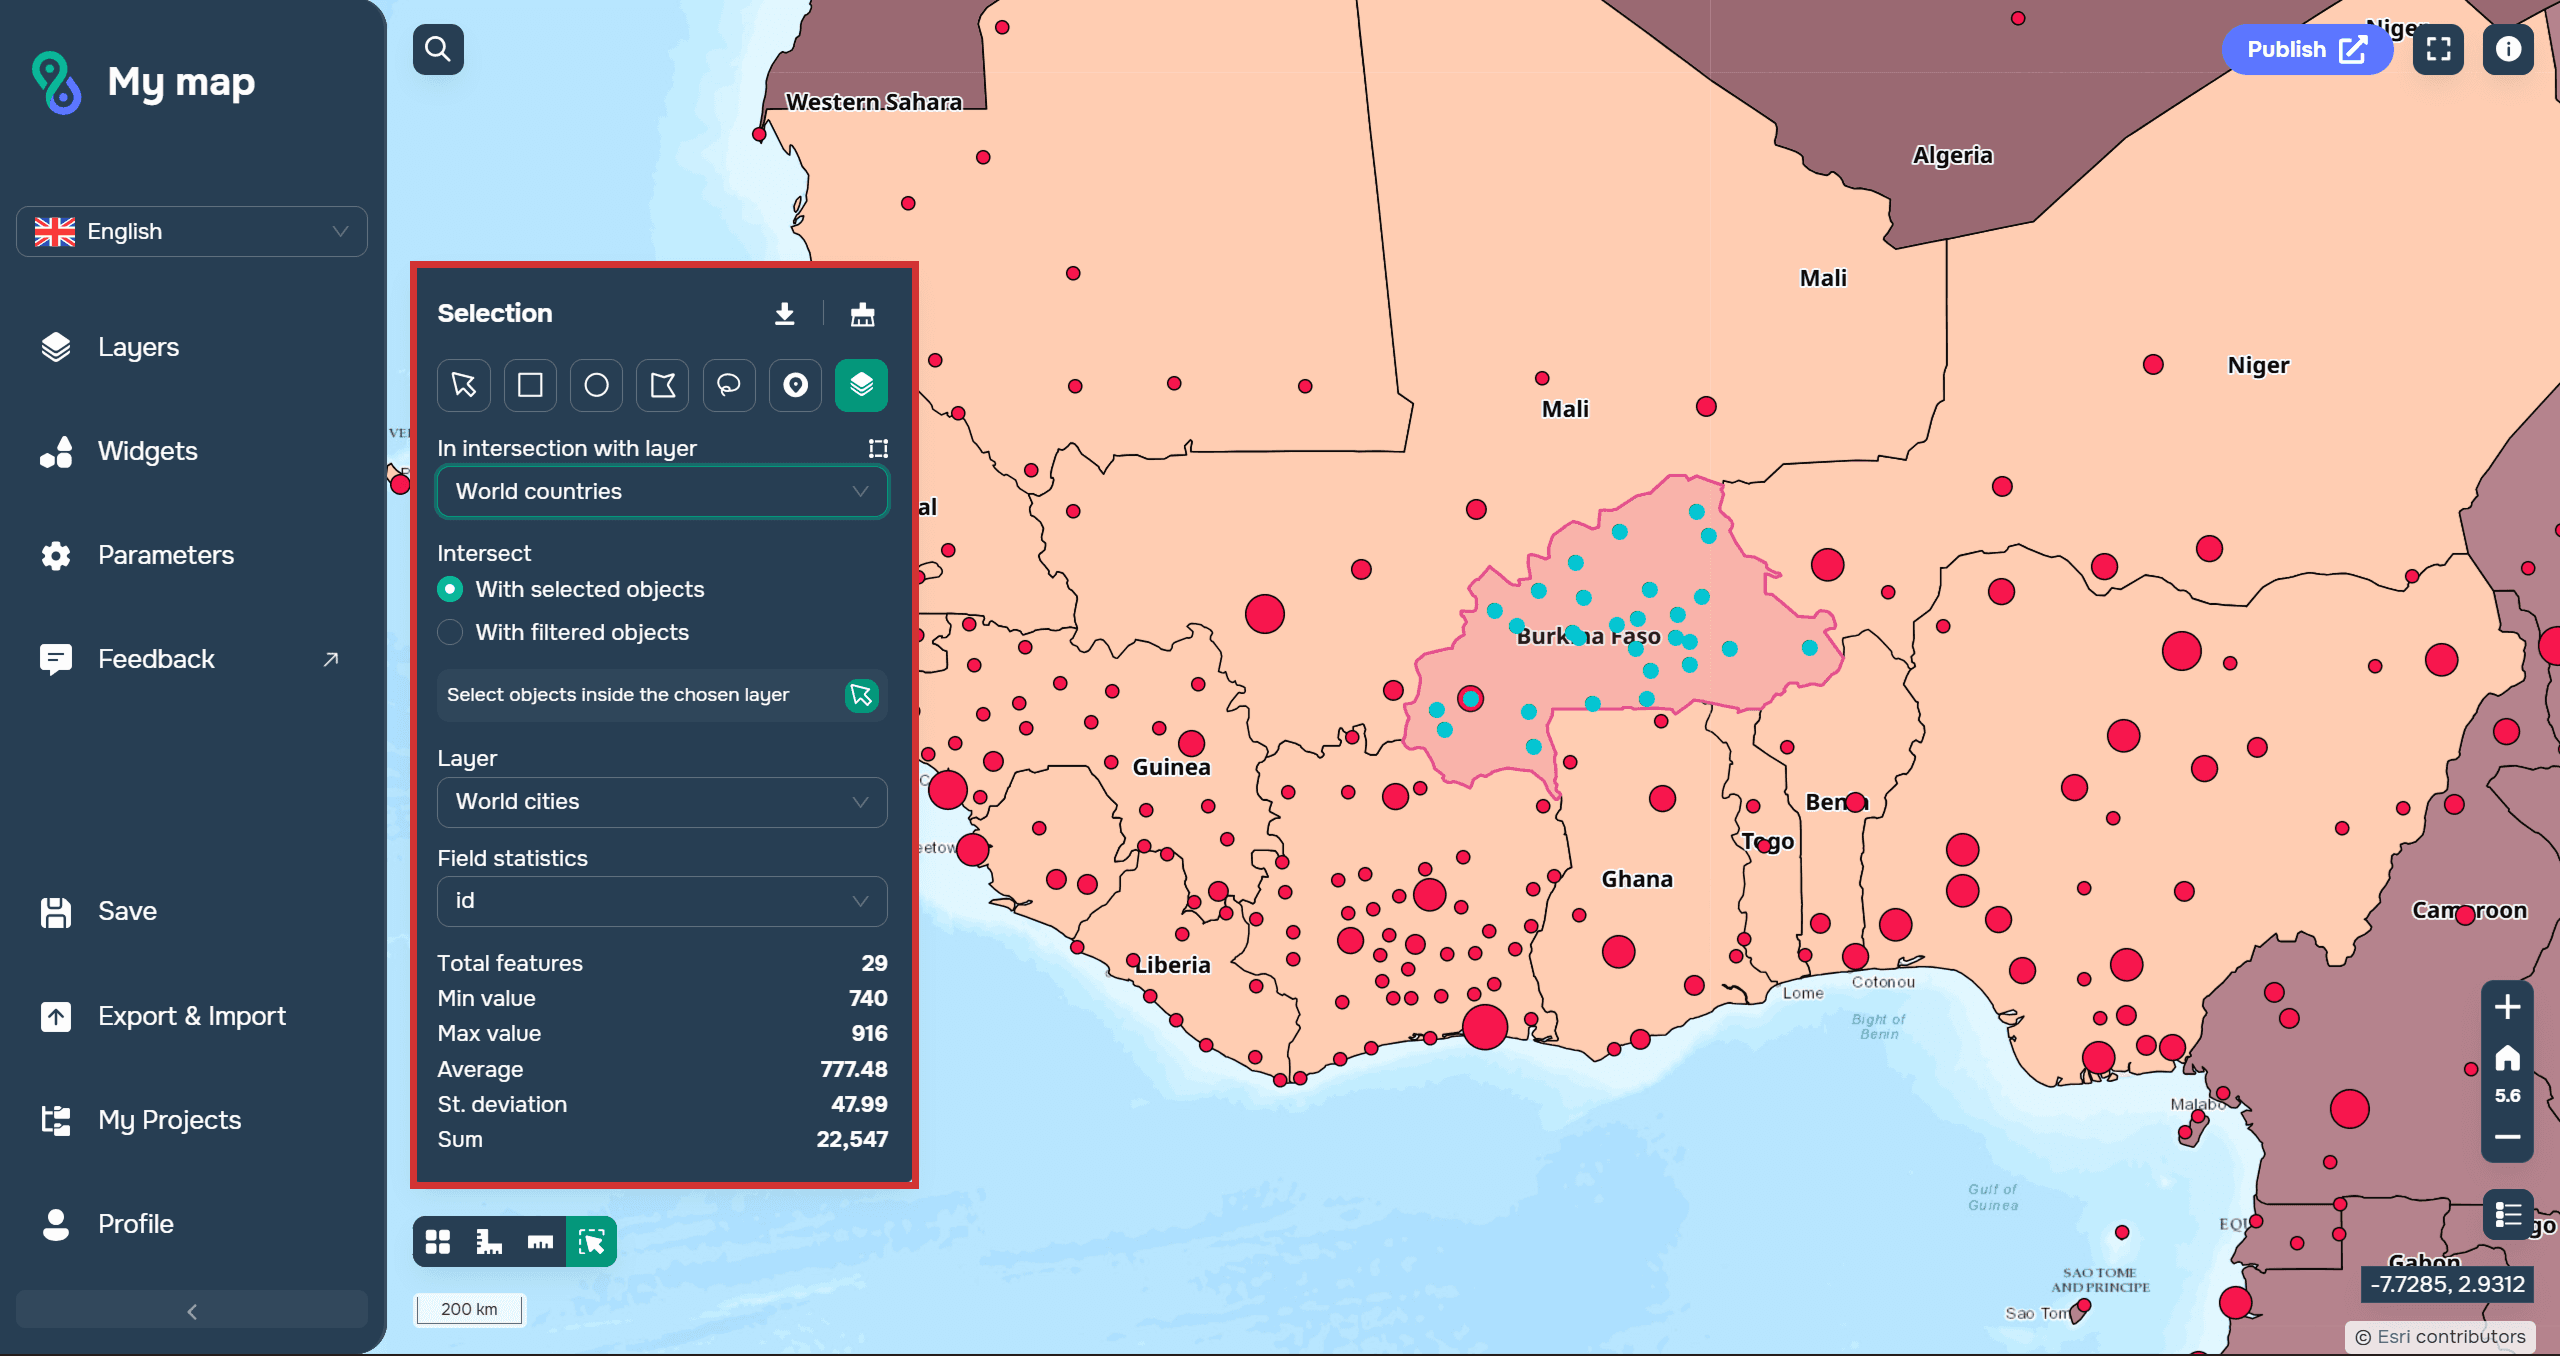
User has to select the layer to be sampled. Next, user has to choose which objects to intersect the layer with: the selected ones or the filtered ones.
The sample statistics are the same in all cases.
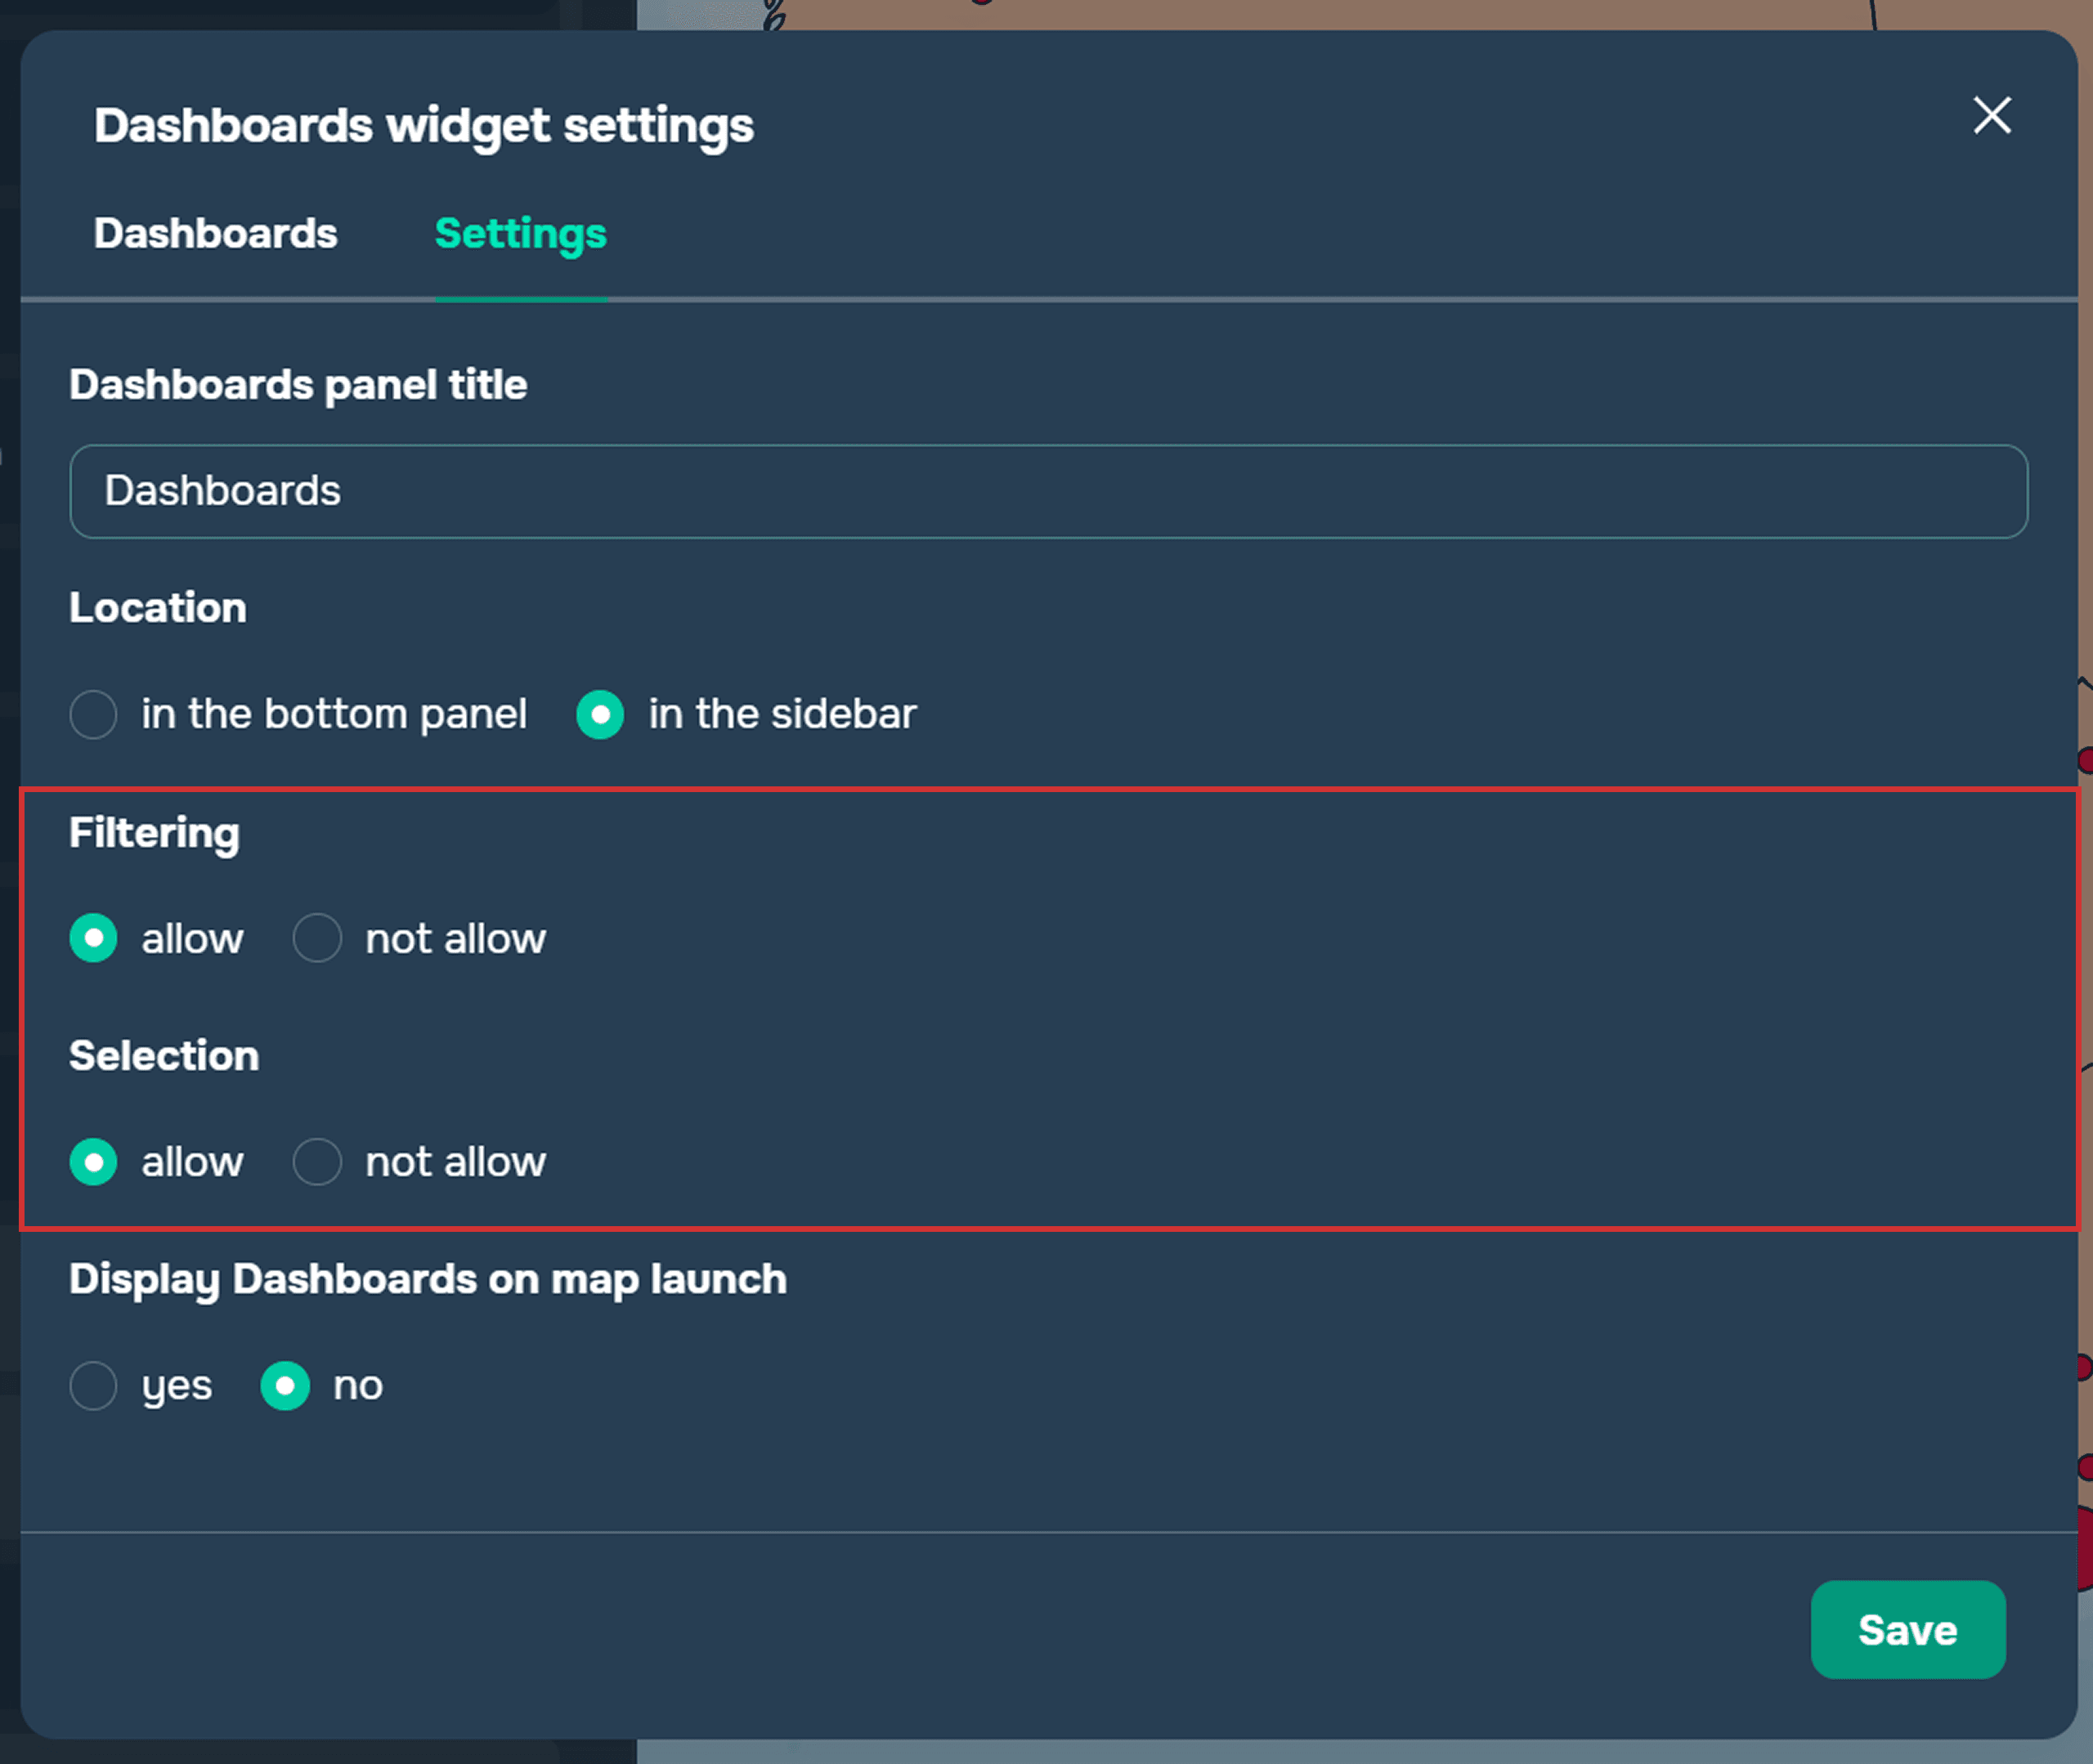
It's also worth noting that the sample affects the dashboards built on these layers. This means that dashboards will change dynamically when using the widget.
For the Selection widget to affect Dashboards, user has to enable the allow button in the widget settings opposite Selection.

Additionally, sample results can be exported to popular formats, including XLSX, GeoJSON, and SHP. This simplifies further data processing.
You can learn more about the widget on our YouTube channel.