The transport analysis widget on the GISСARTA platform allows you to create routes between points, as well as isochrones reflecting the accessibility of an object.
Isochrones and shortest routes are necessary in analytics to understand the availability zones of certain infrastructure facilities.
More information about how the transport analysis widget works can be found on our YouTube channel.
Before using the widget, you must enable its availability in the sidebar menu under Widgets.
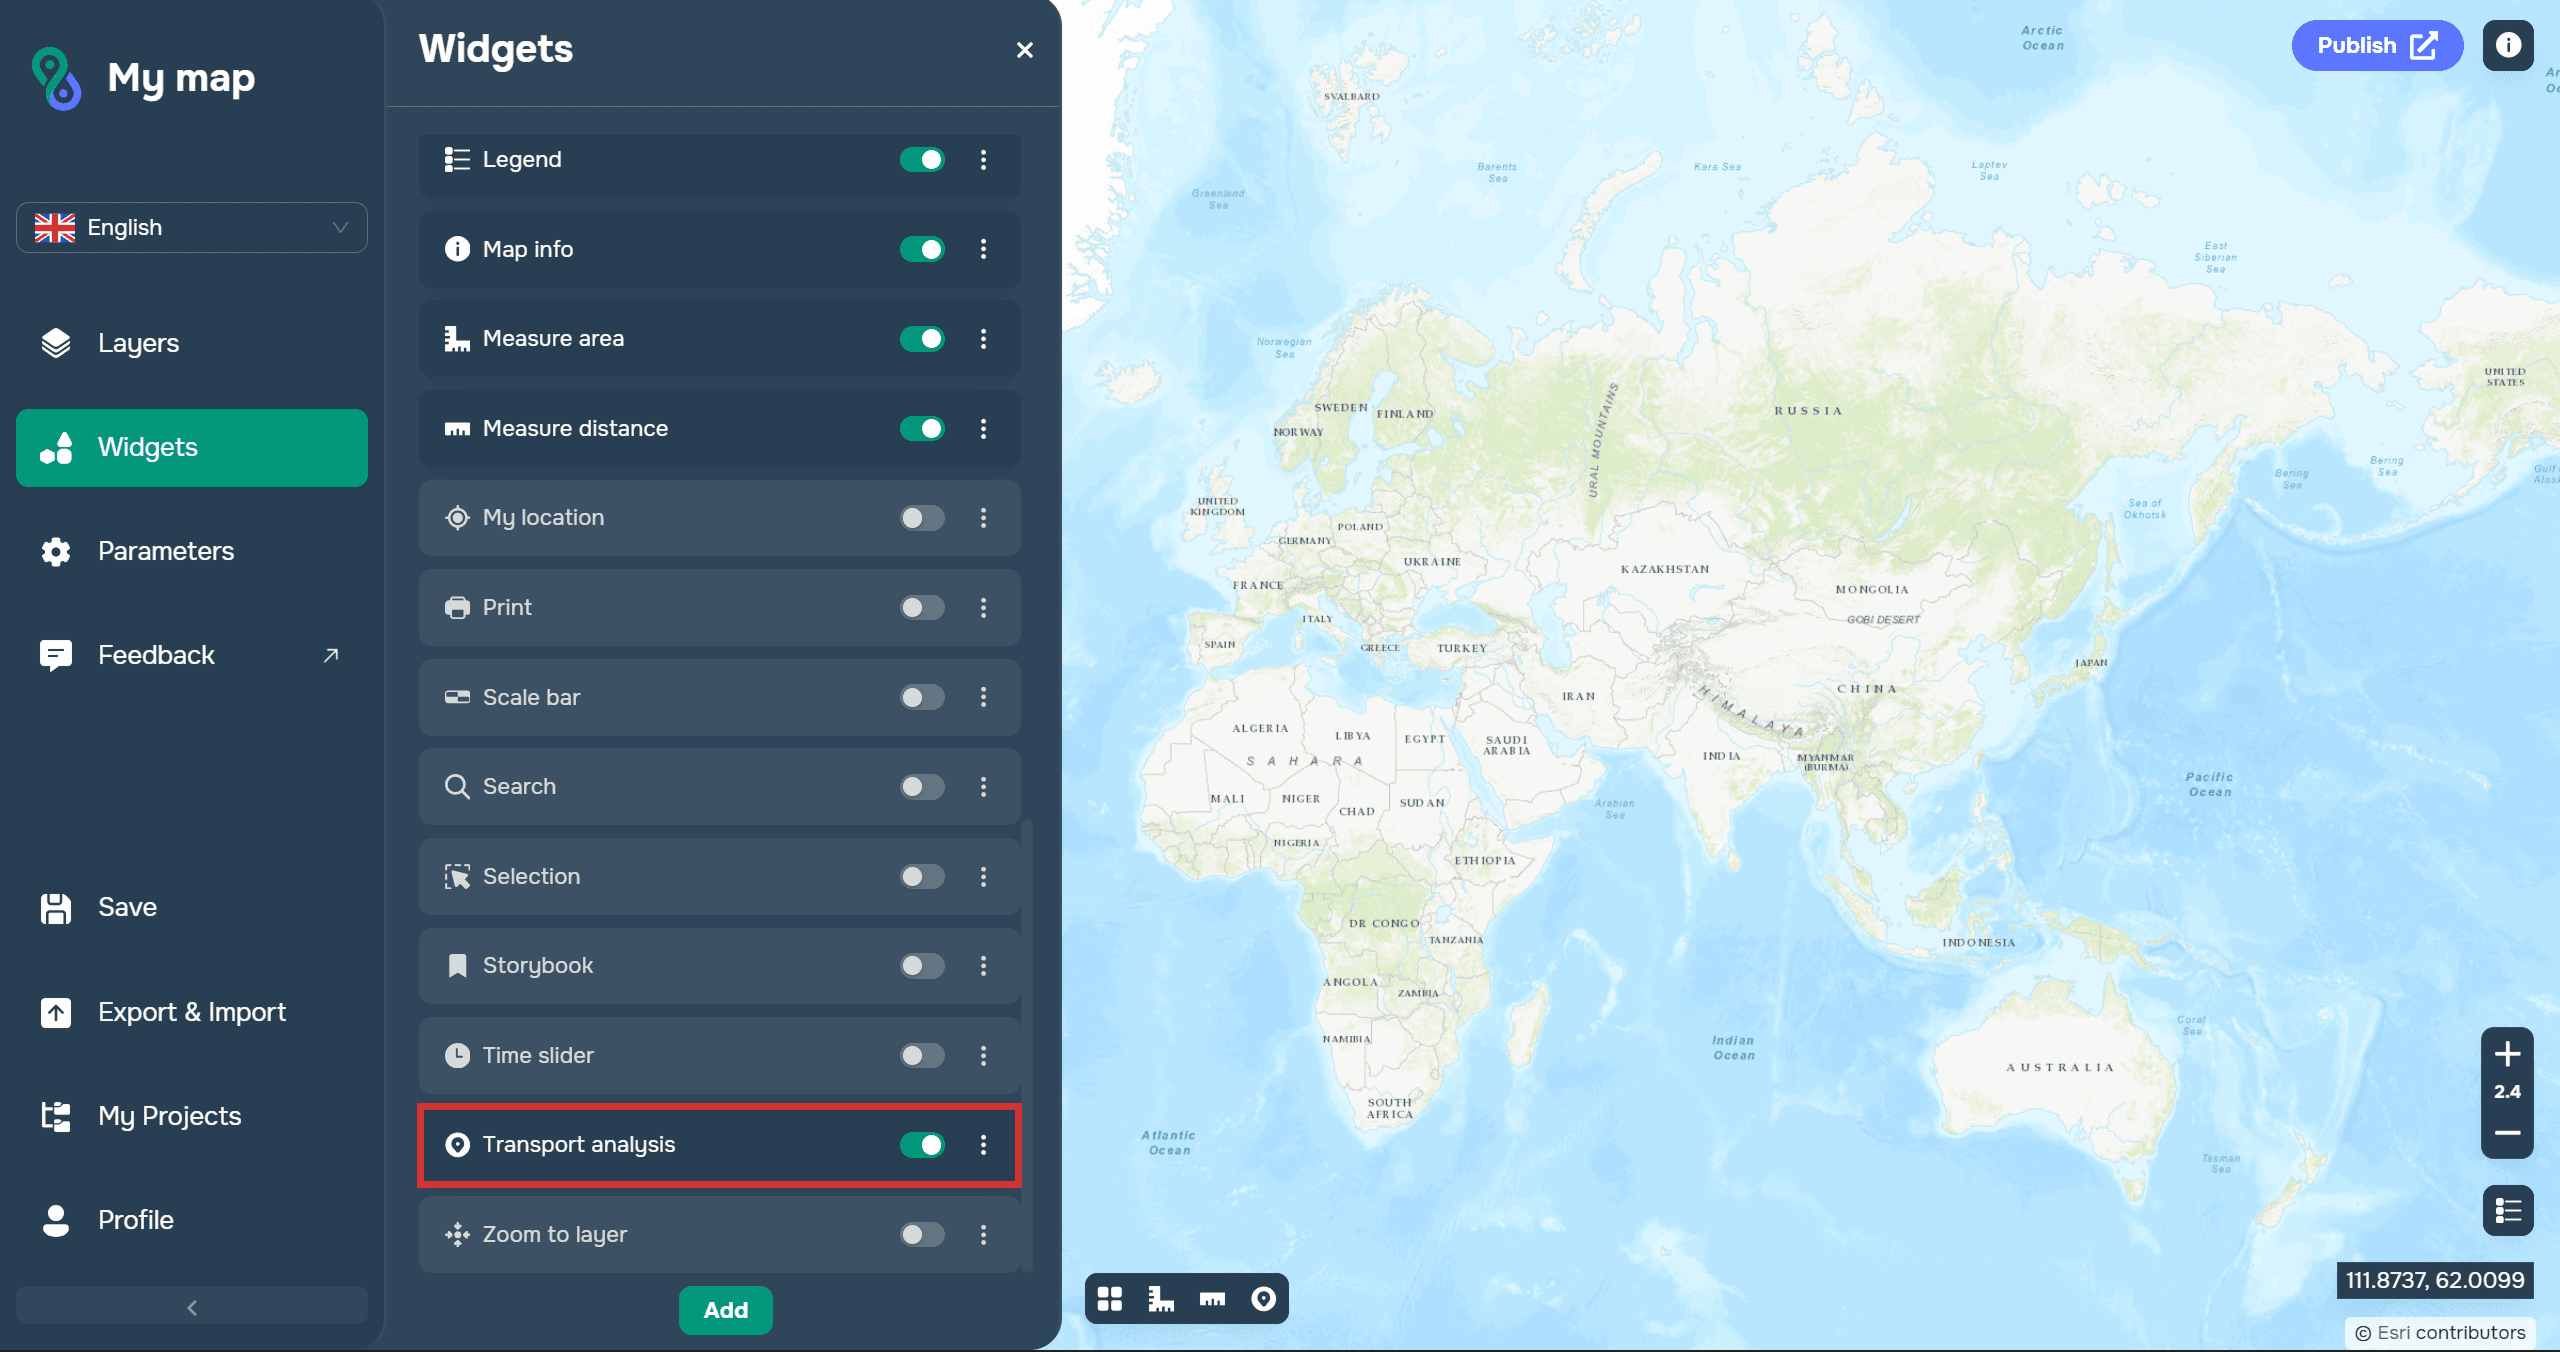
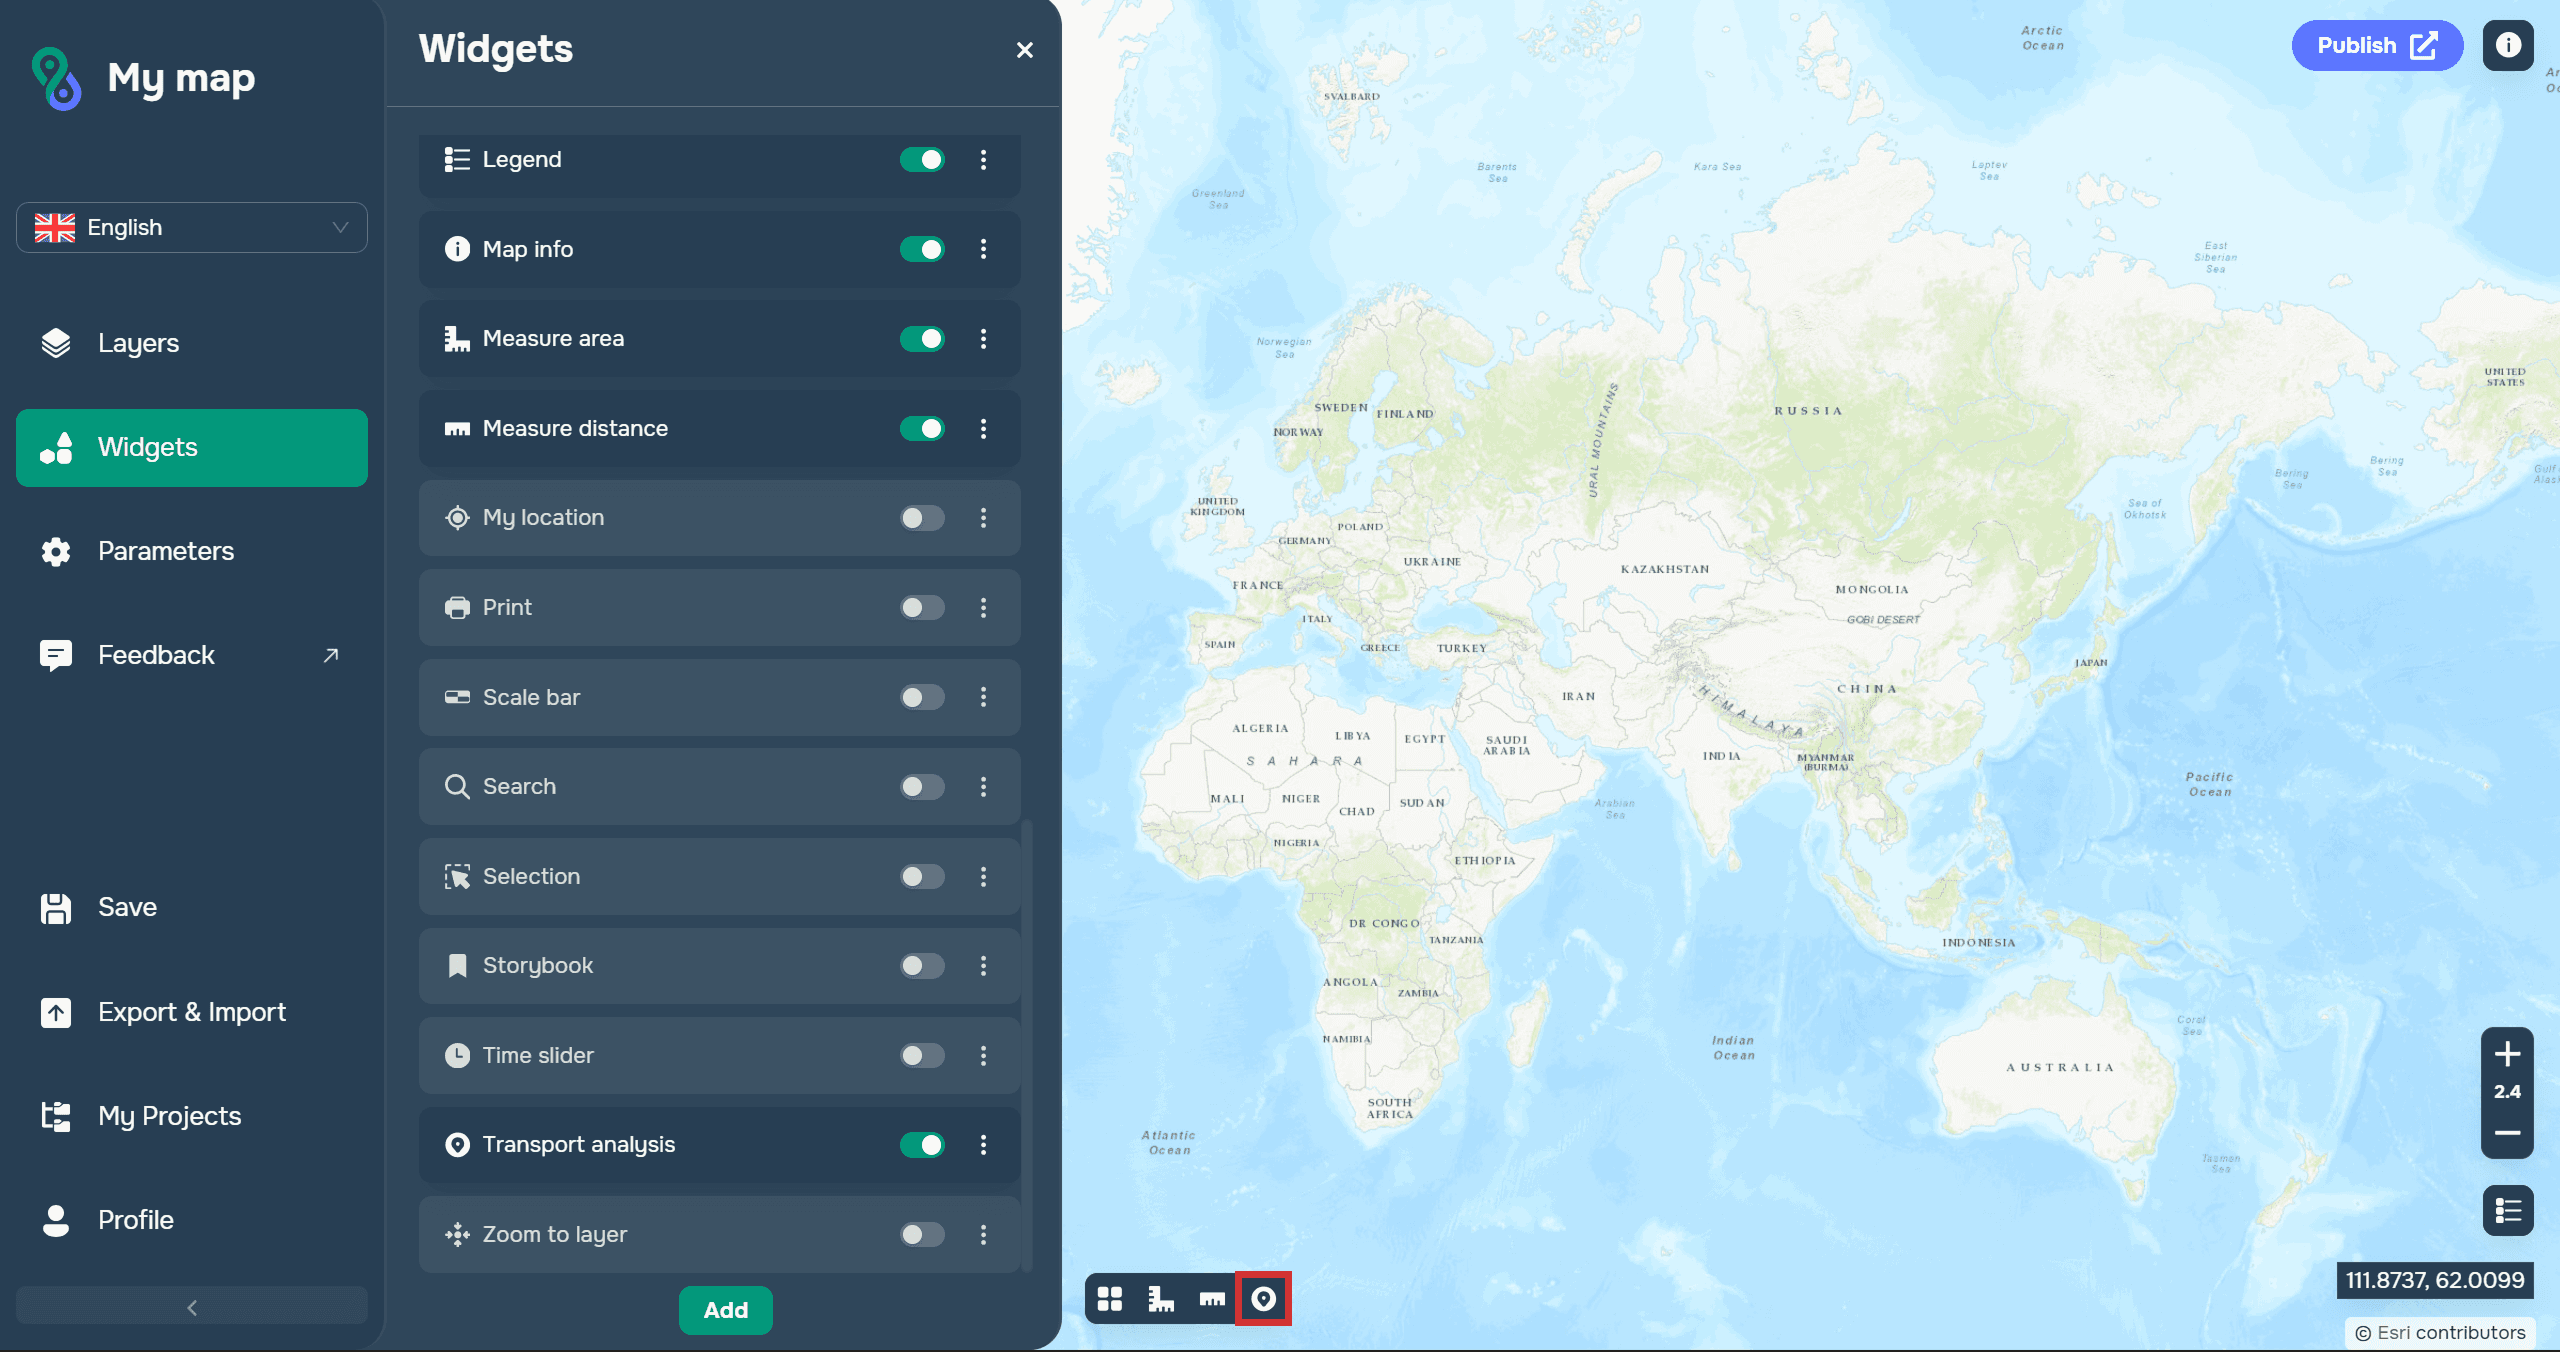
The widget is now displayed on the toolbar at the bottom of the map window.
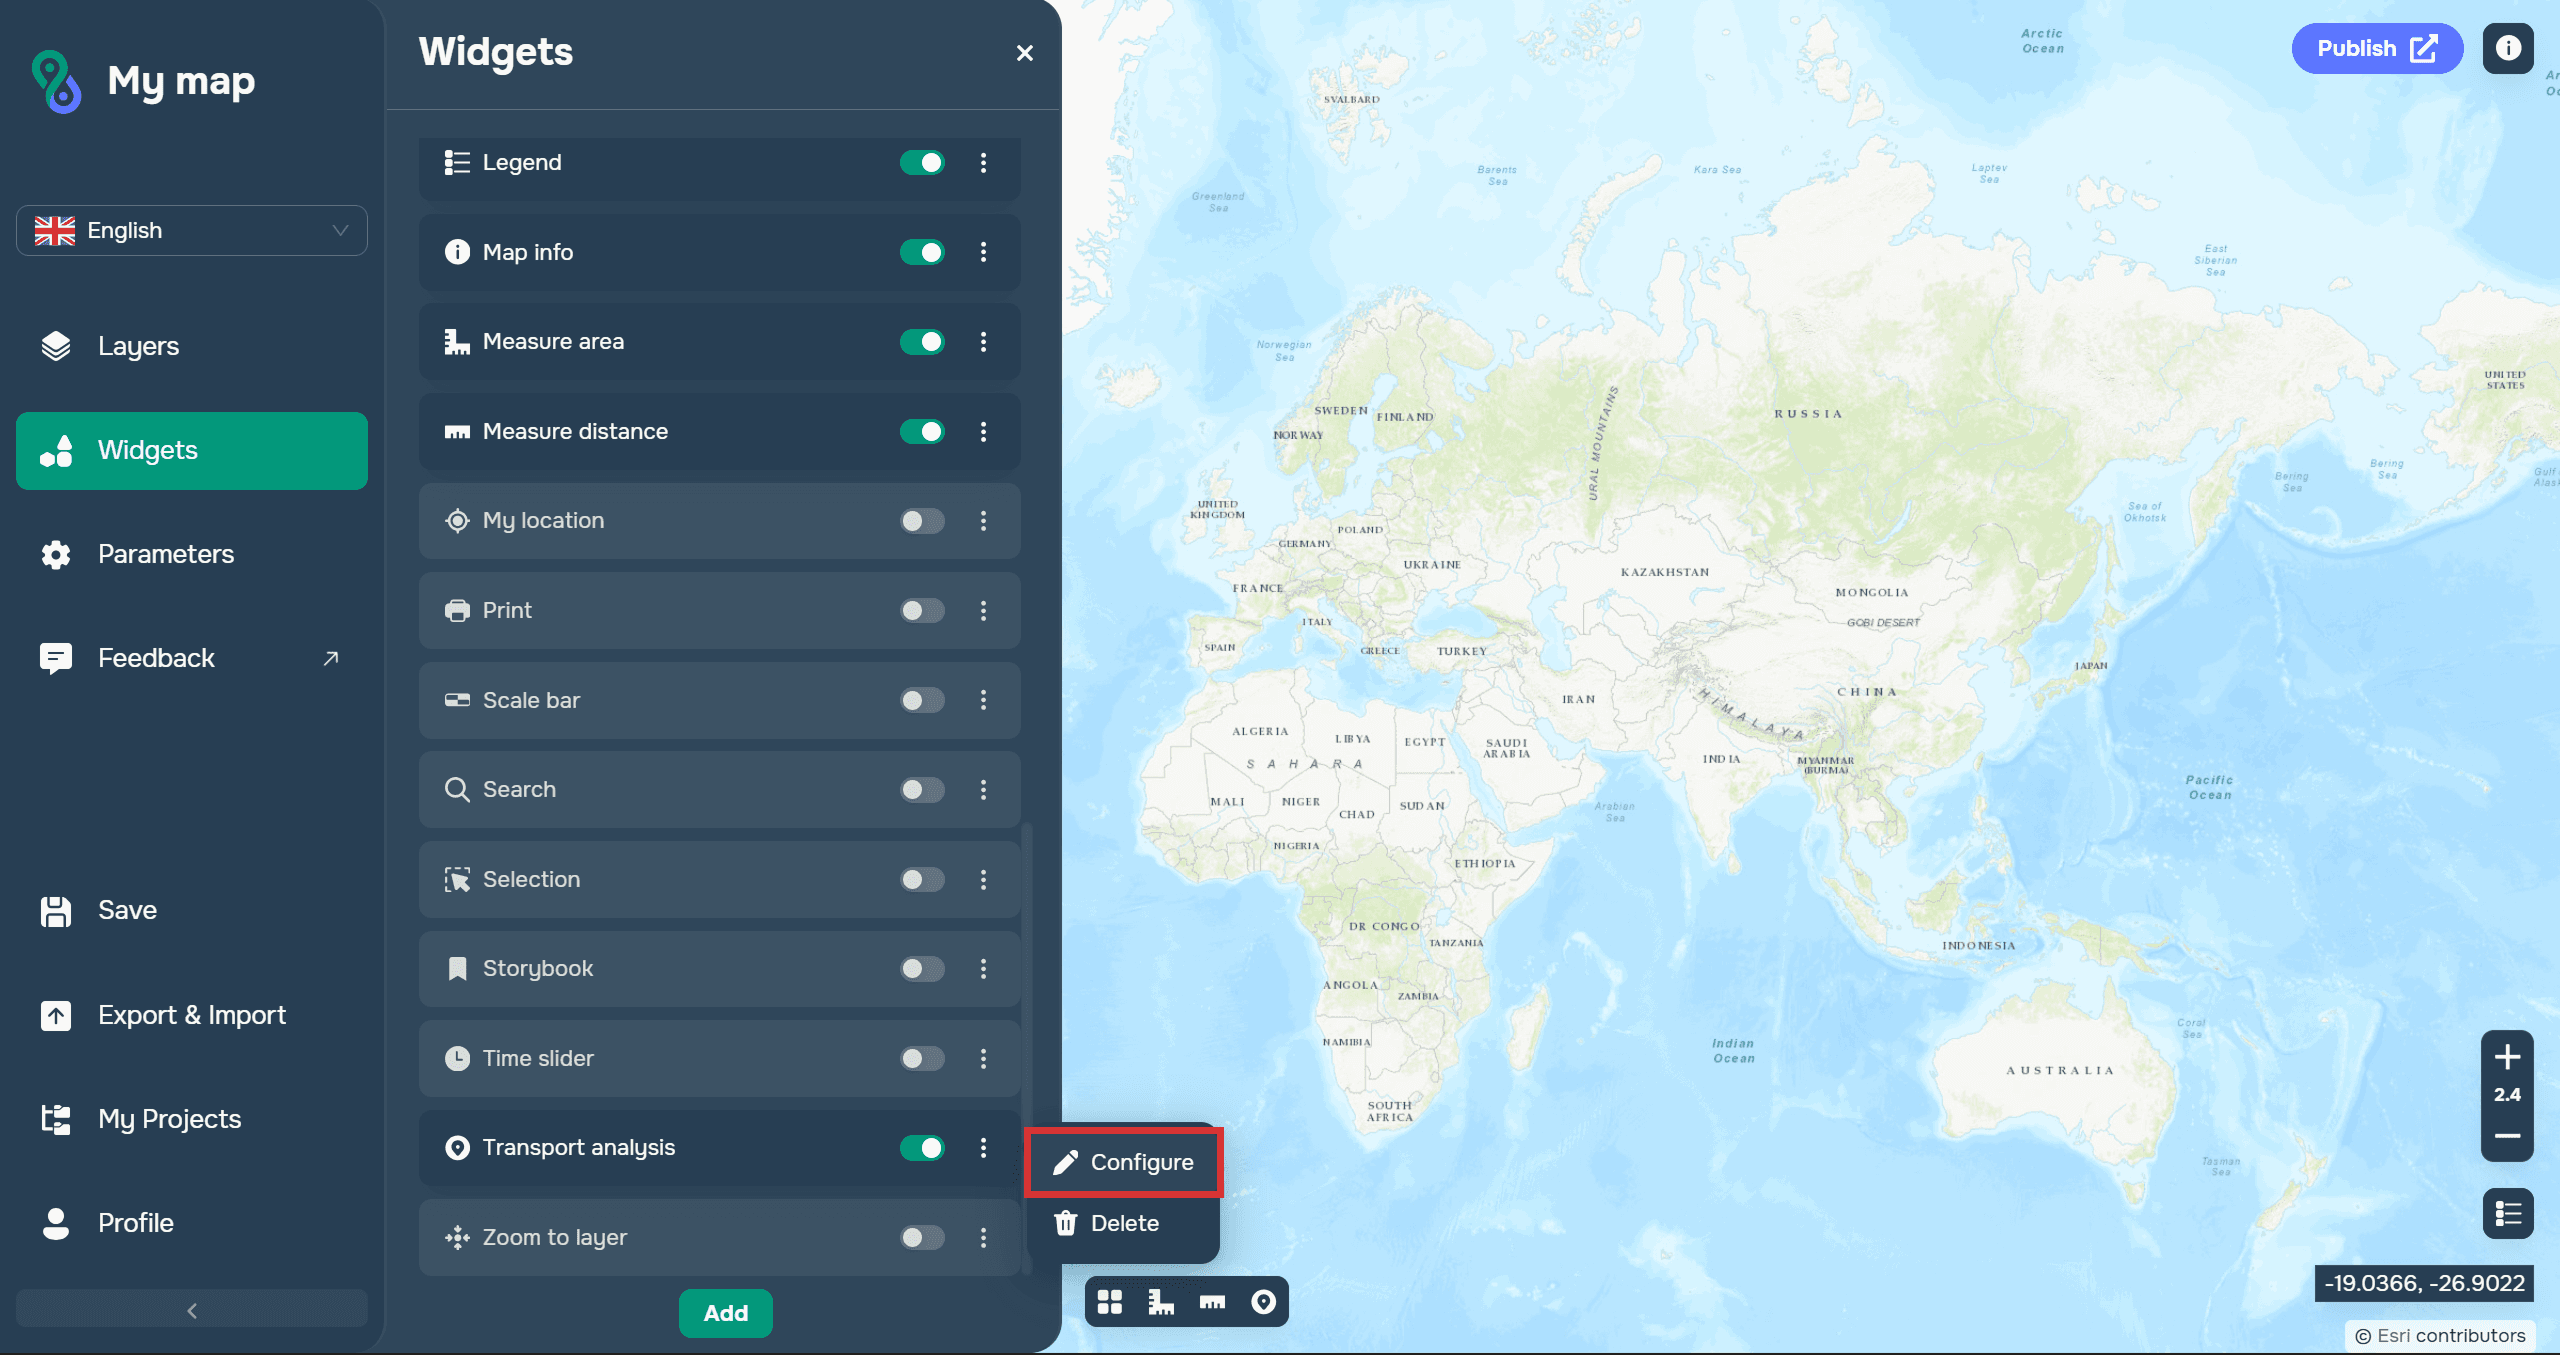
Let's move on to configuring the widget. To do this, click the three dots to the right of the name and select Configure.
Working with the widget
After clicking the widget button on the map, a dialog box appears with the option to build routes or accessibility zones. Let's start with building routes.
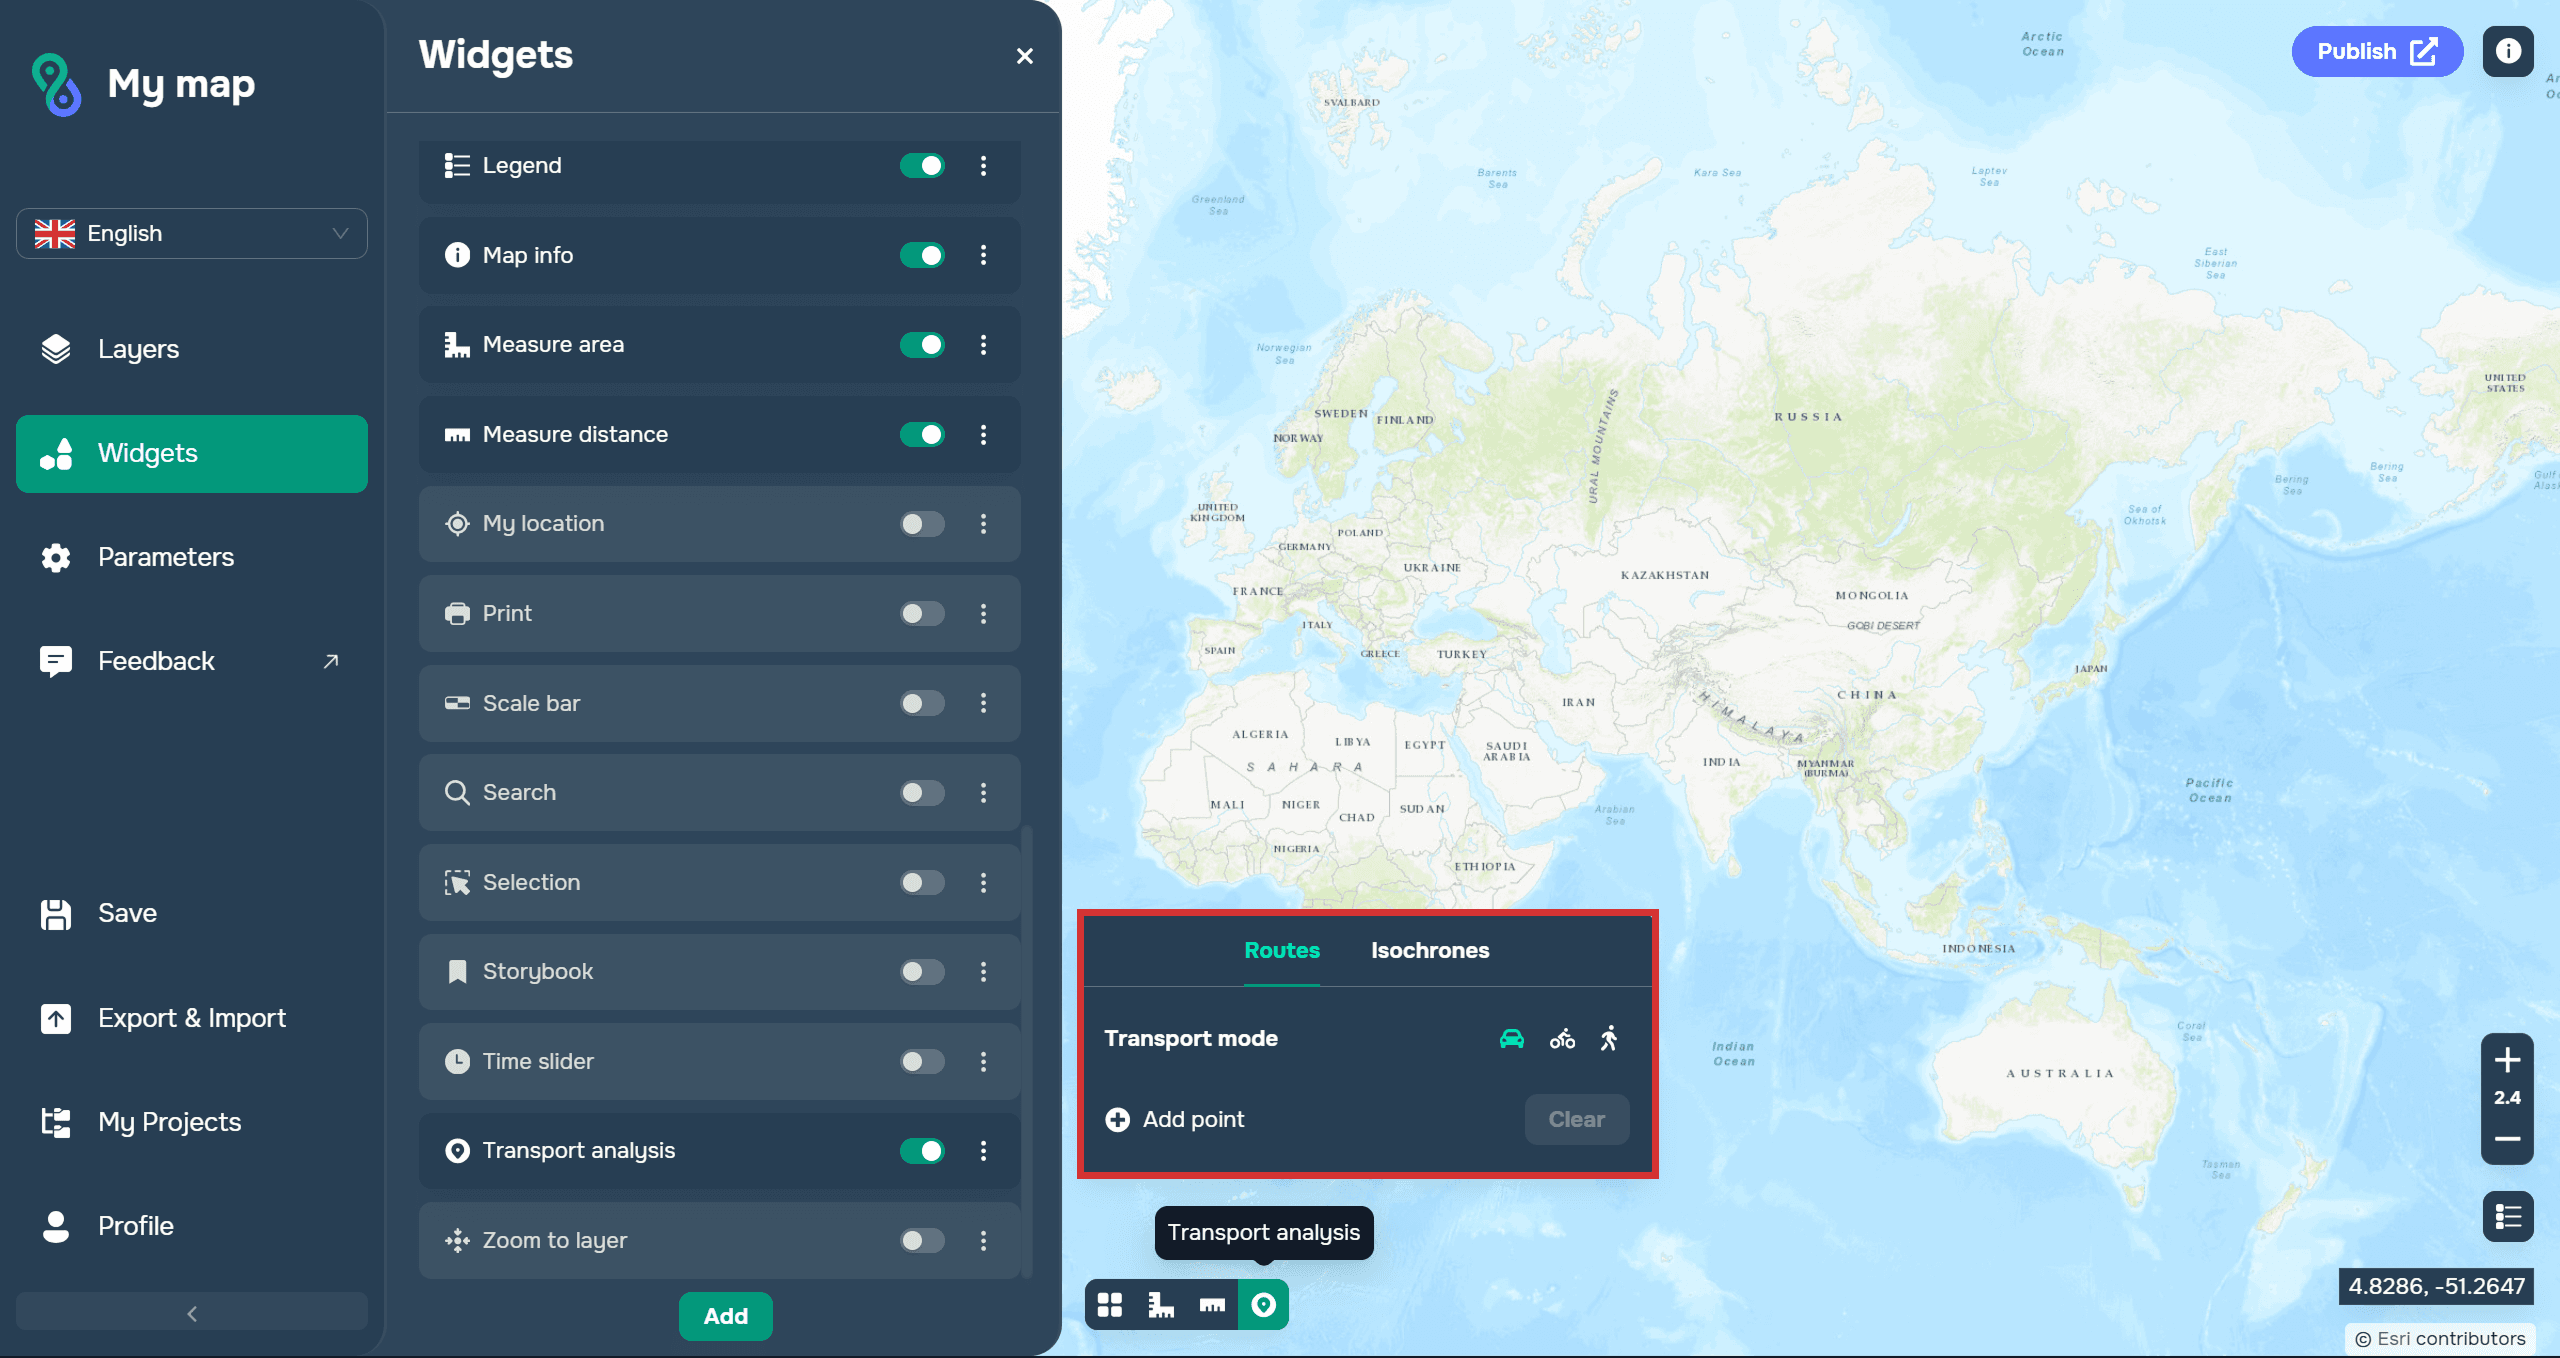
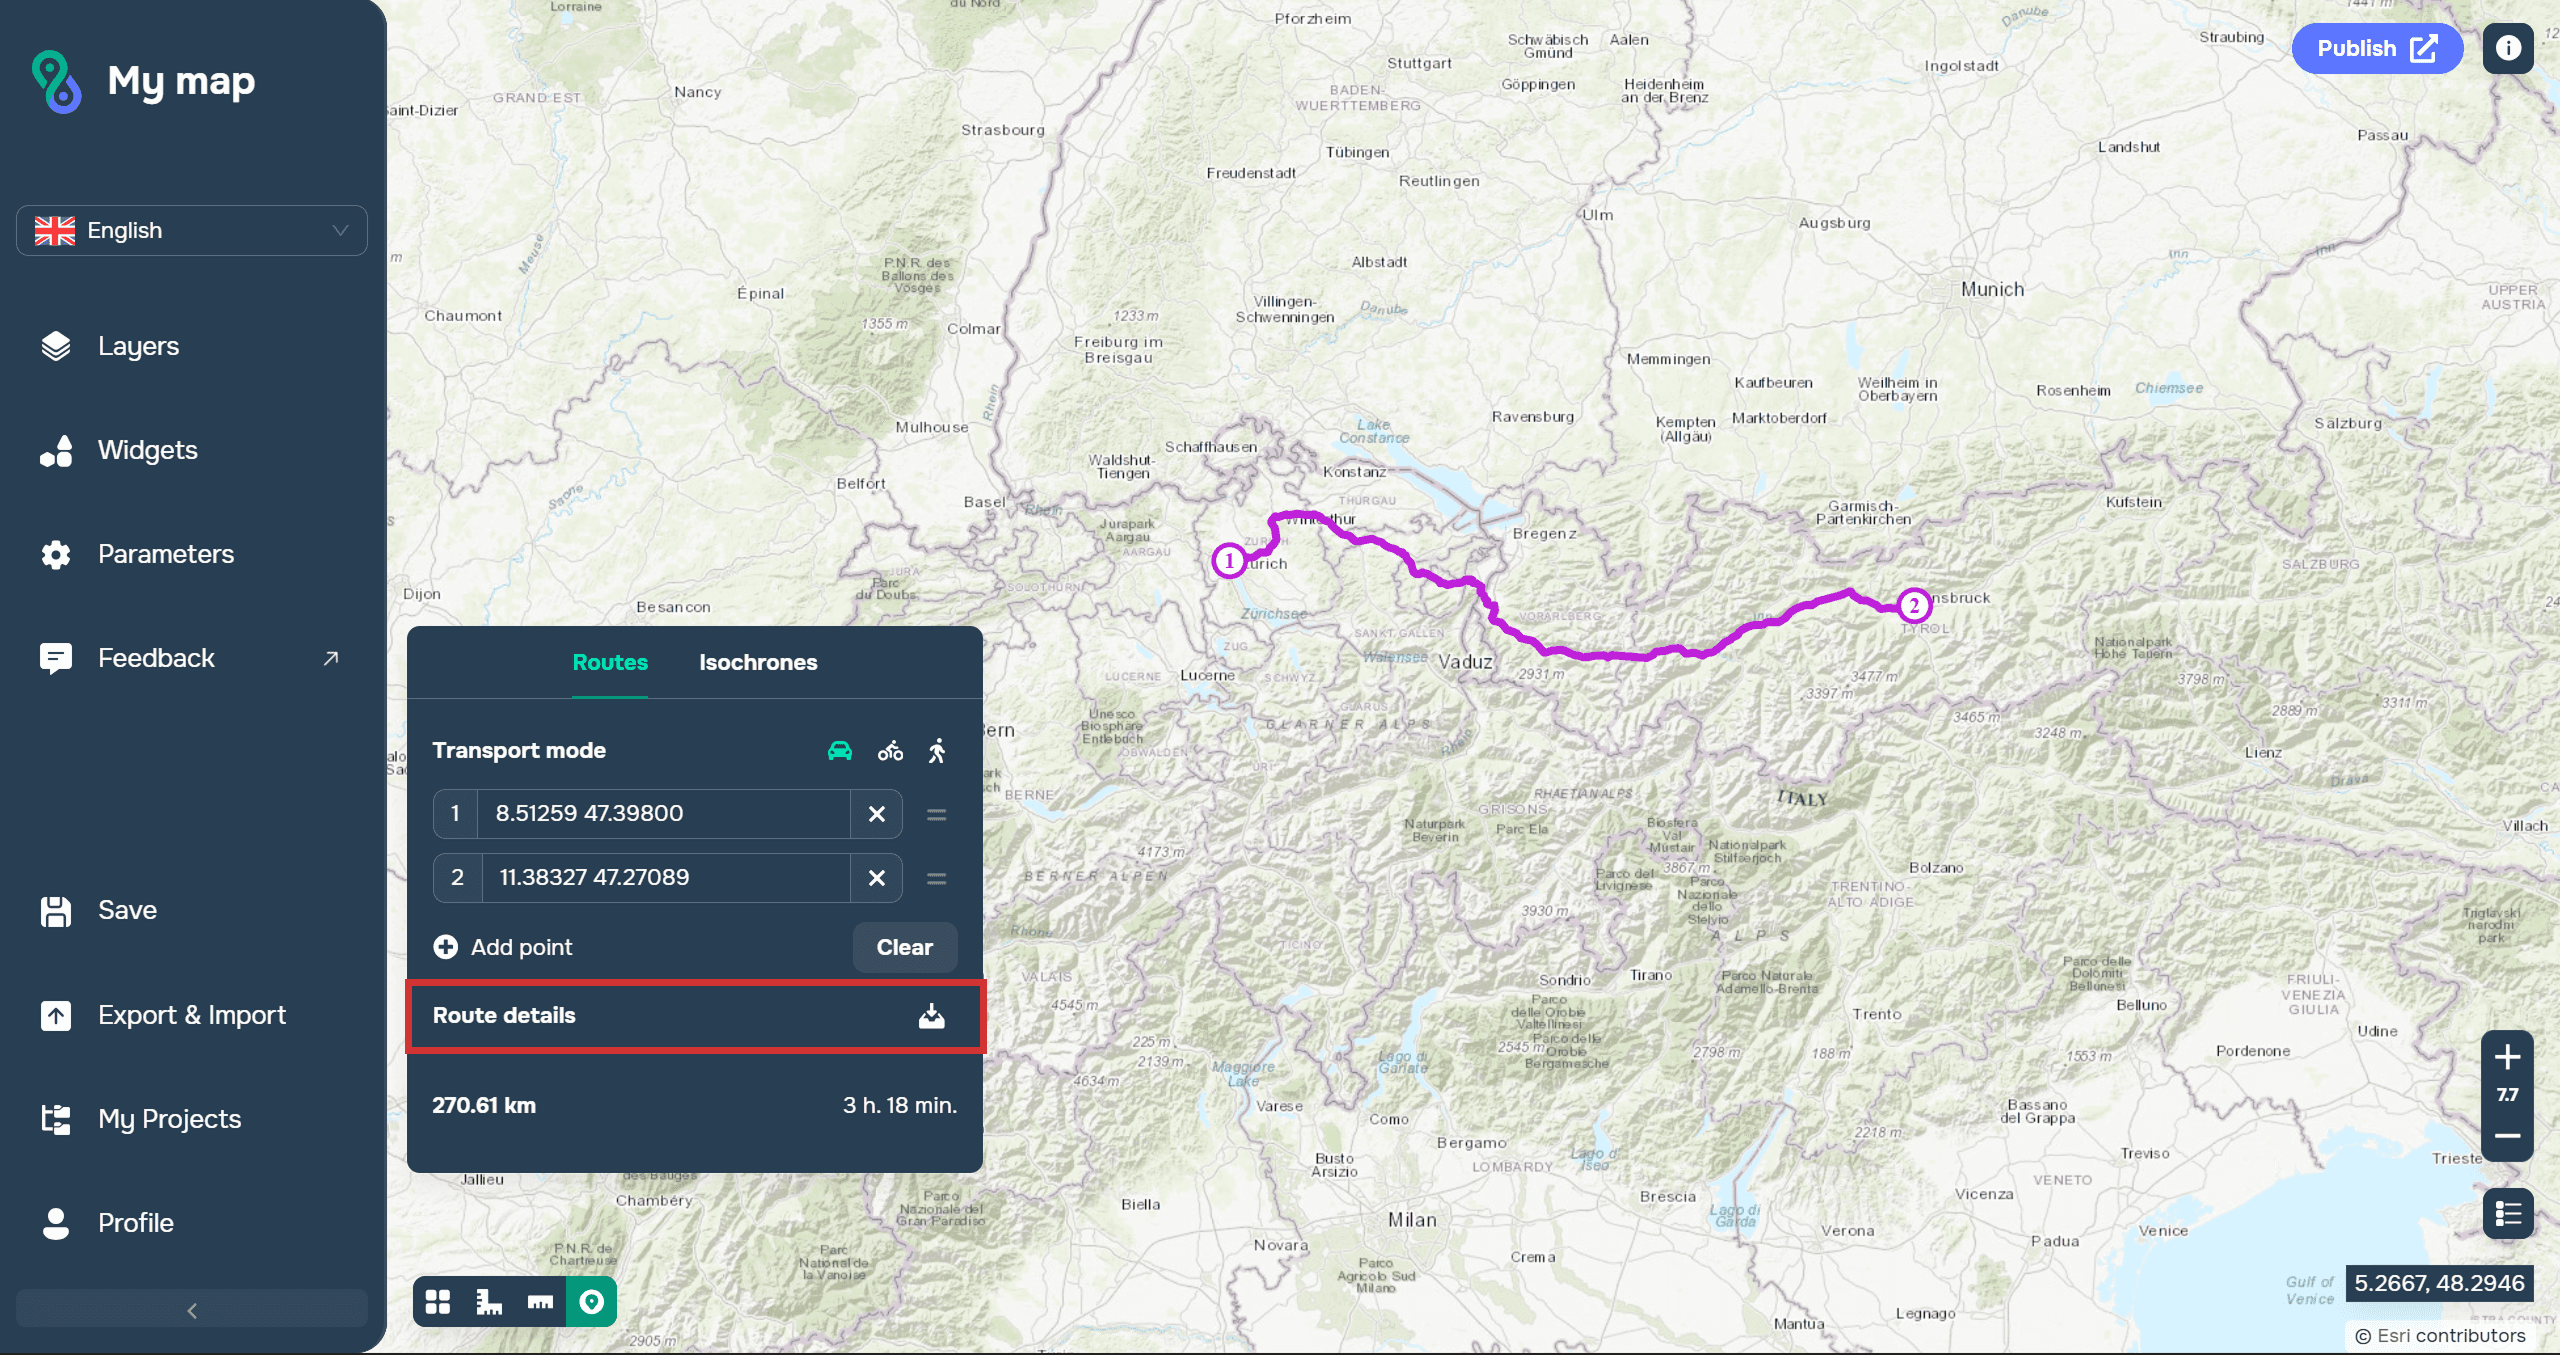
To build a route, you need to place at least two points on the map.
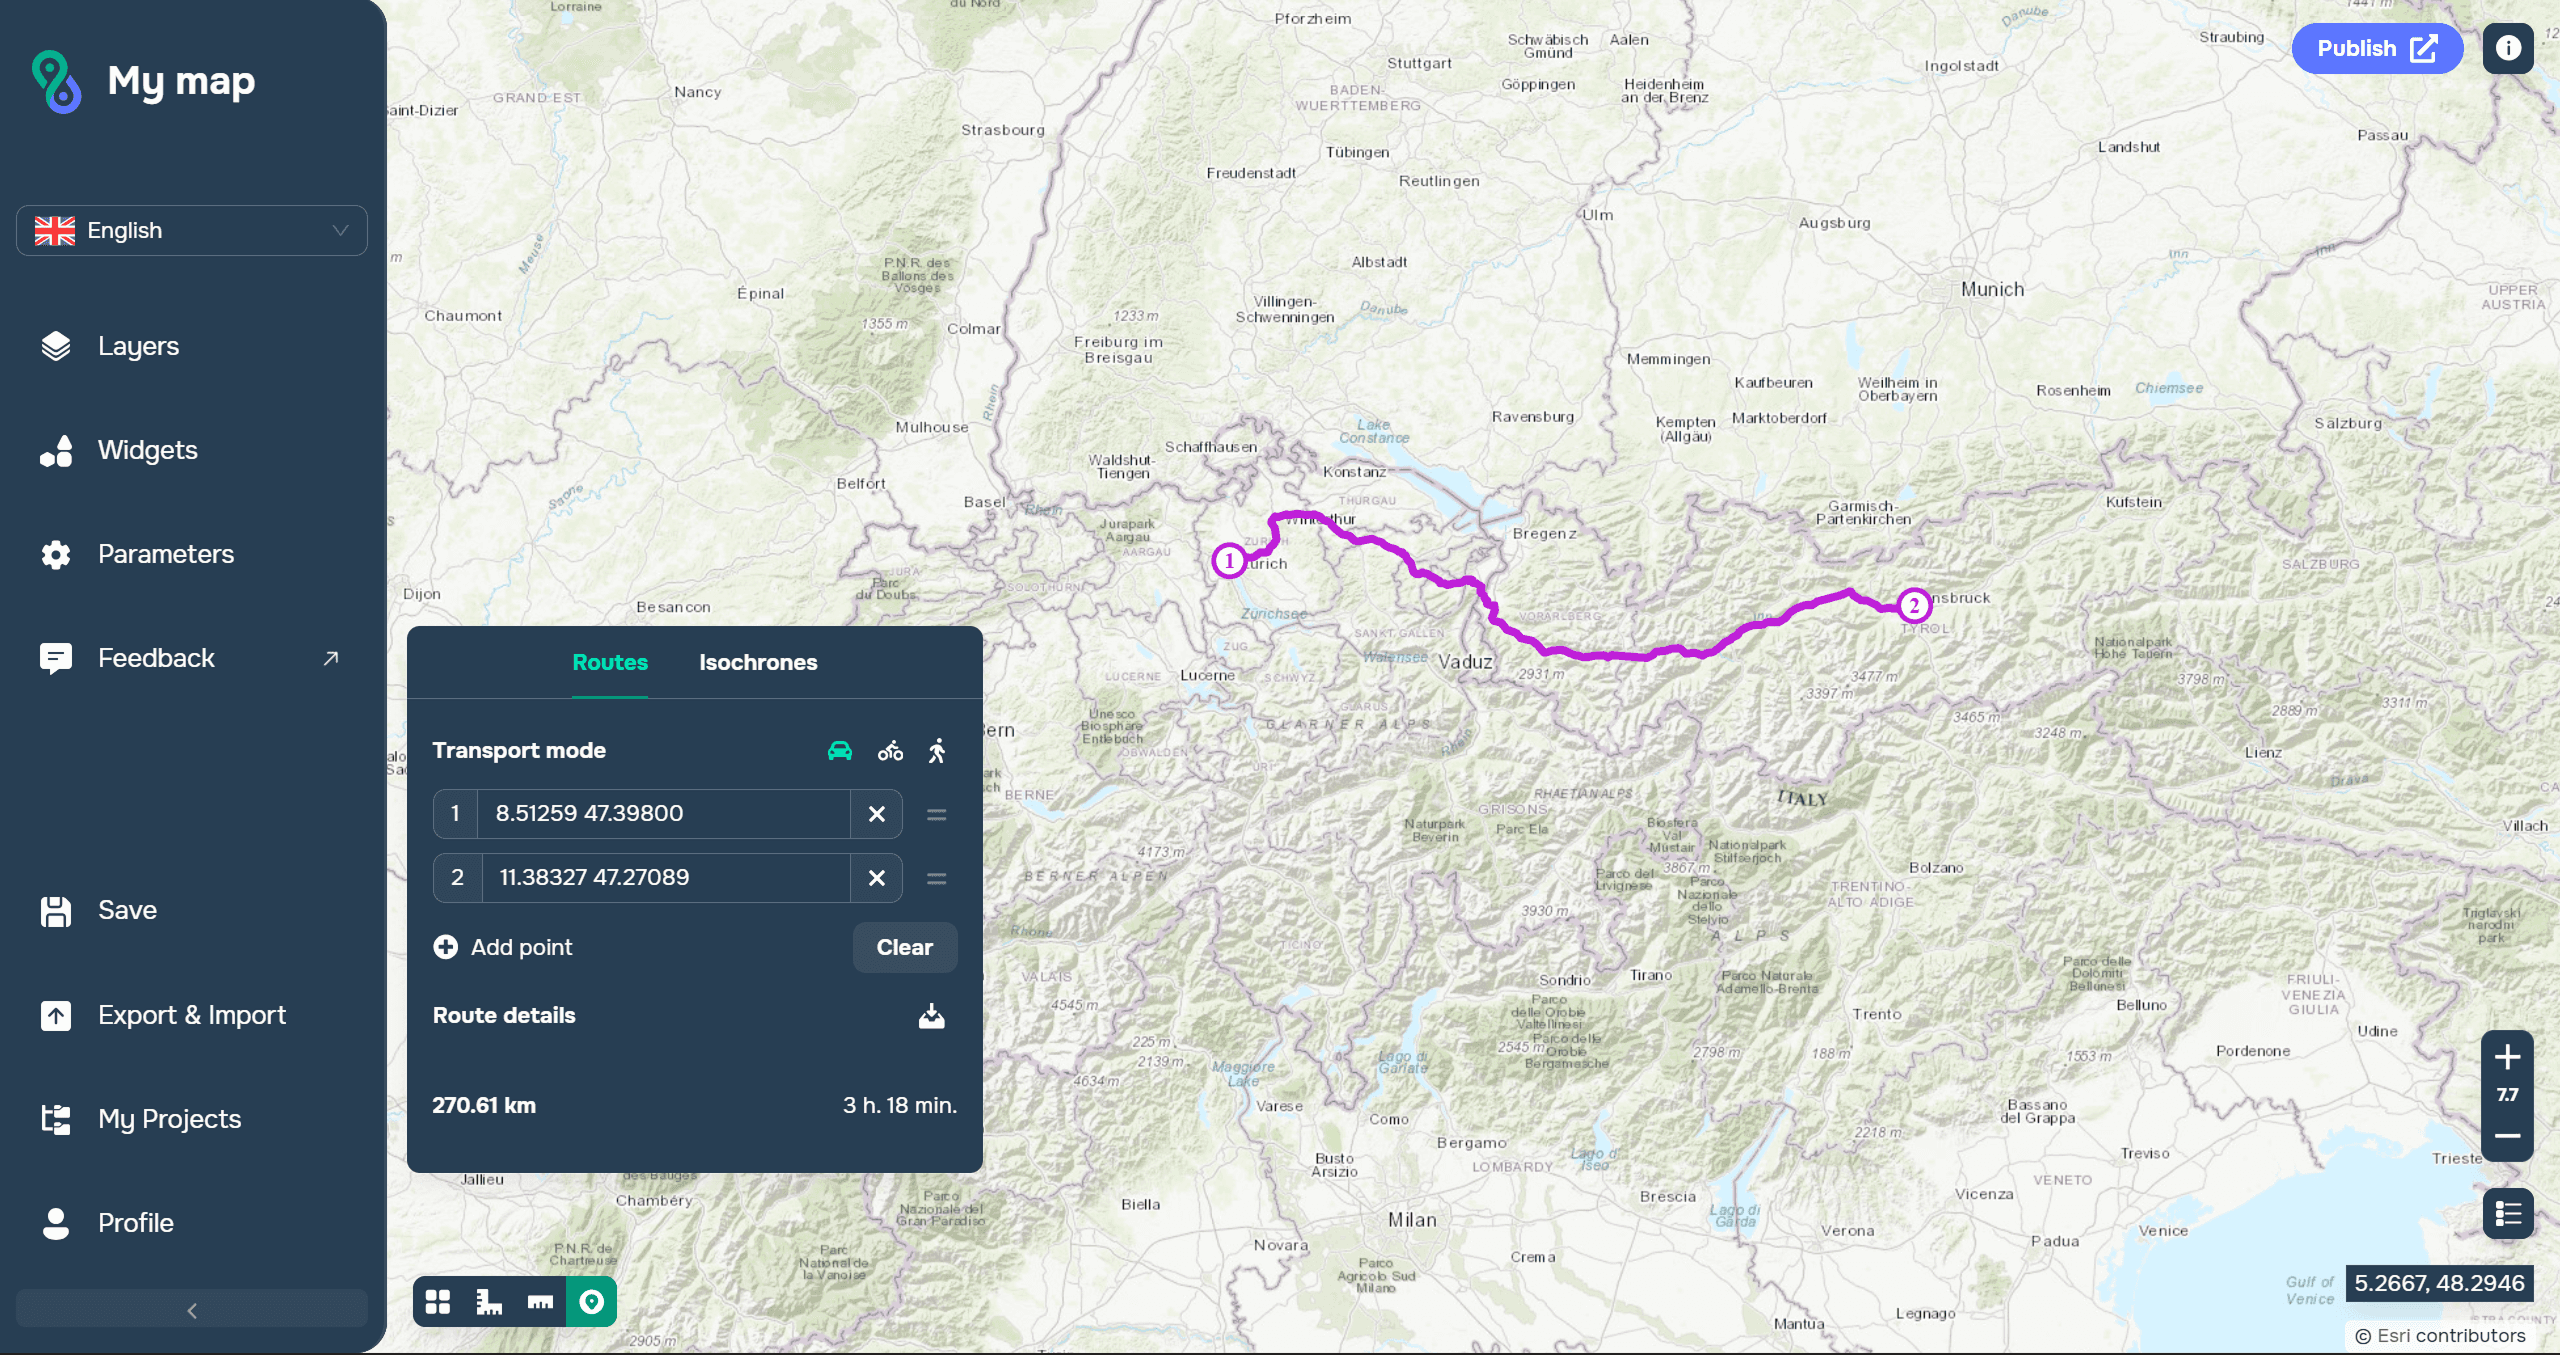
After placing two or more route points on the map, you must select the mode of transportation to use for the route. Currently, the following modes are available: car, bicycle, and walking.
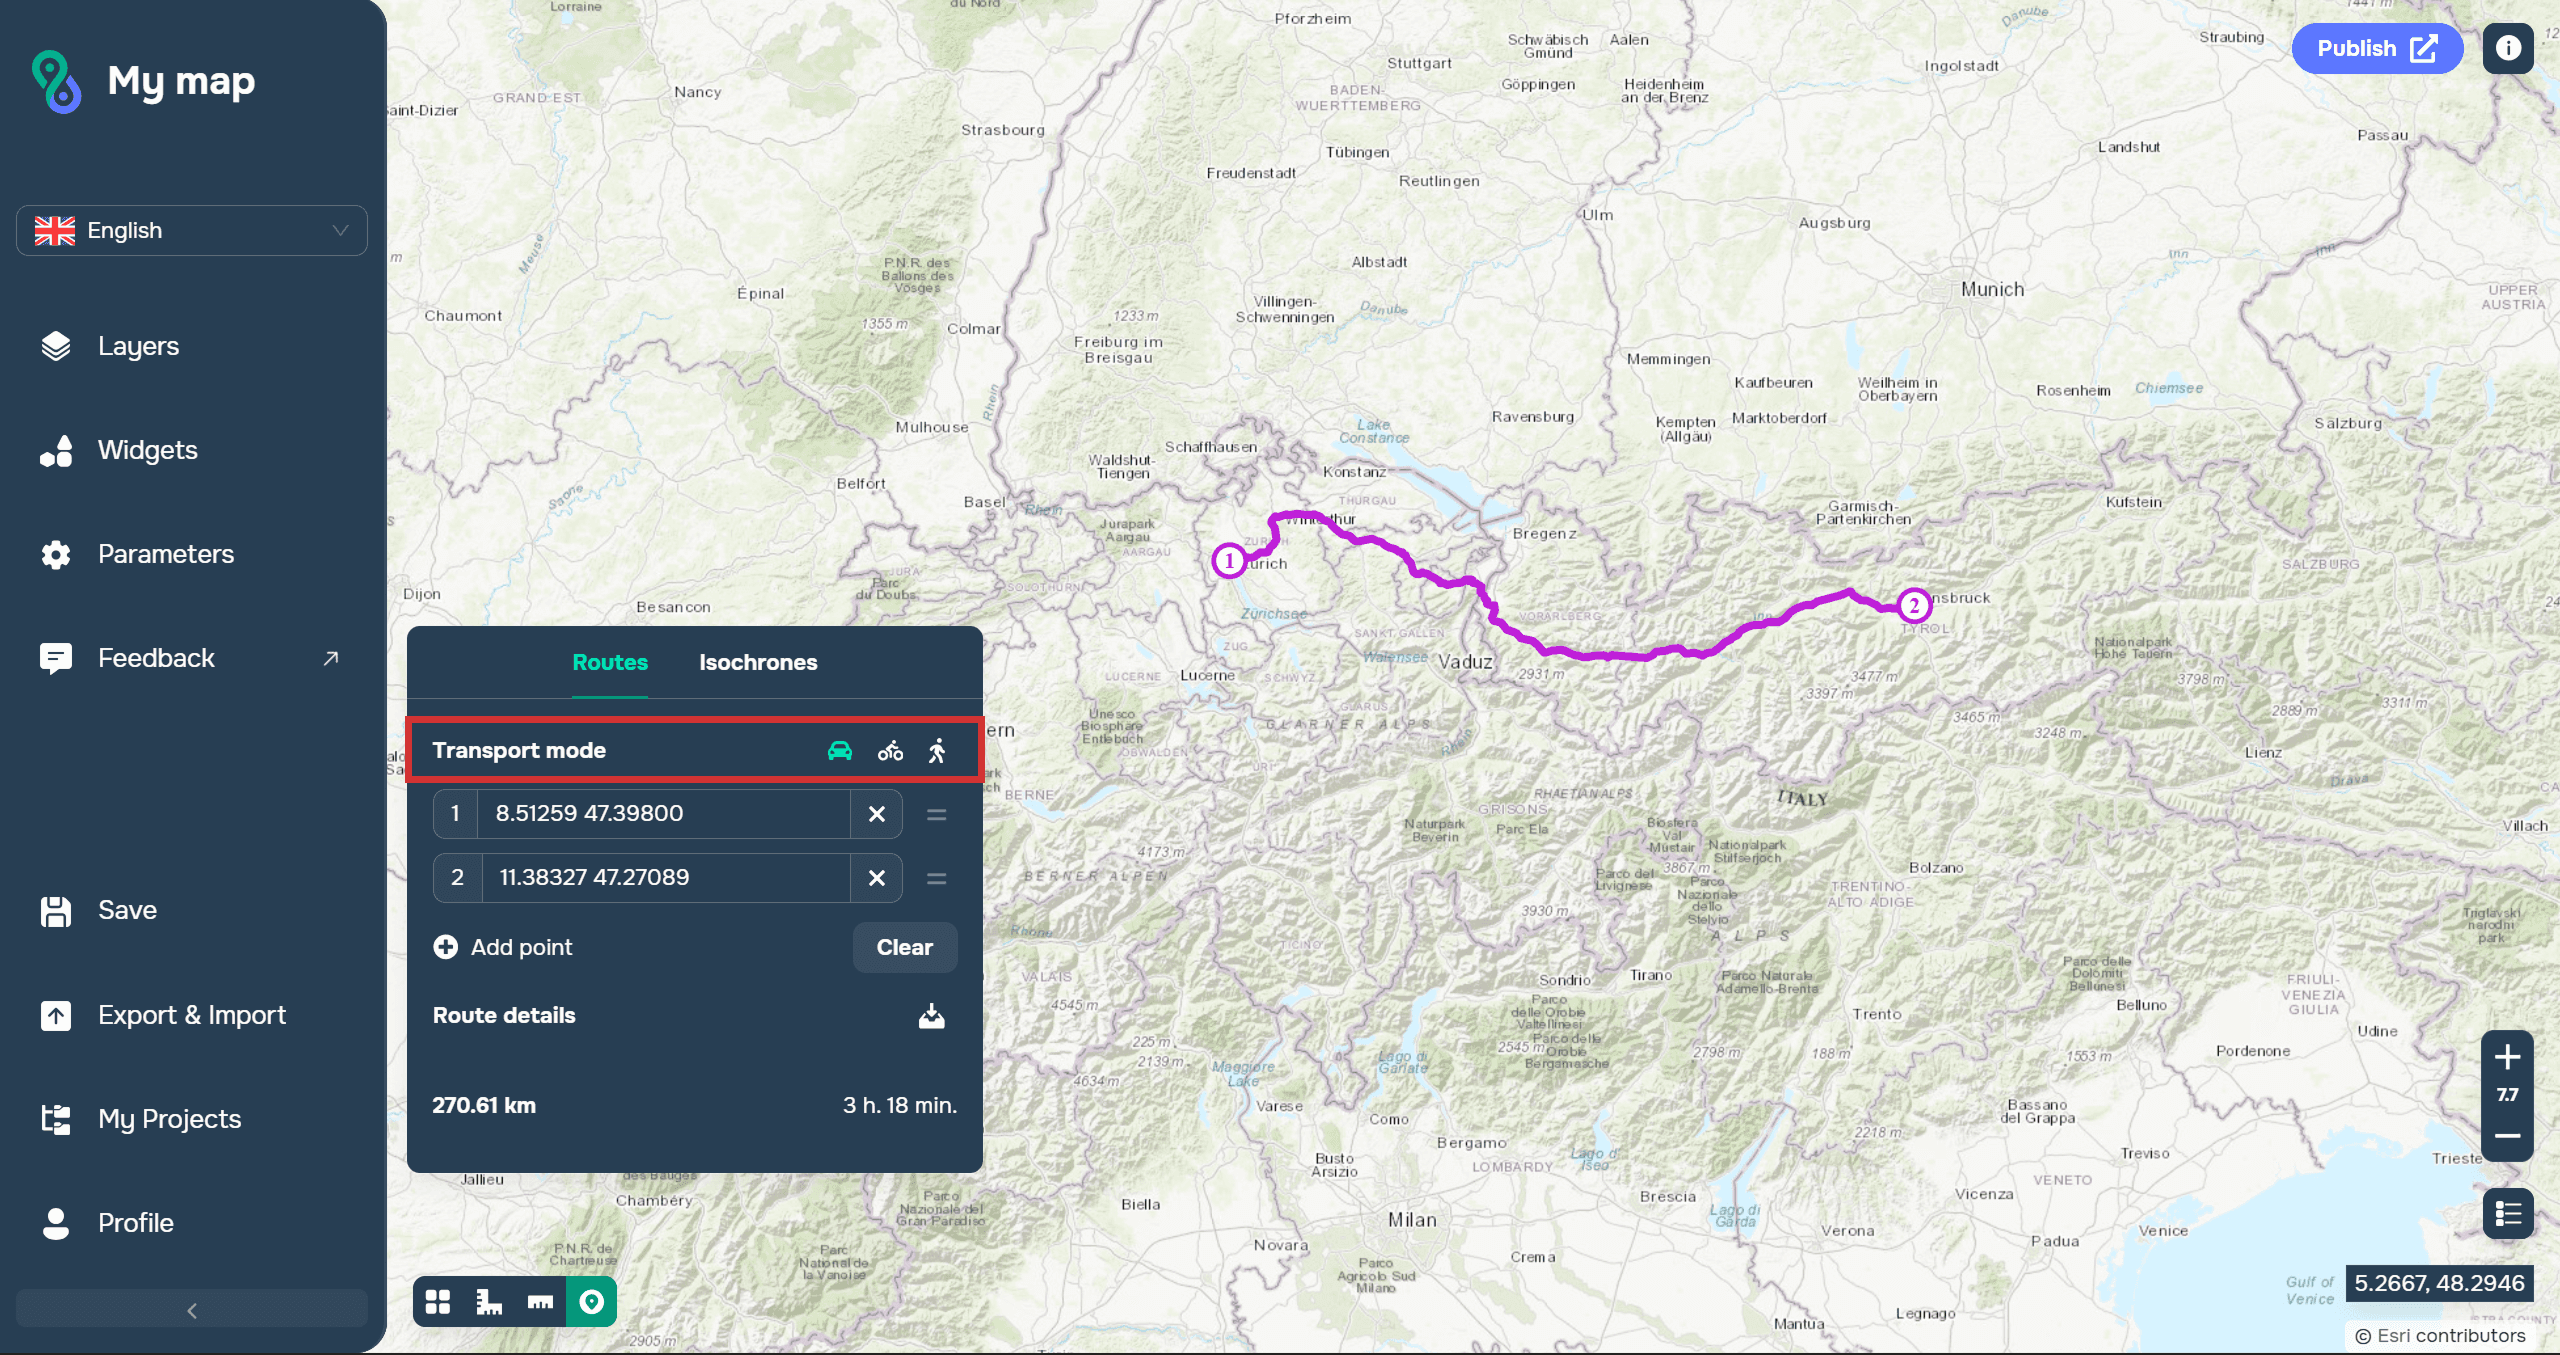
Also, after creating a route, it is possible to move the order of route points and view route details.
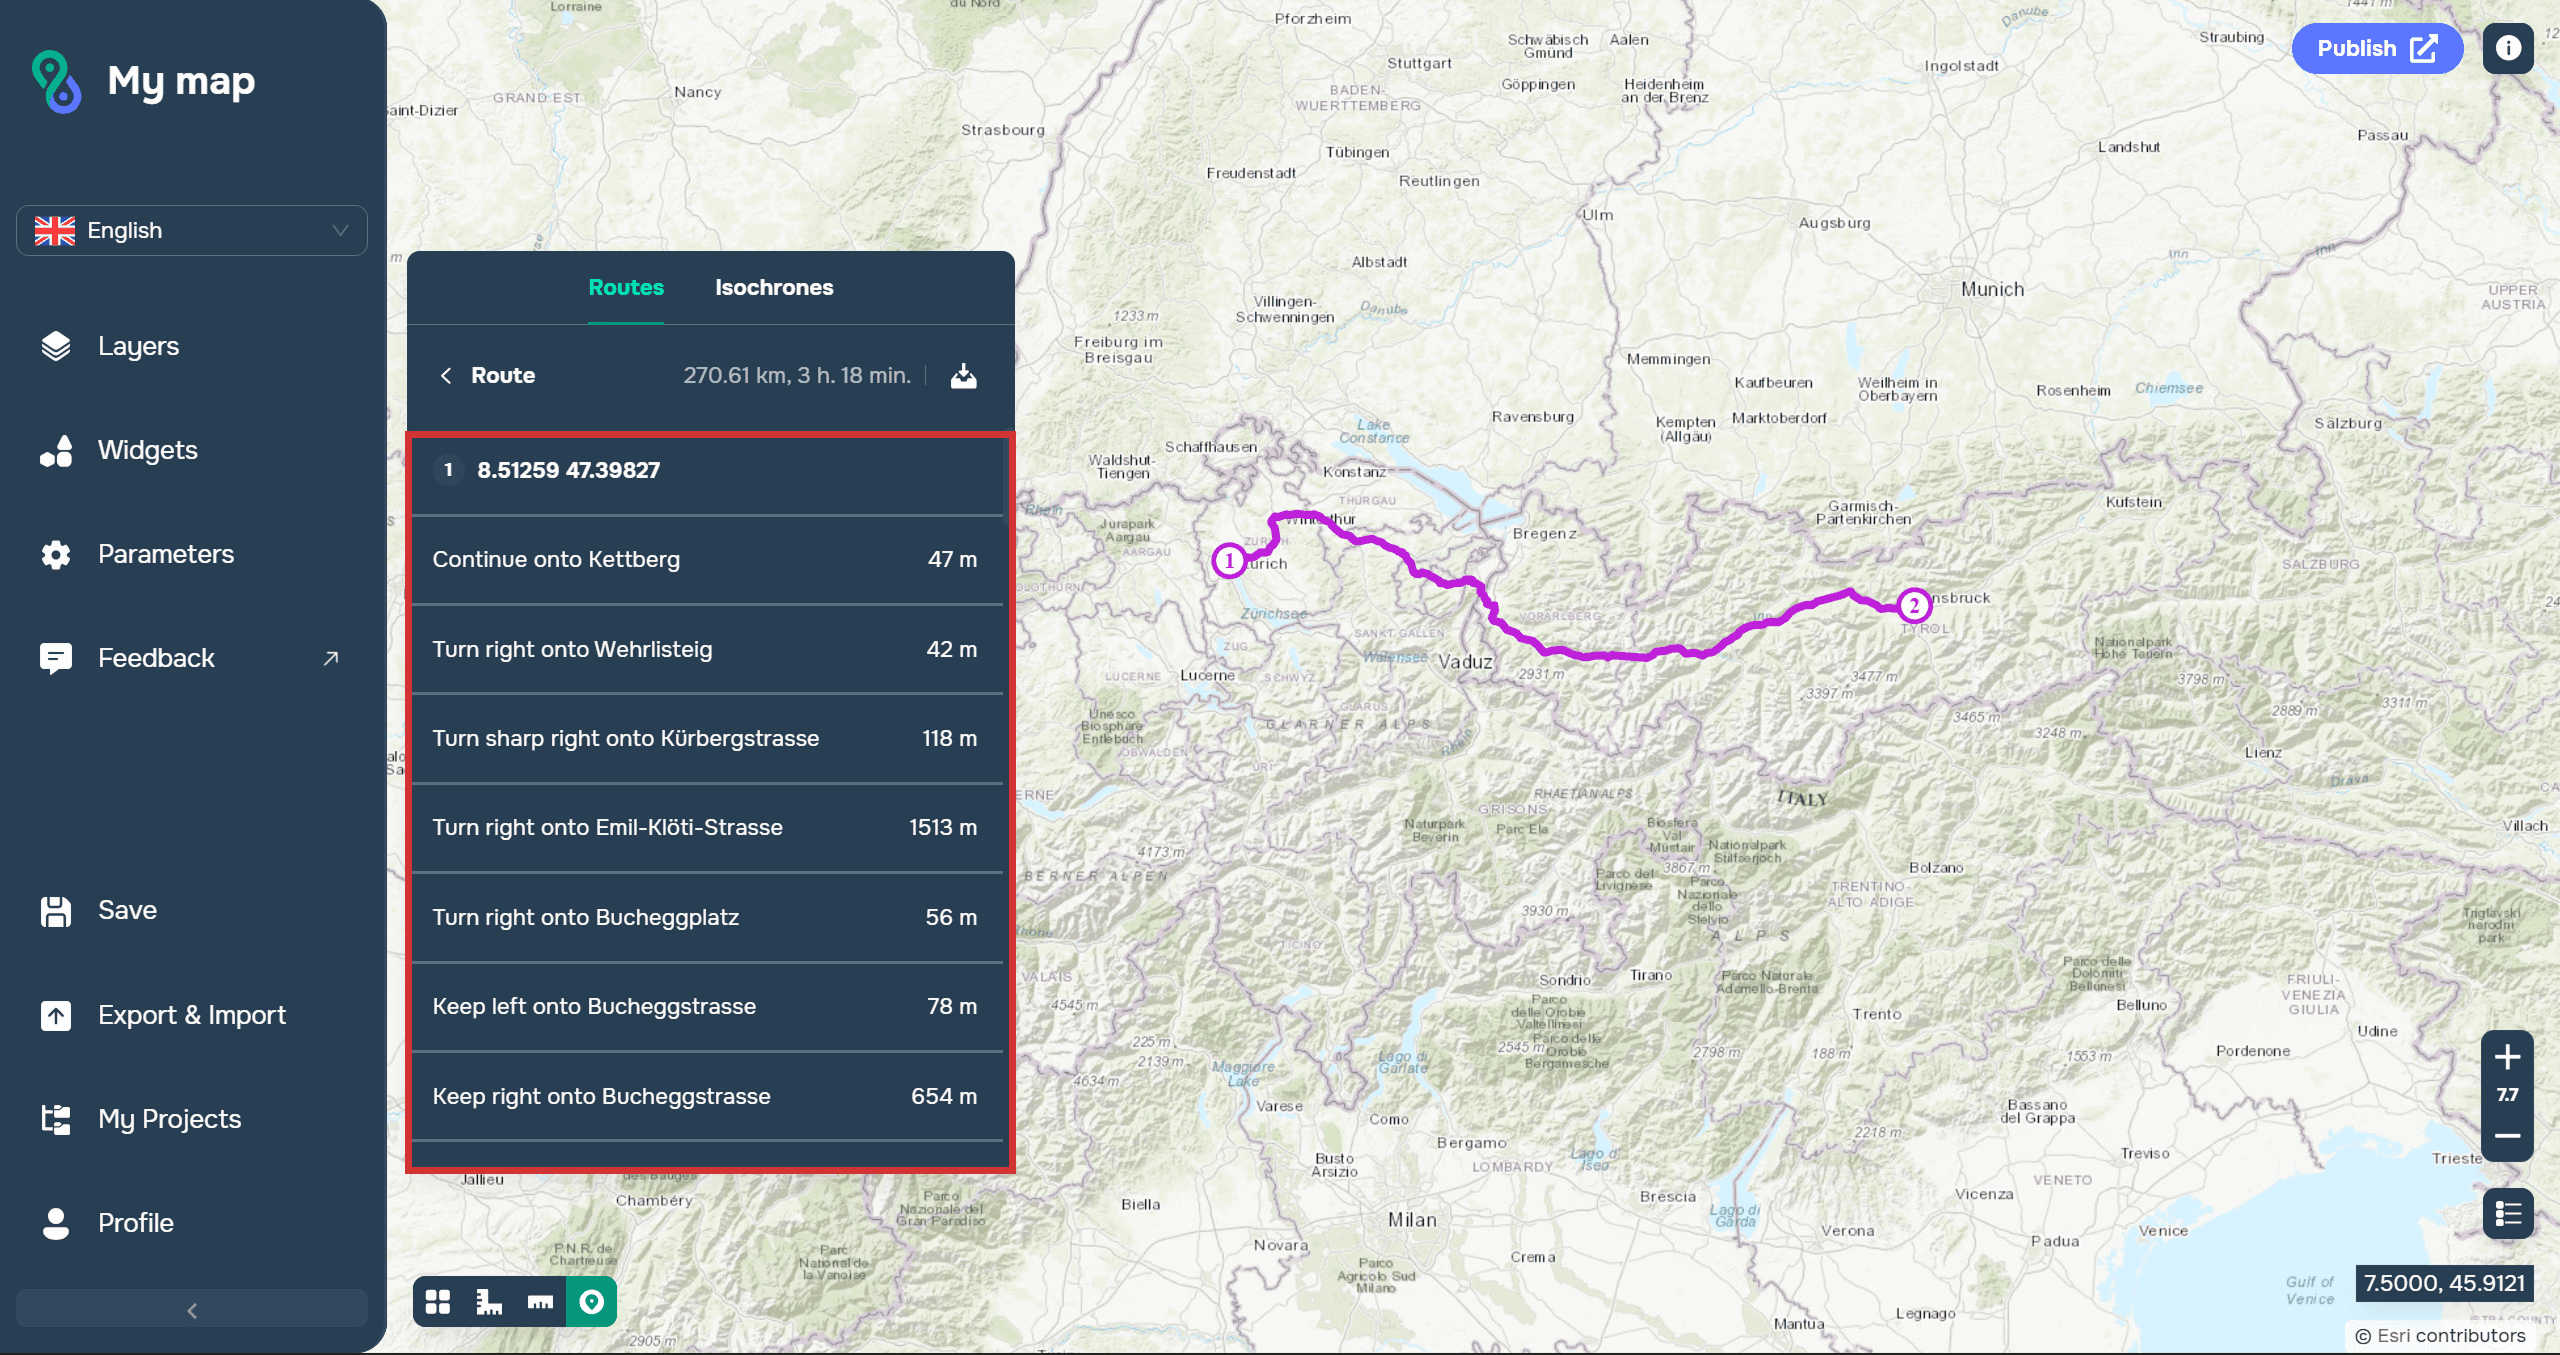
The created route can be added to your data sources.
Let's move on to transportation accessibility zones. To do this, go to the relevant section and select how the isochrones will be built: using a point layer or manually specified points.
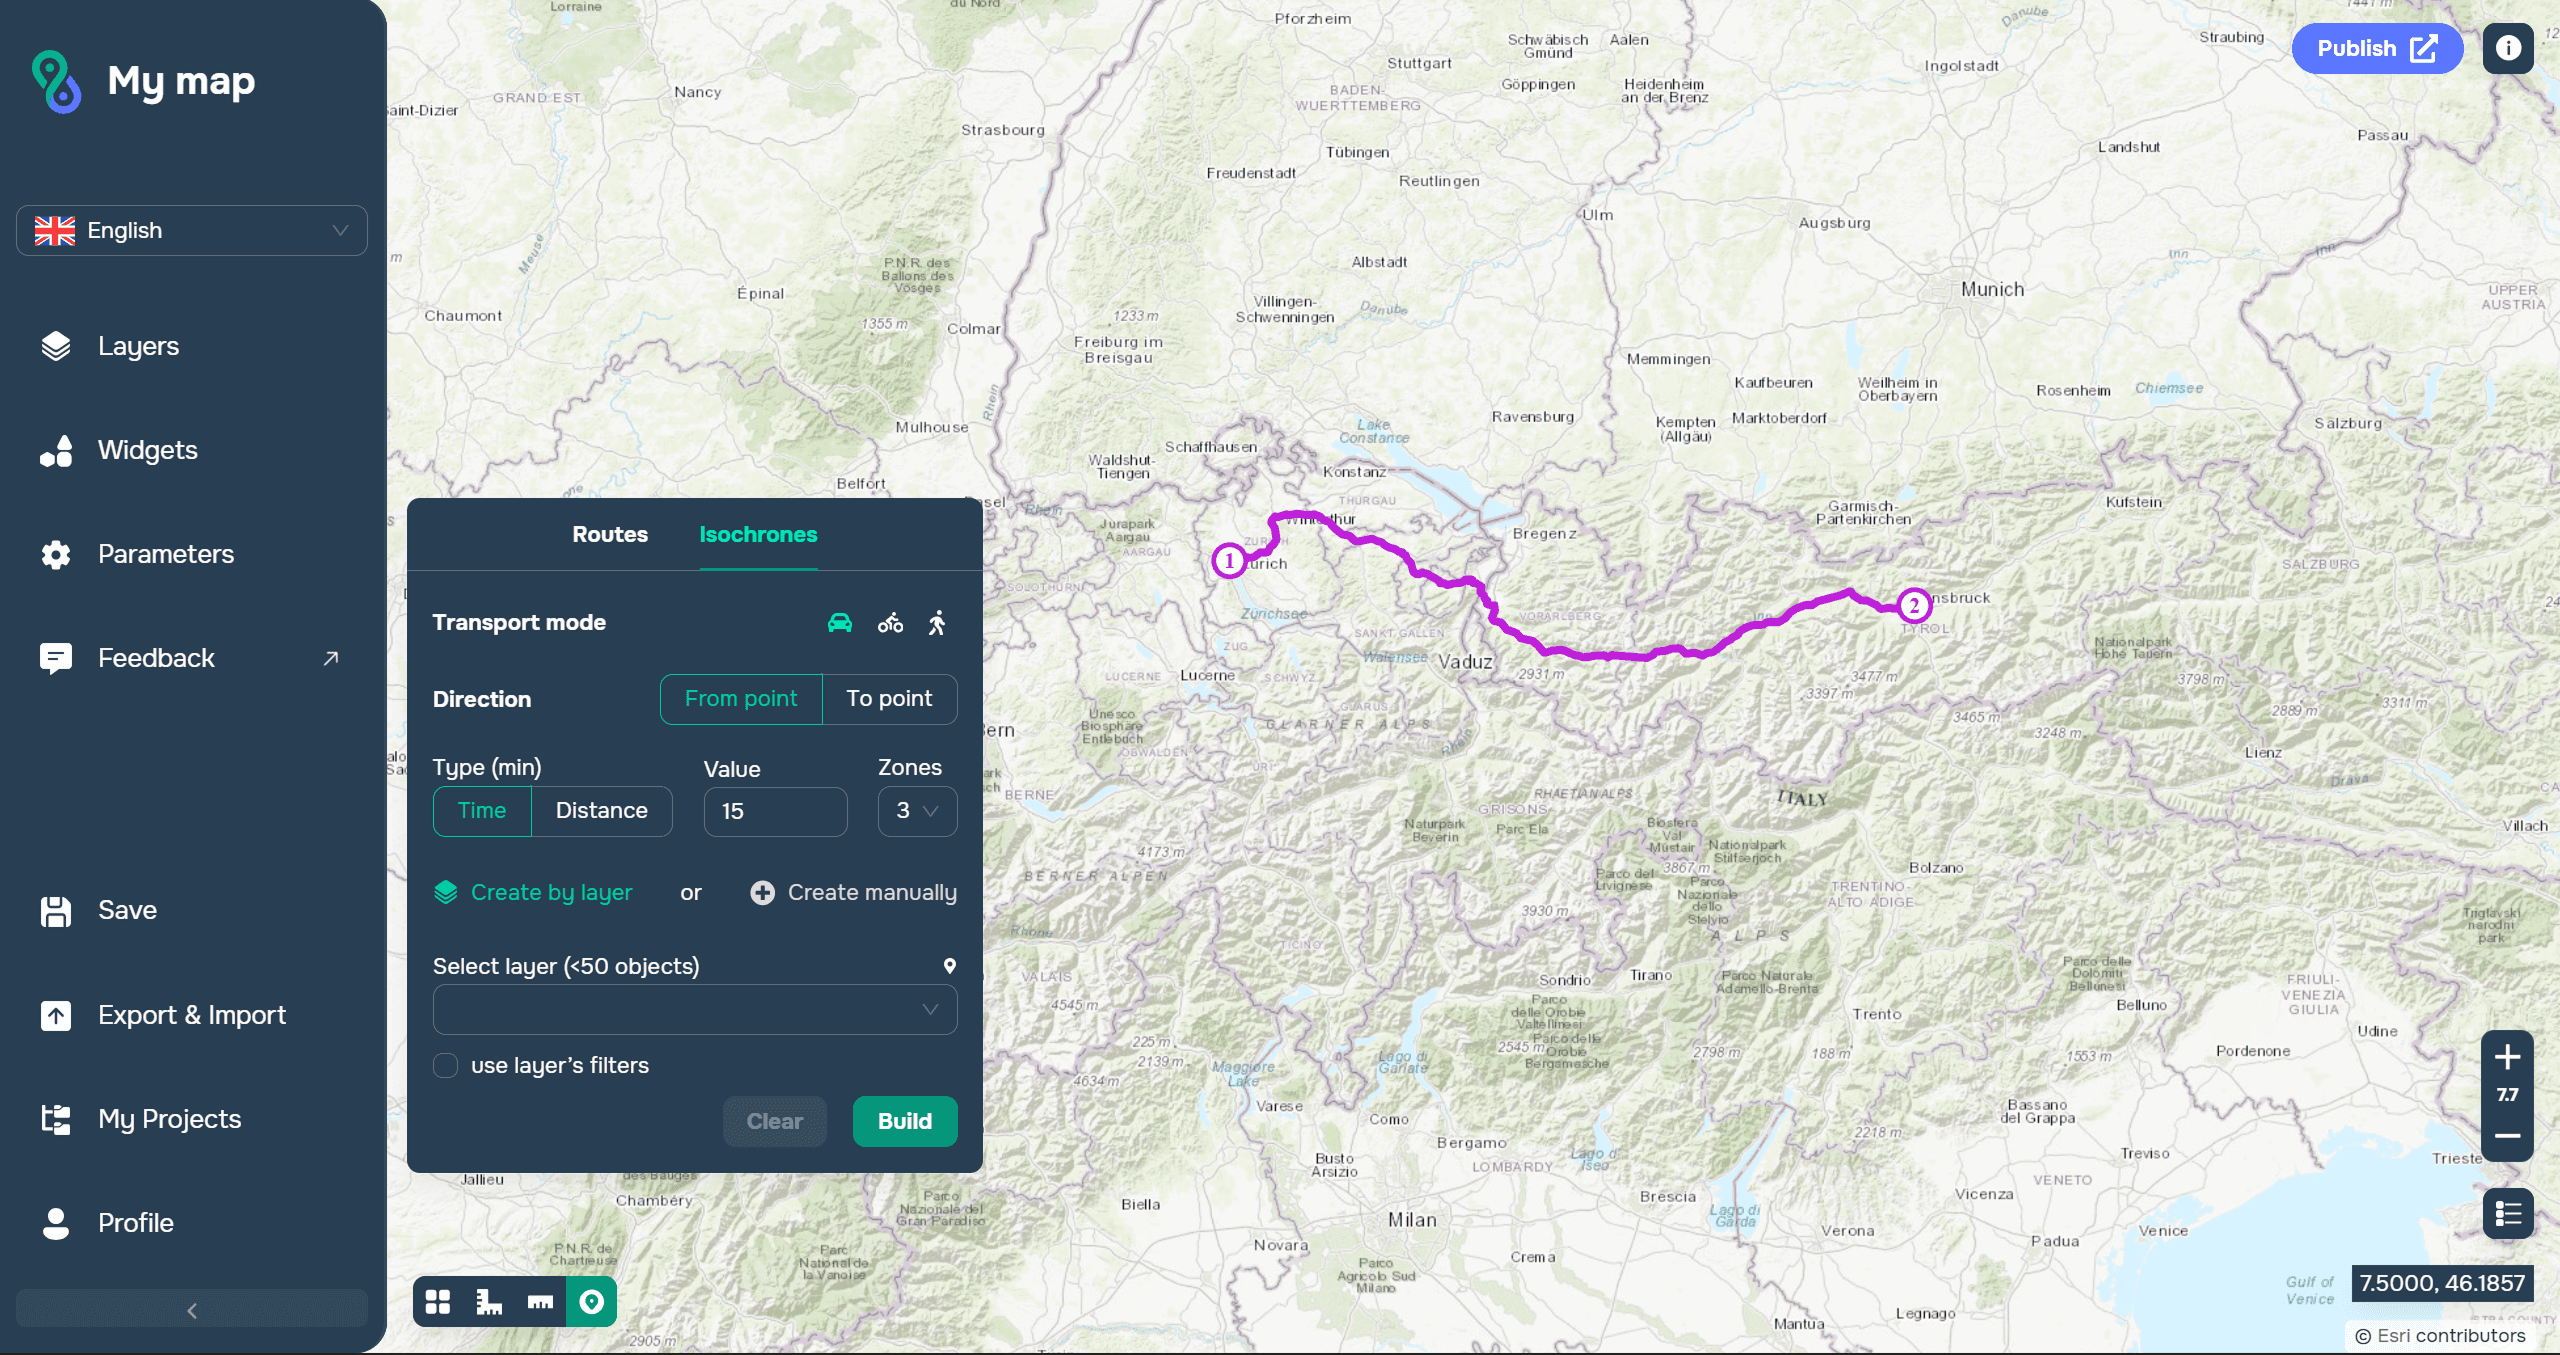
Once the reference points have been selected, the following parameters can be changed:
Transport mode (car, bicycle, or walking)
Direction (movement from or to a point)
Type (time or distance)
Value (in minutes or kilometers)
Zones (from one to three)
In other words, we need to specify the type of isochrone: in what time and by what means of travel we can get to or from a point.
There is also an option to generate isochrones by layer, taking into account the configured filters.
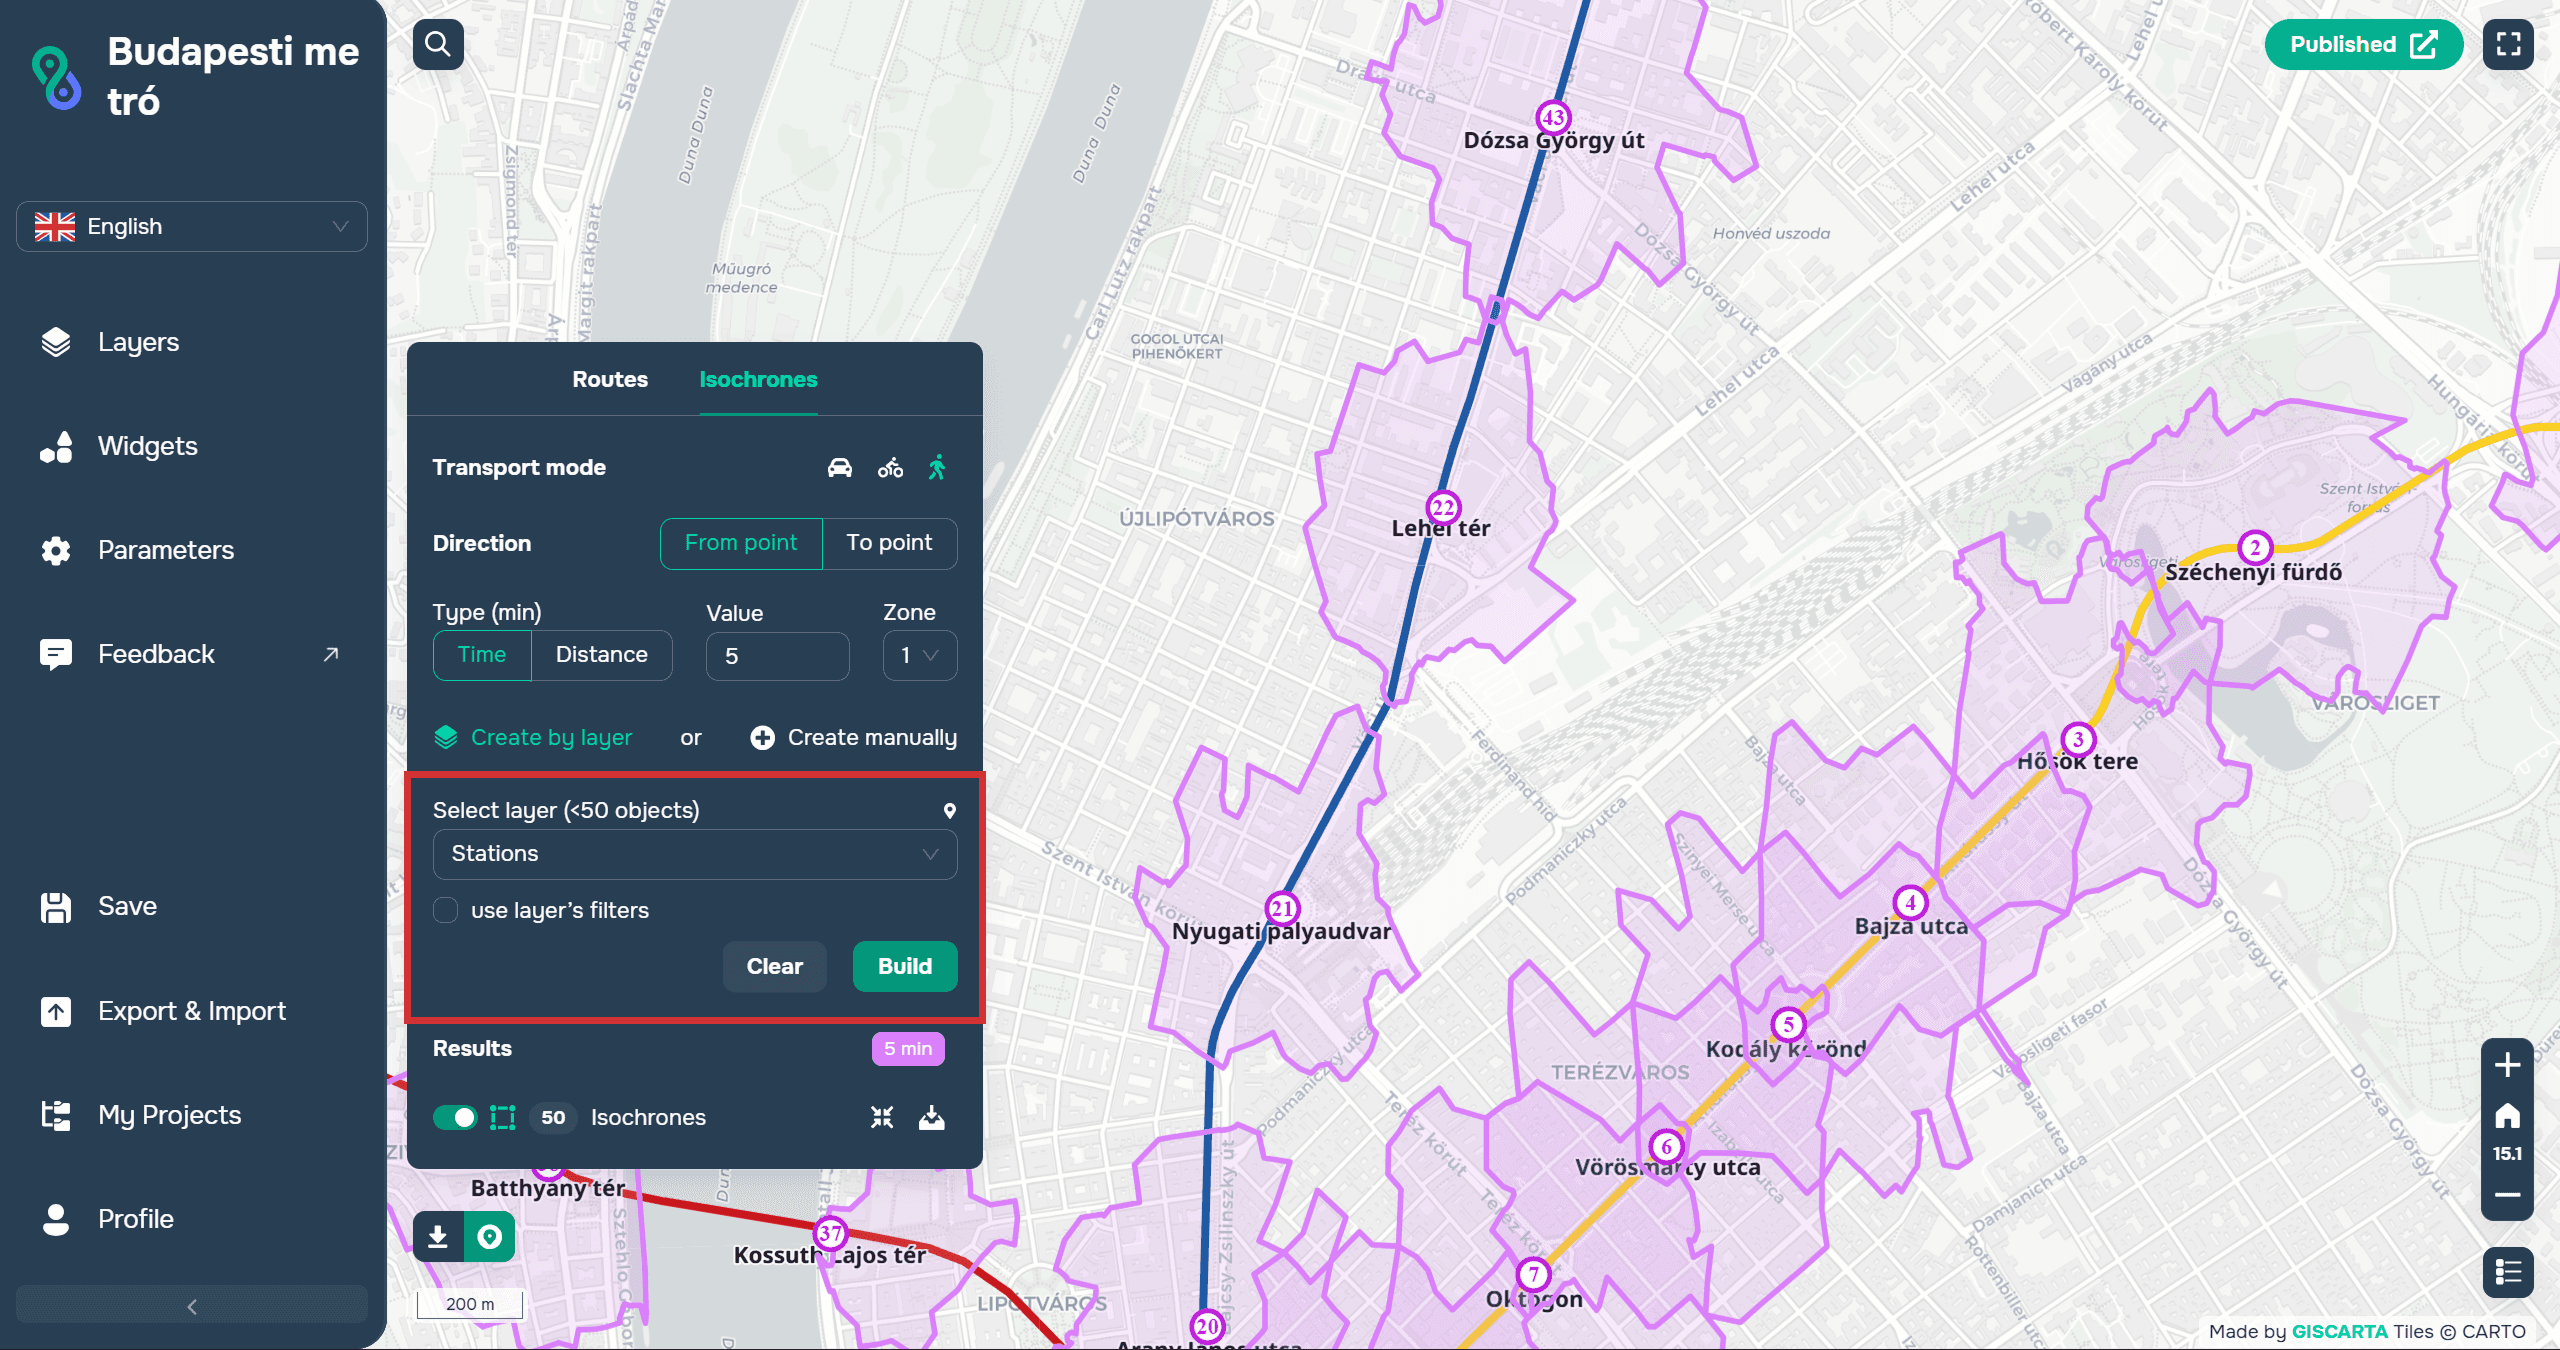
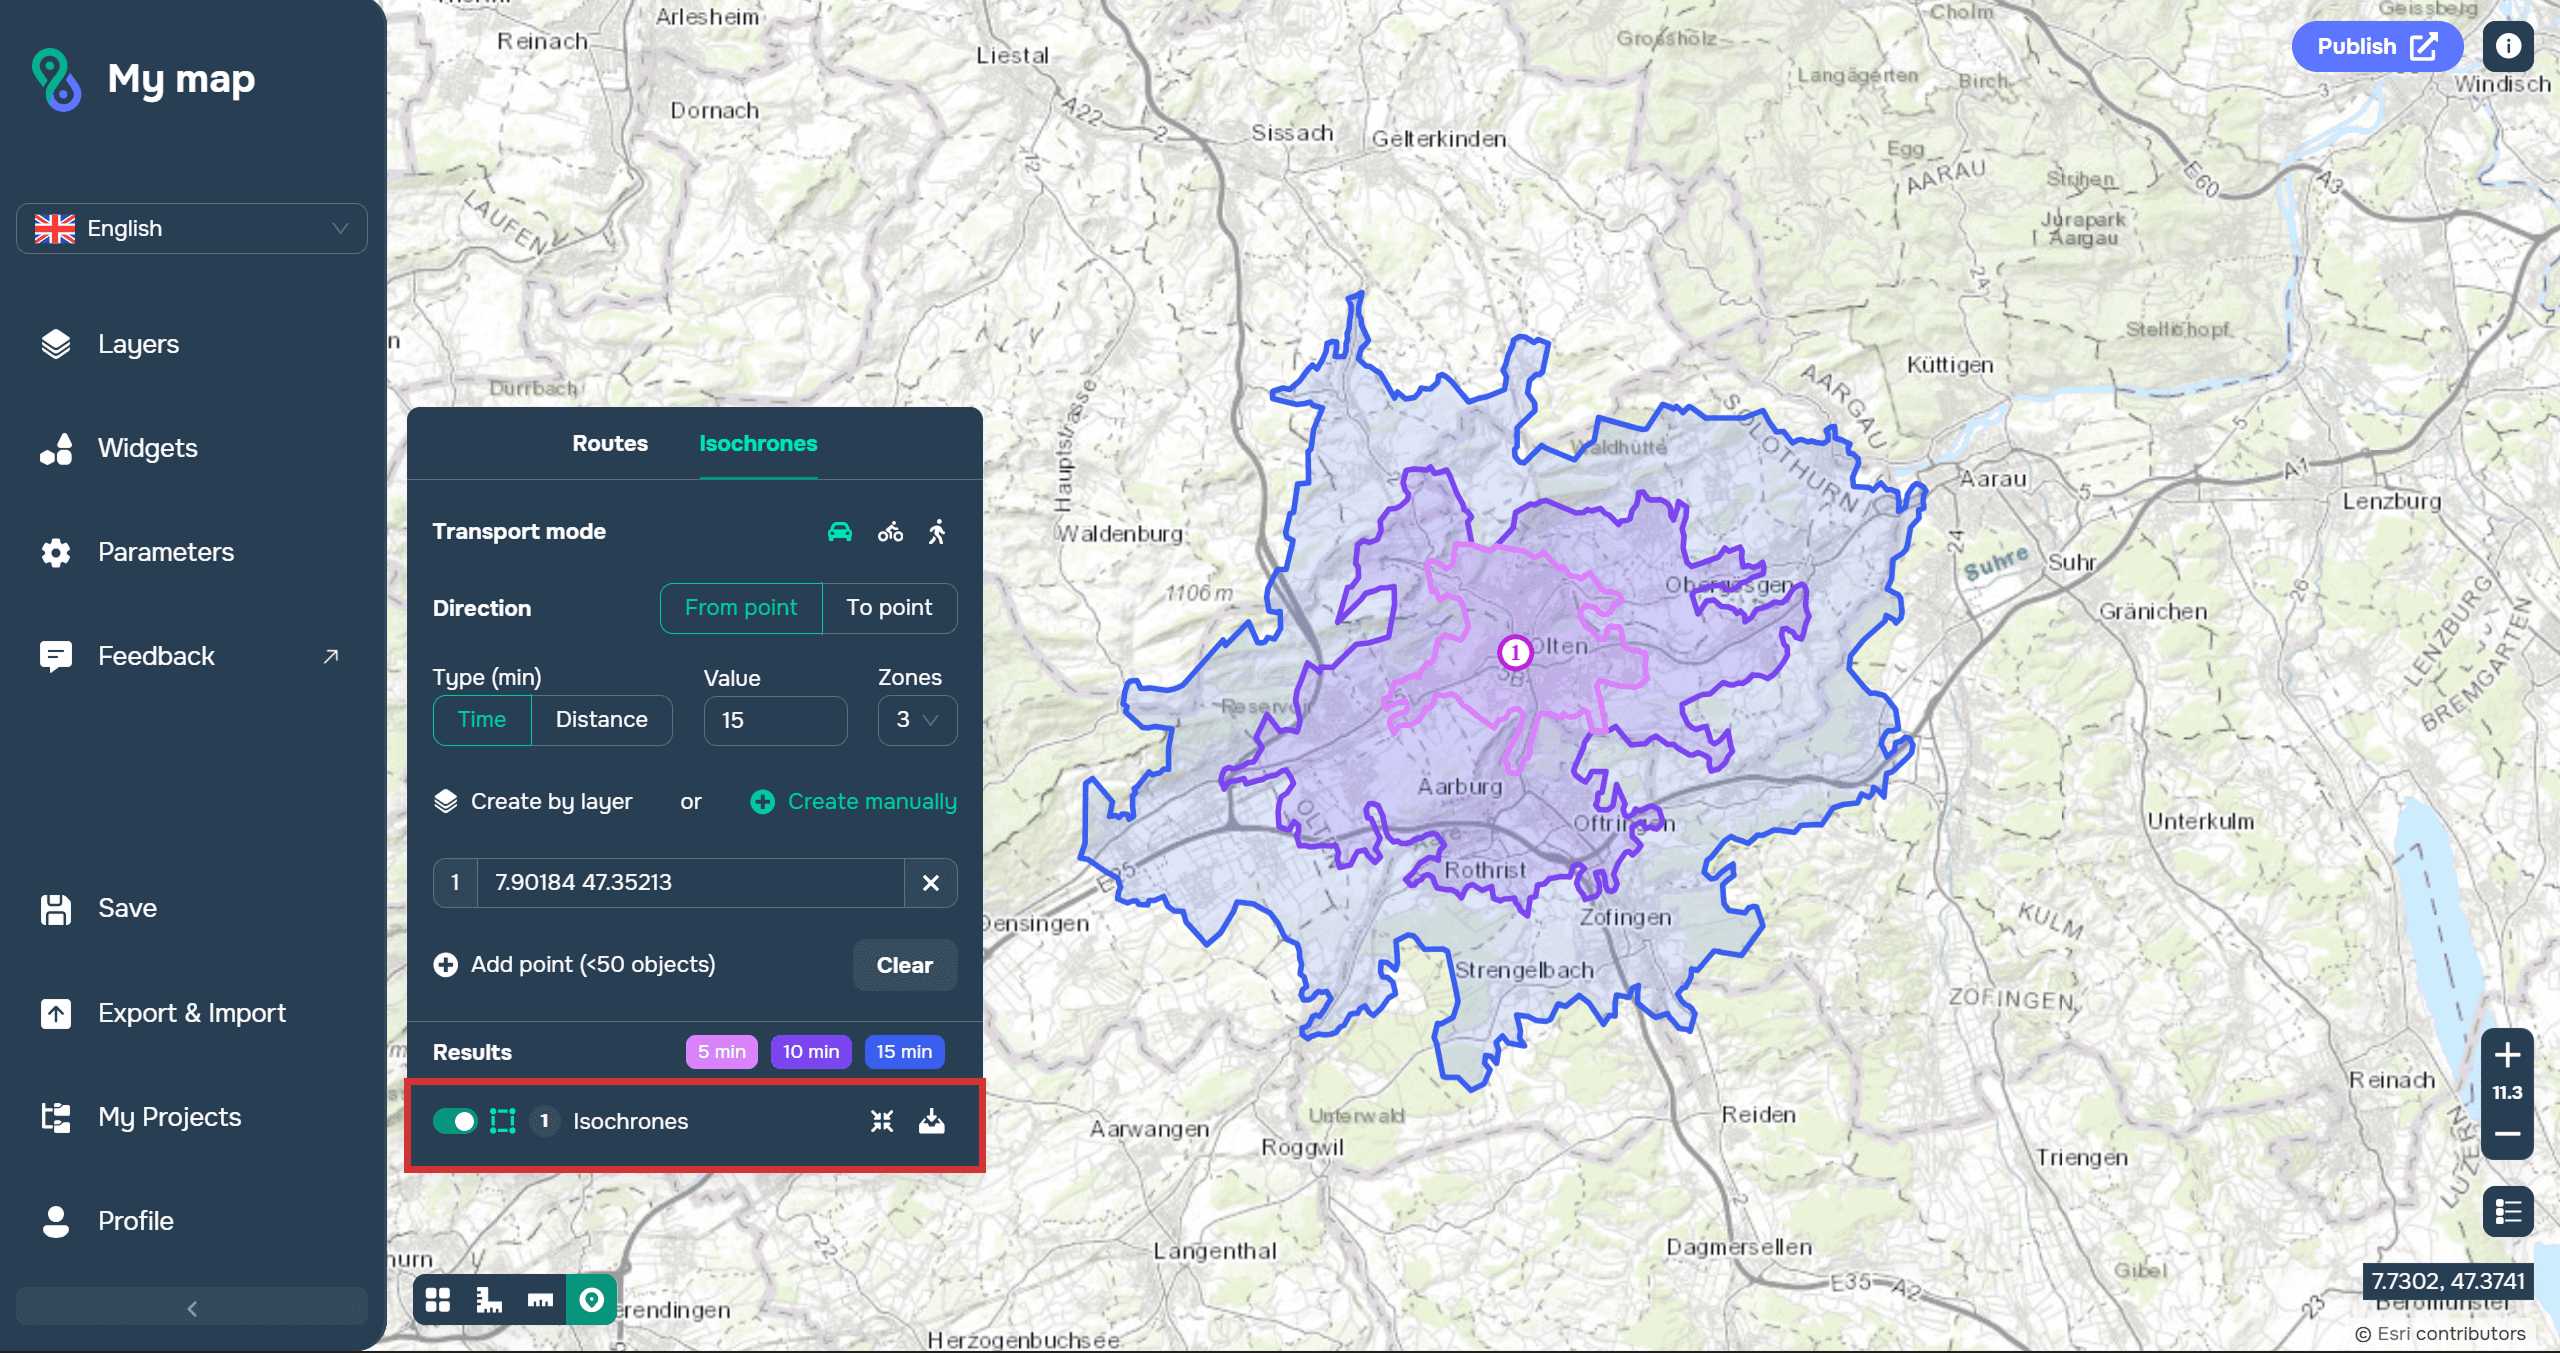
After generating isochrones, you can add the polygonal layer to the project. You can also save the layer to Data Sources.
The widget is based on GraphHopper, a platform and API for building routes and analyzing transport accessibility based on OpenStreetMap data.
Transport analysis can be used for such areas as:
Urban planning
Transport Analysis
Construction
Agriculture
Mining
Geology
Hydrology
Student studies
Environmental studies