The platform allows you to create your own layers, which are automatically uploaded to the Data Sources section and to the map. Layers can be of four types:
Point
Line
Polygon
Graphic
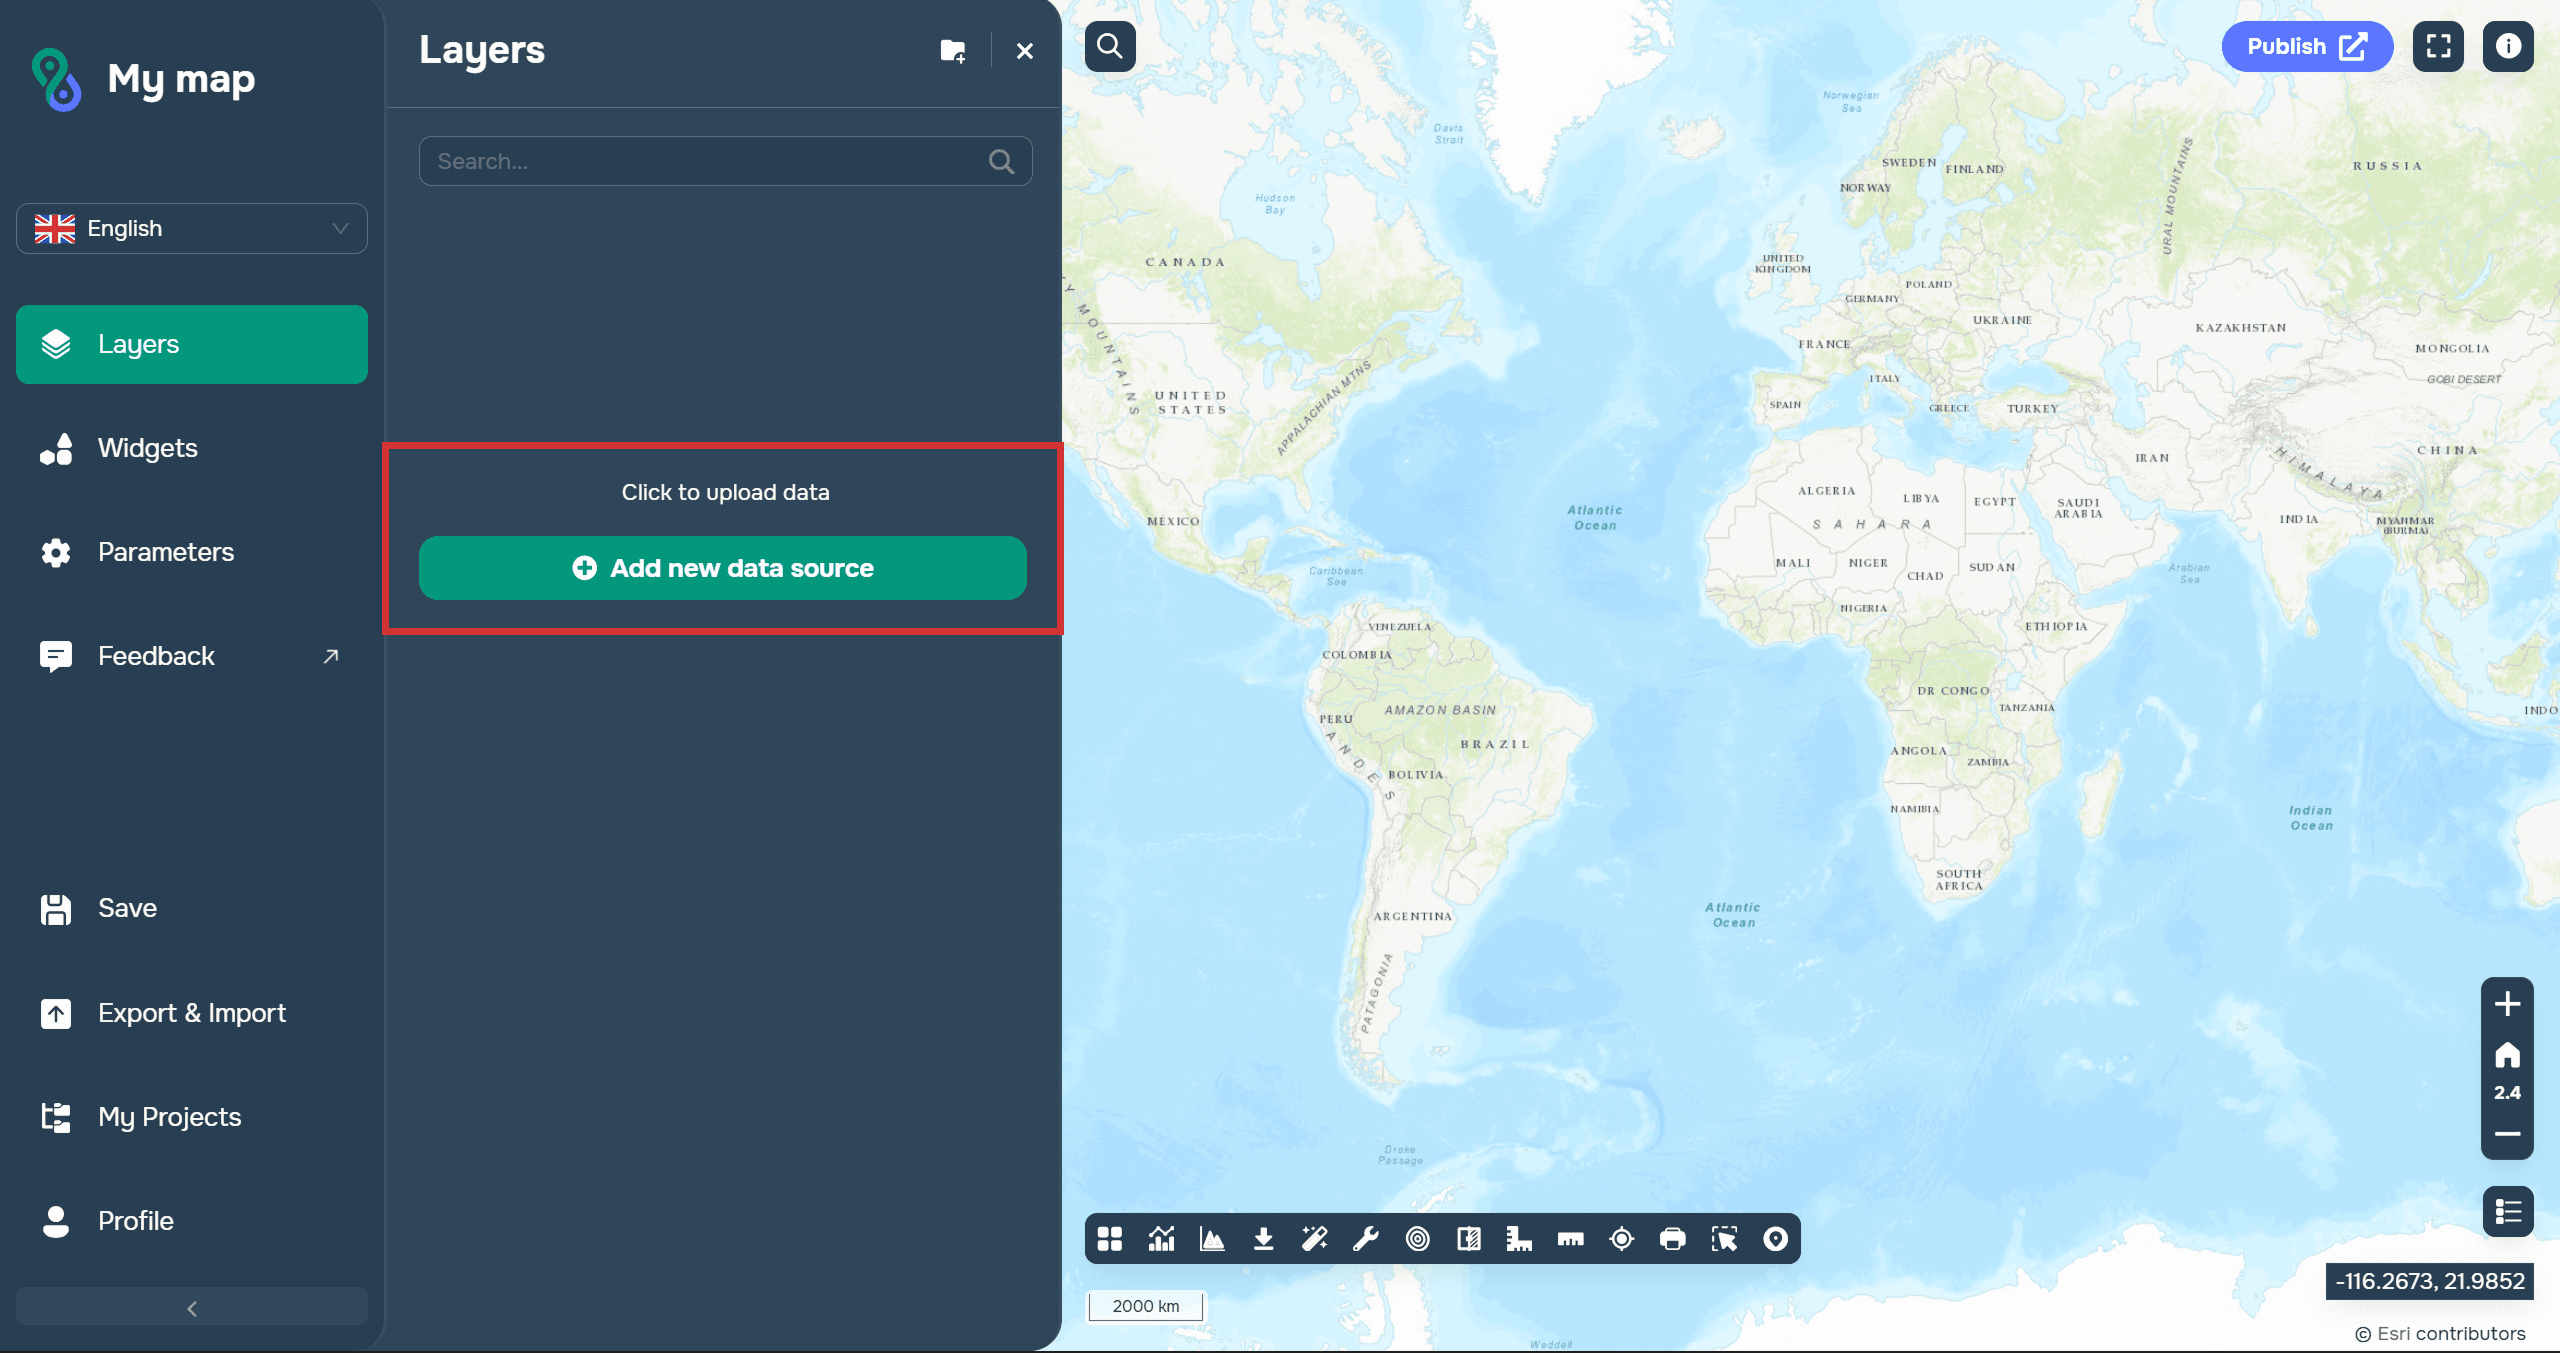
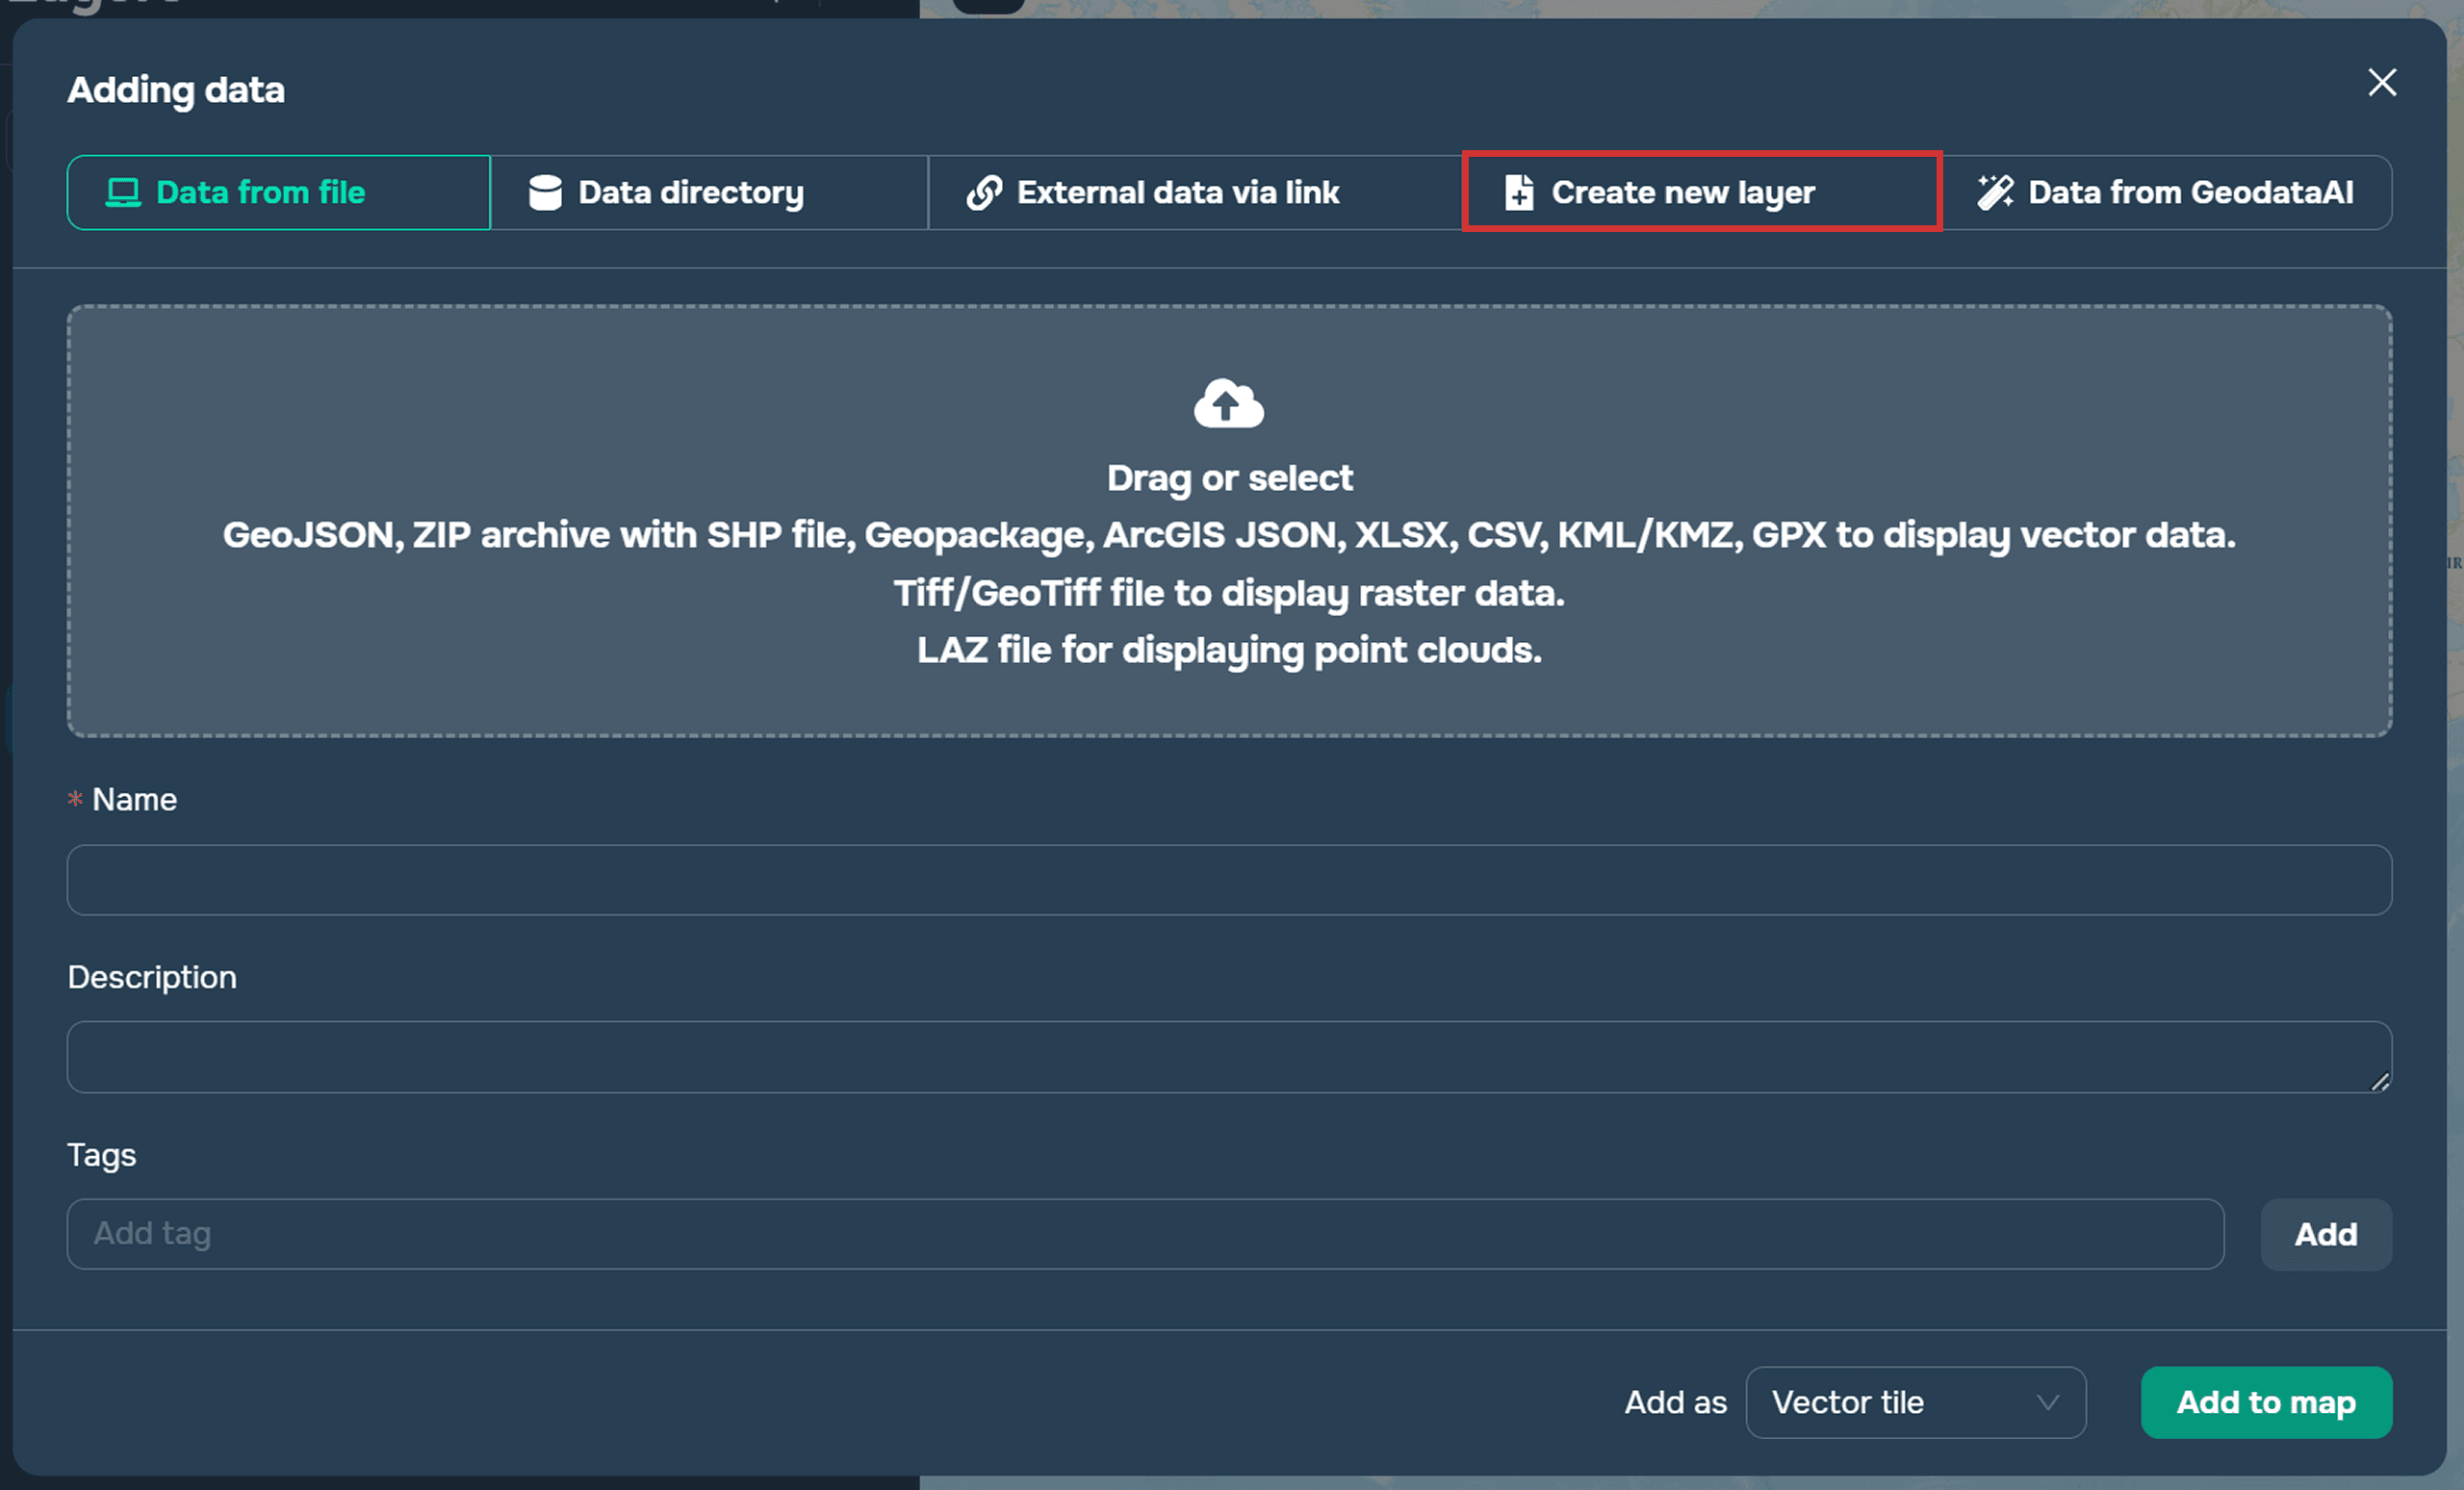
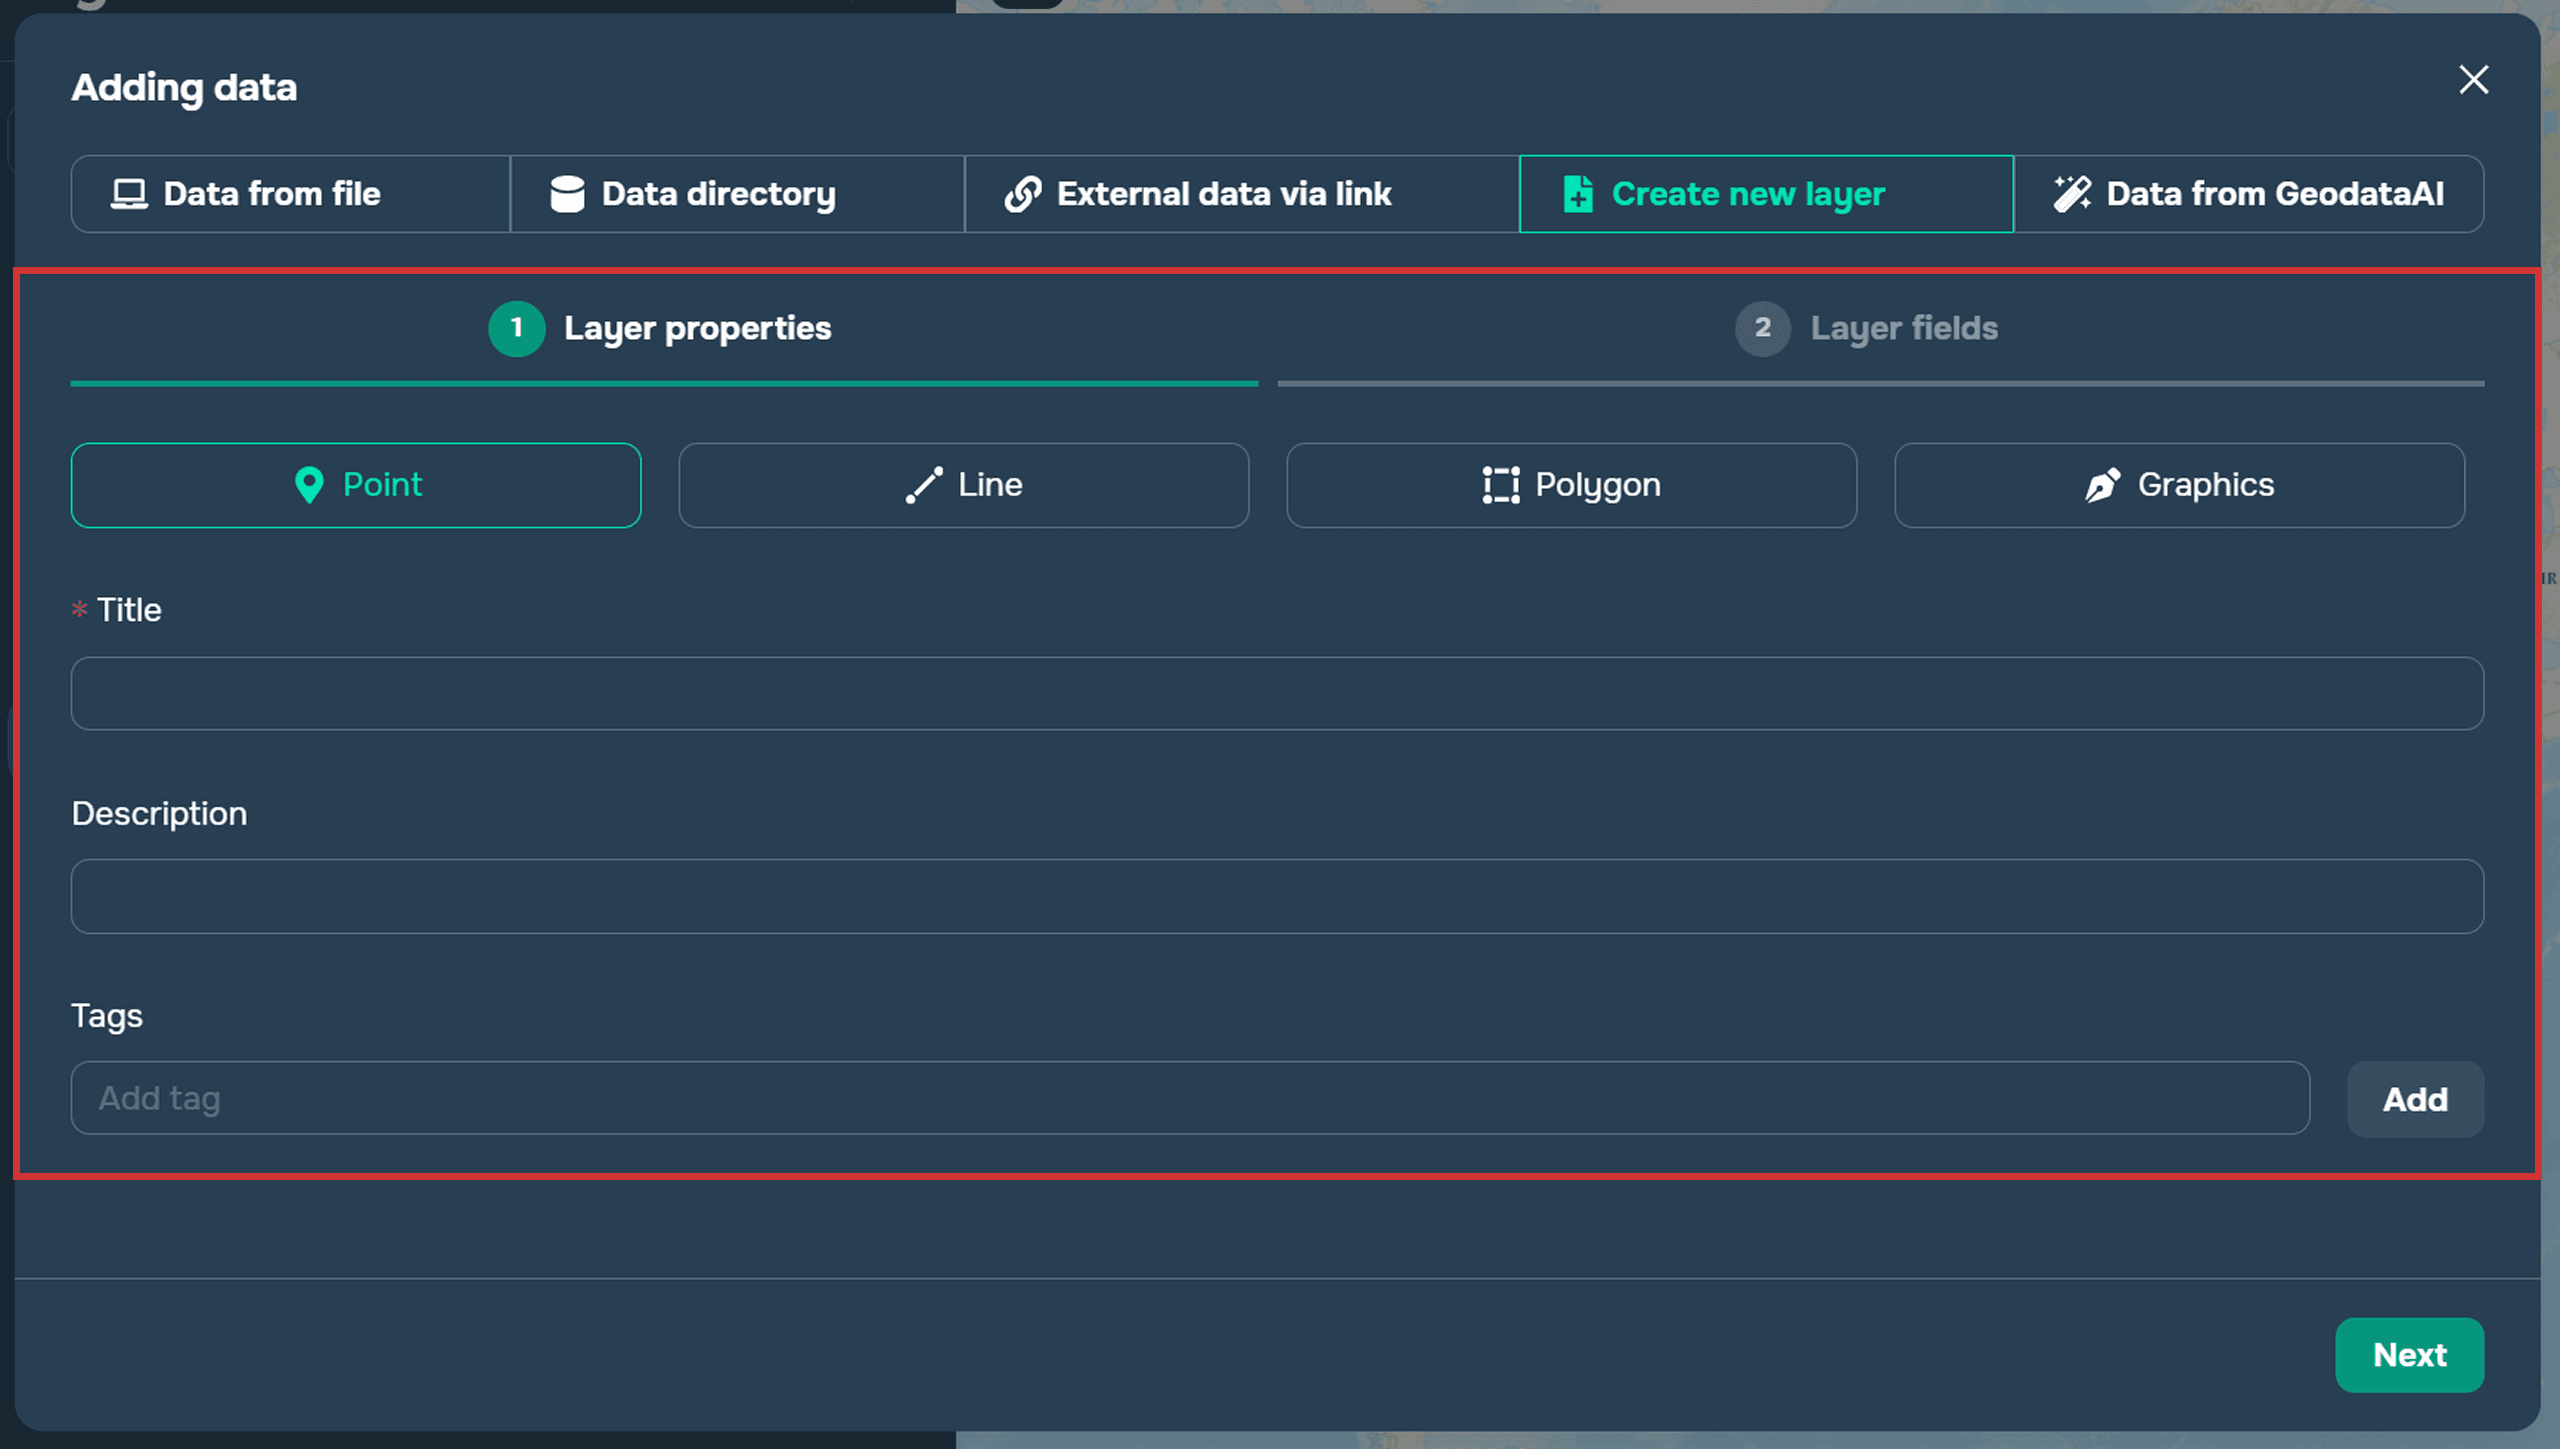
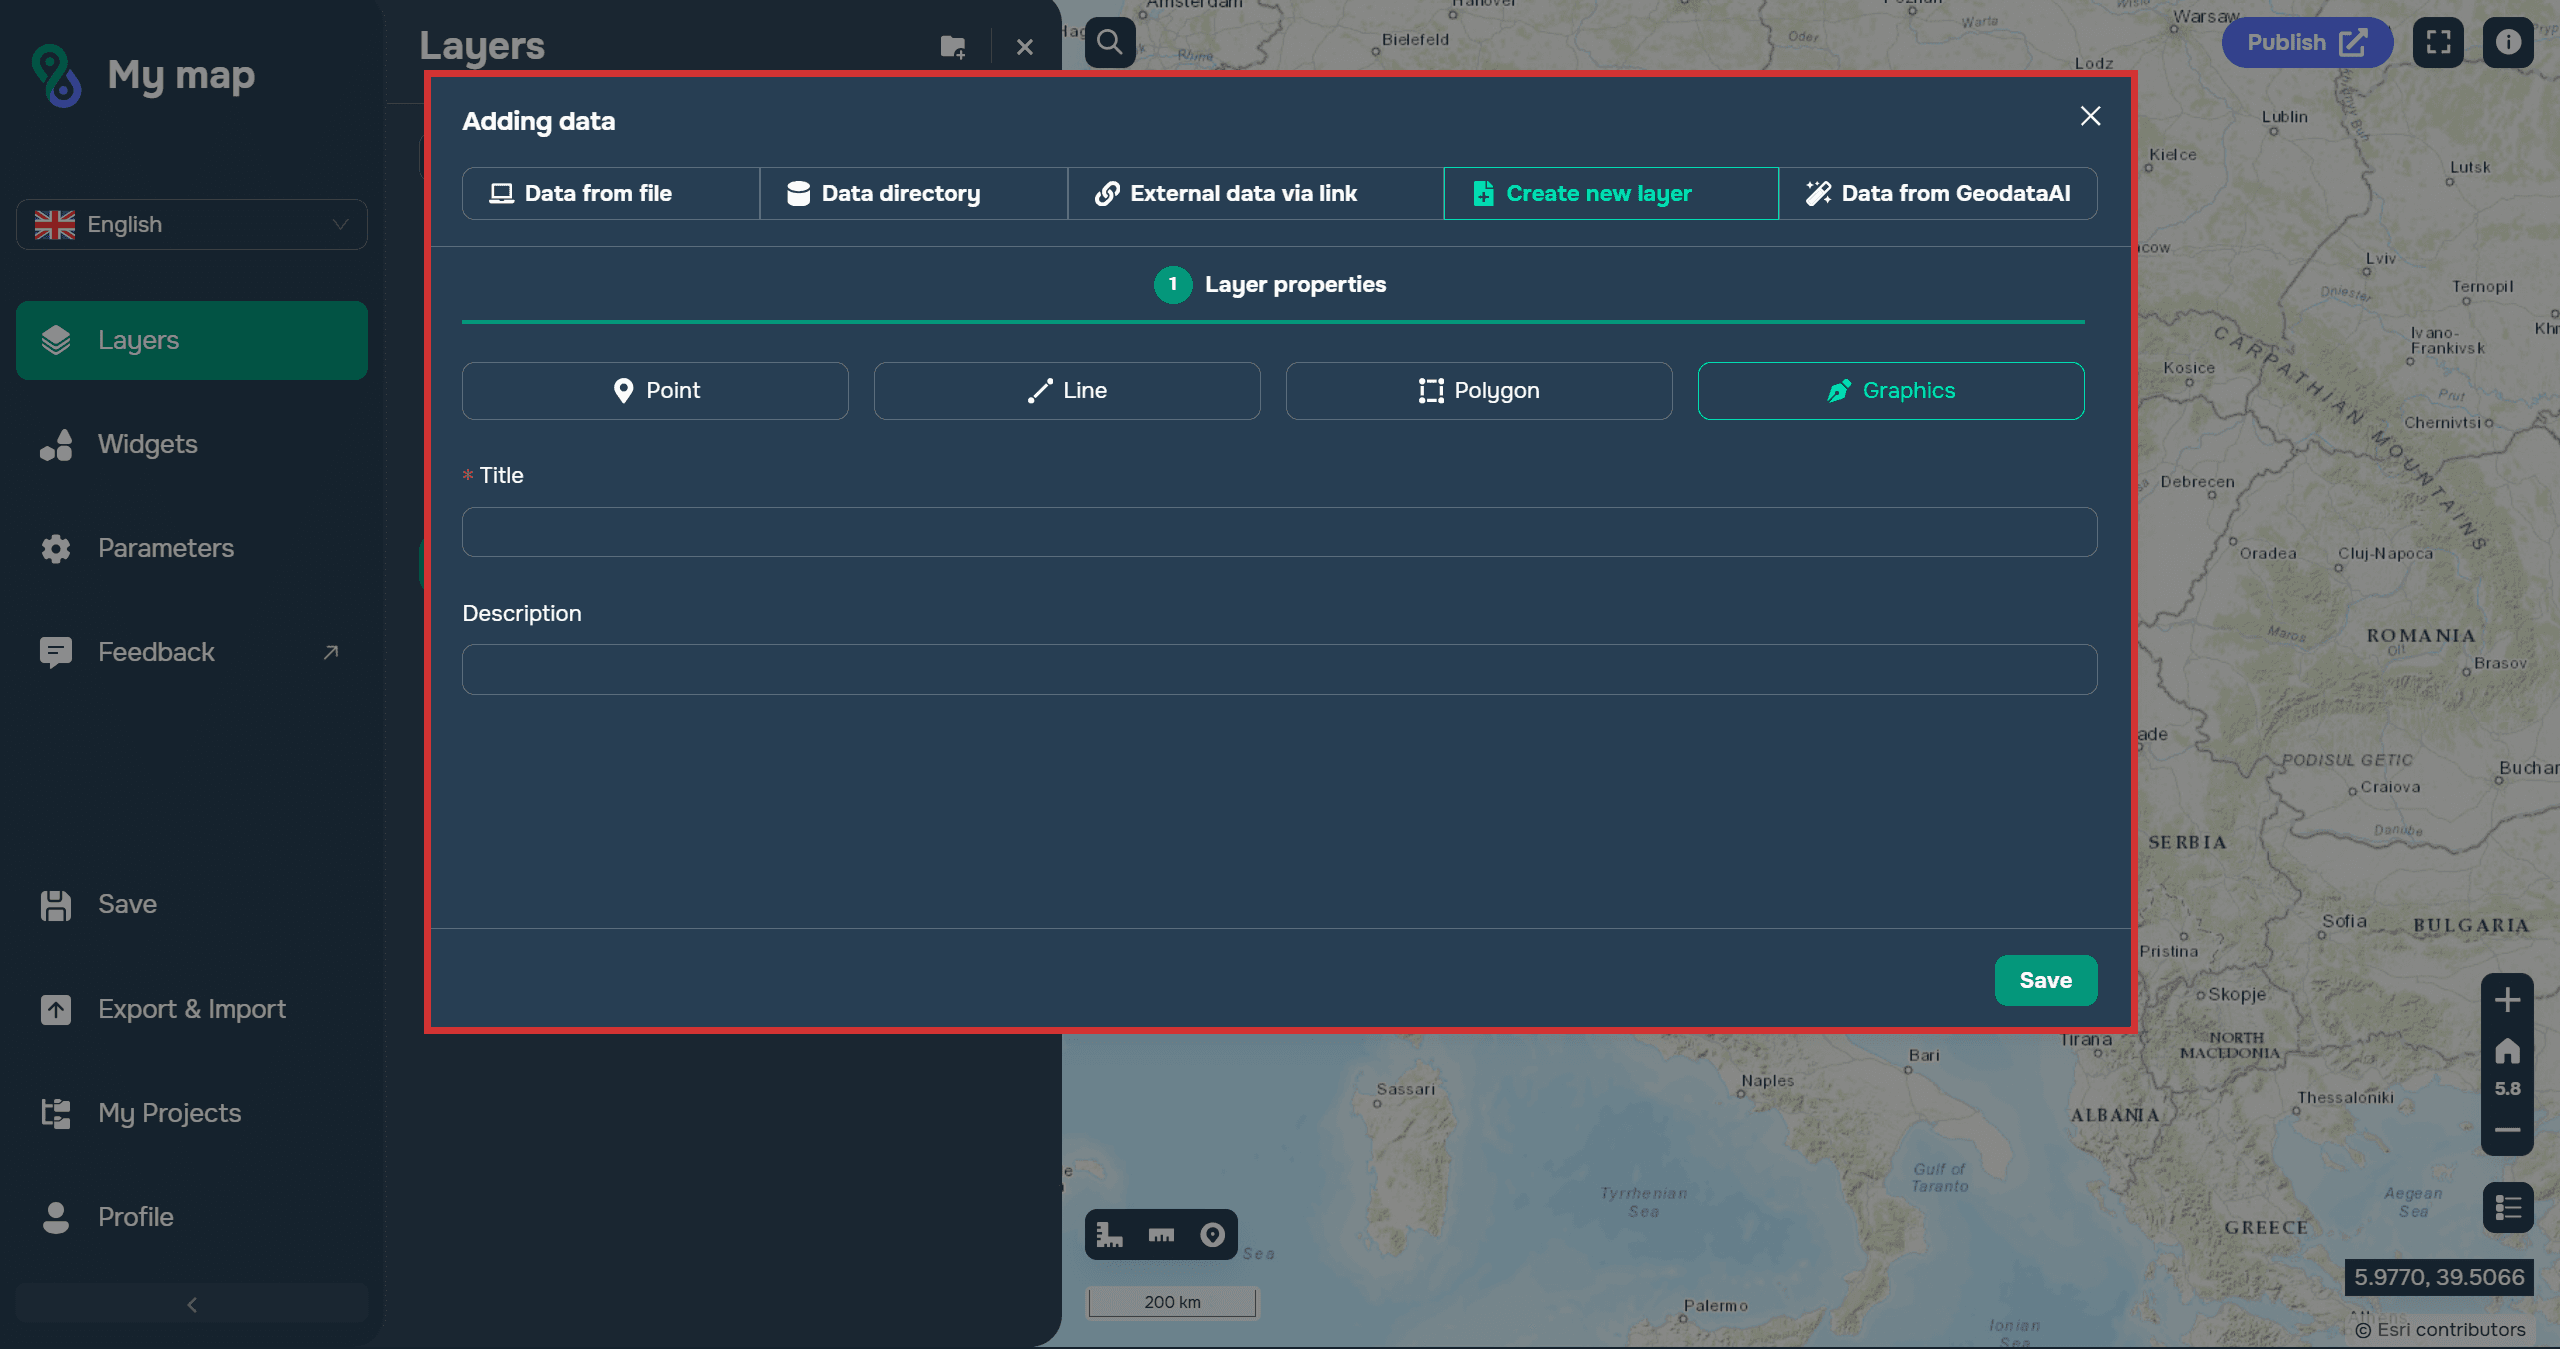
To create a new layer, go to the Layers section, then click the Add new source button and select Create new layer in the upper right corner.
Step 1. In the window, you need to select the layer geometry type (points, lines, polygons, graphics), specify a title, add a description and tags if desired, and click Next.
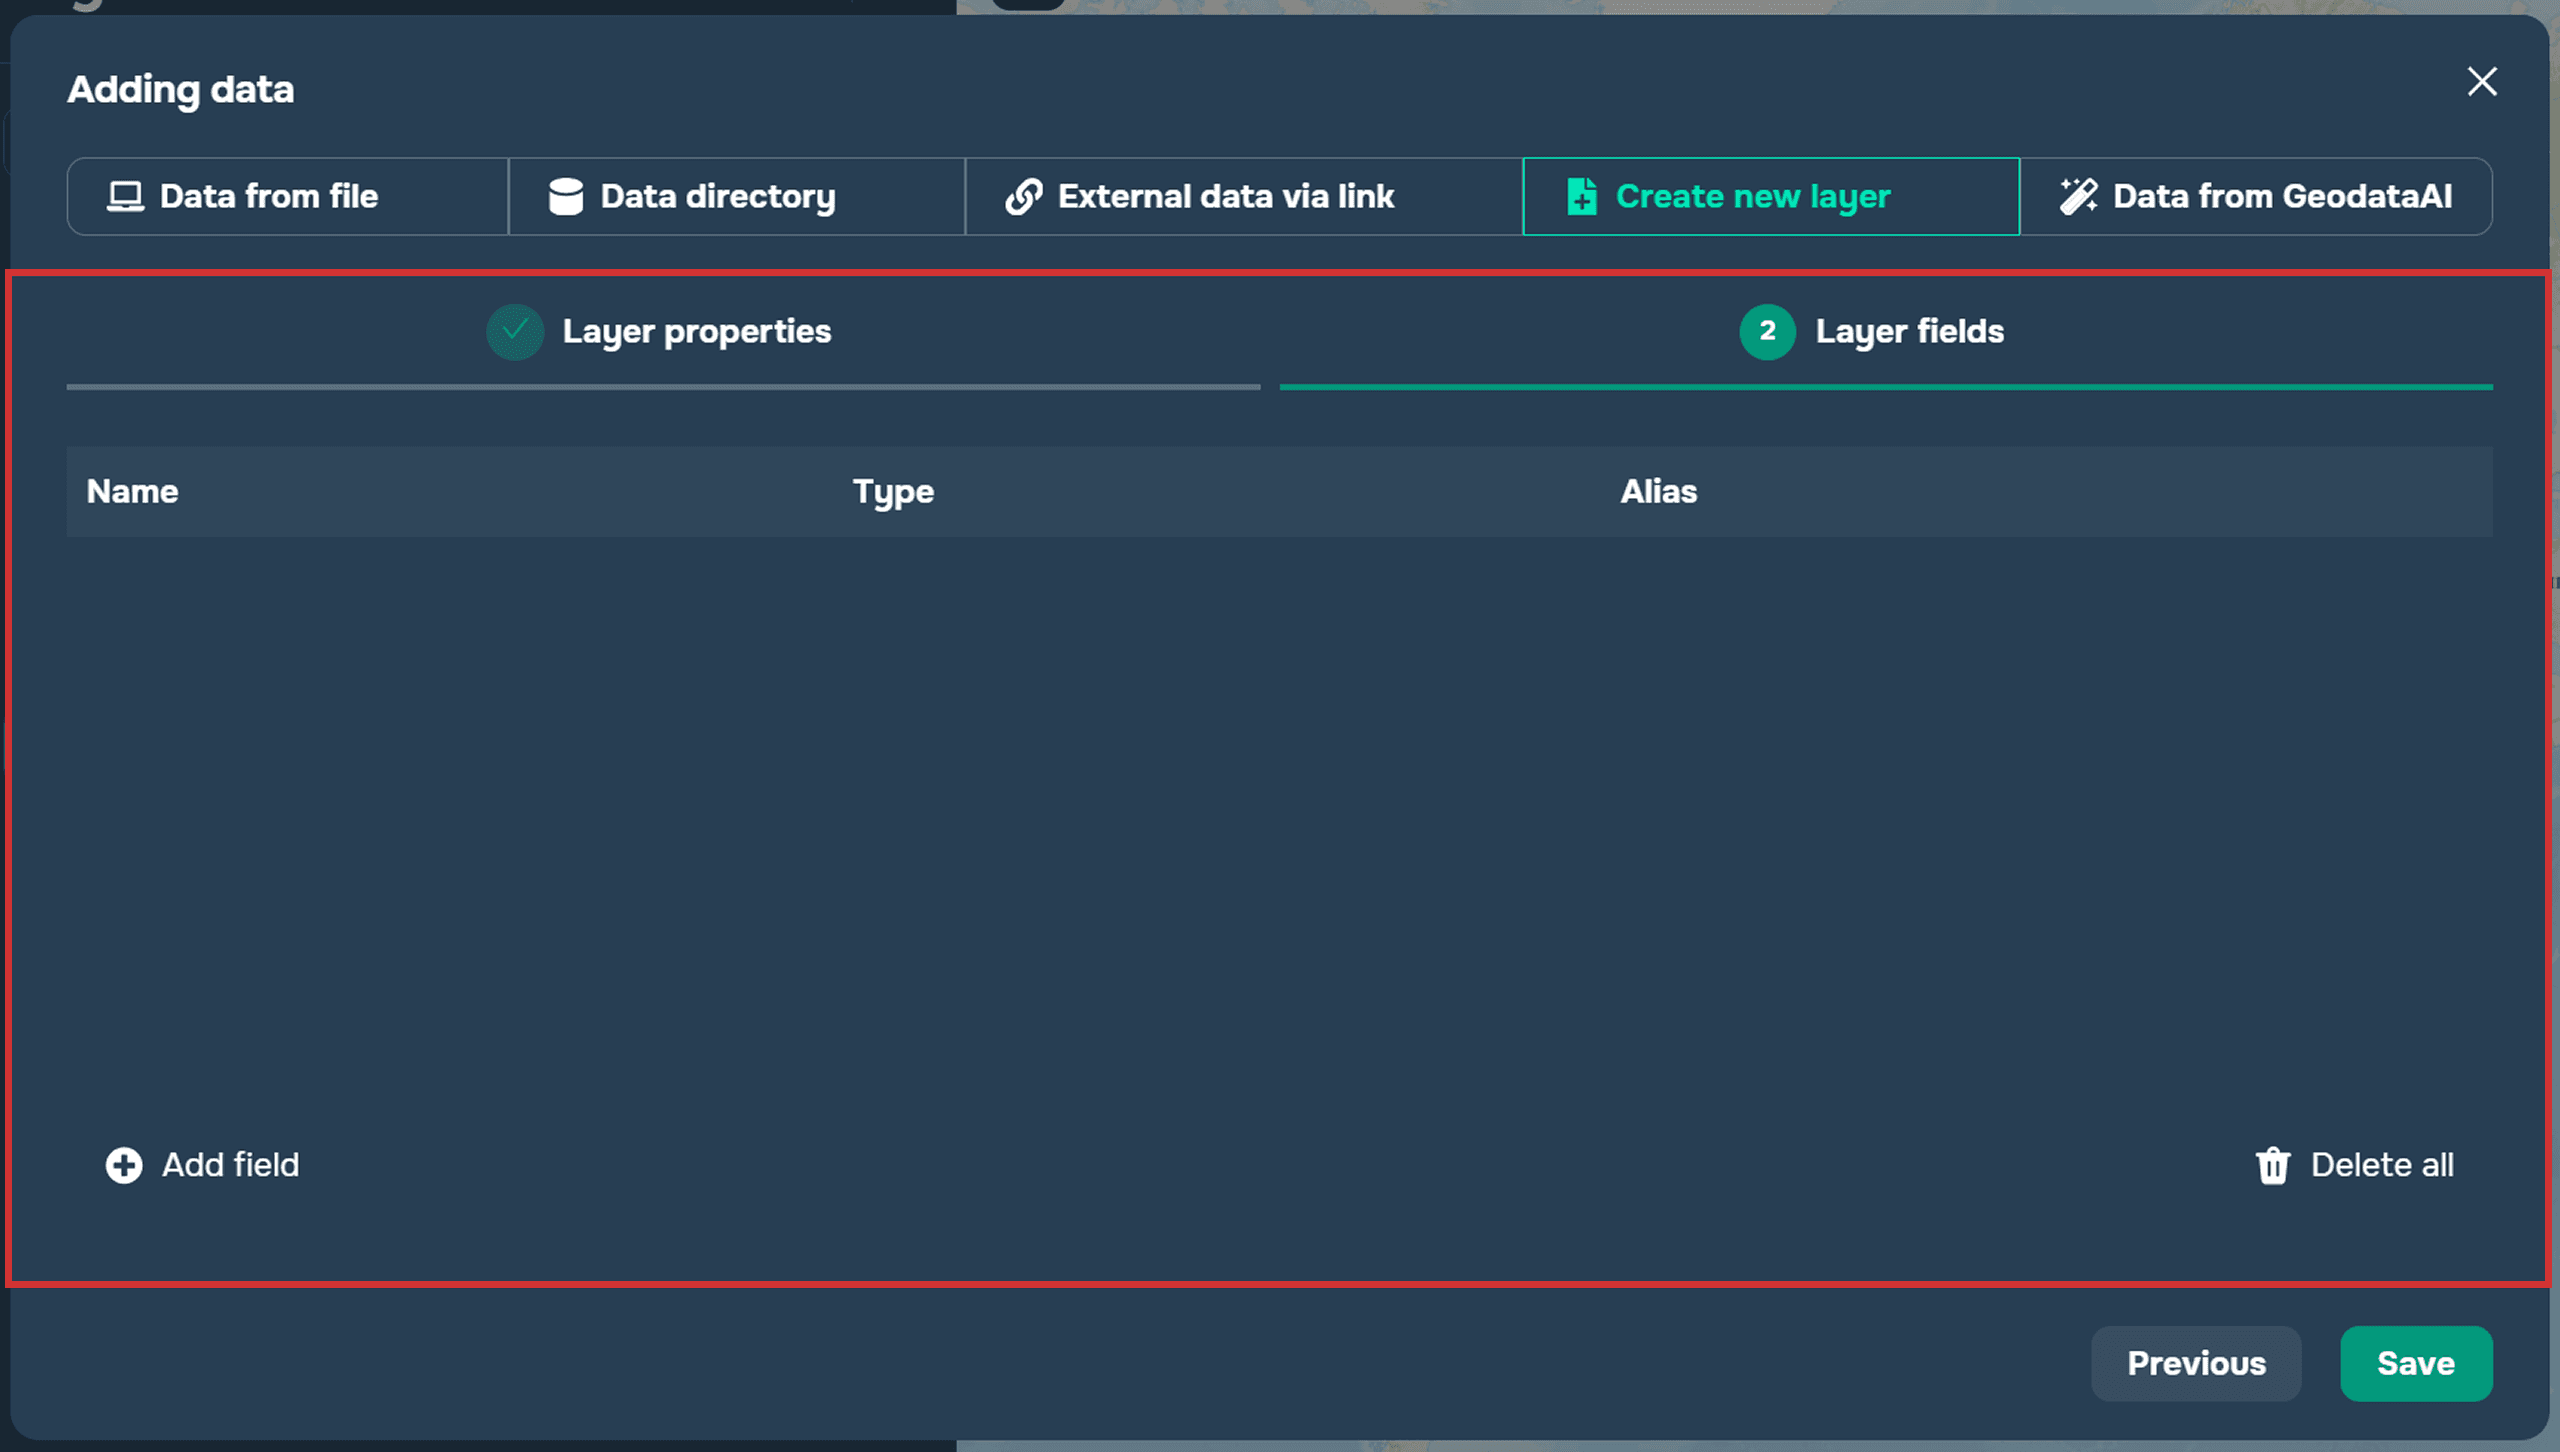
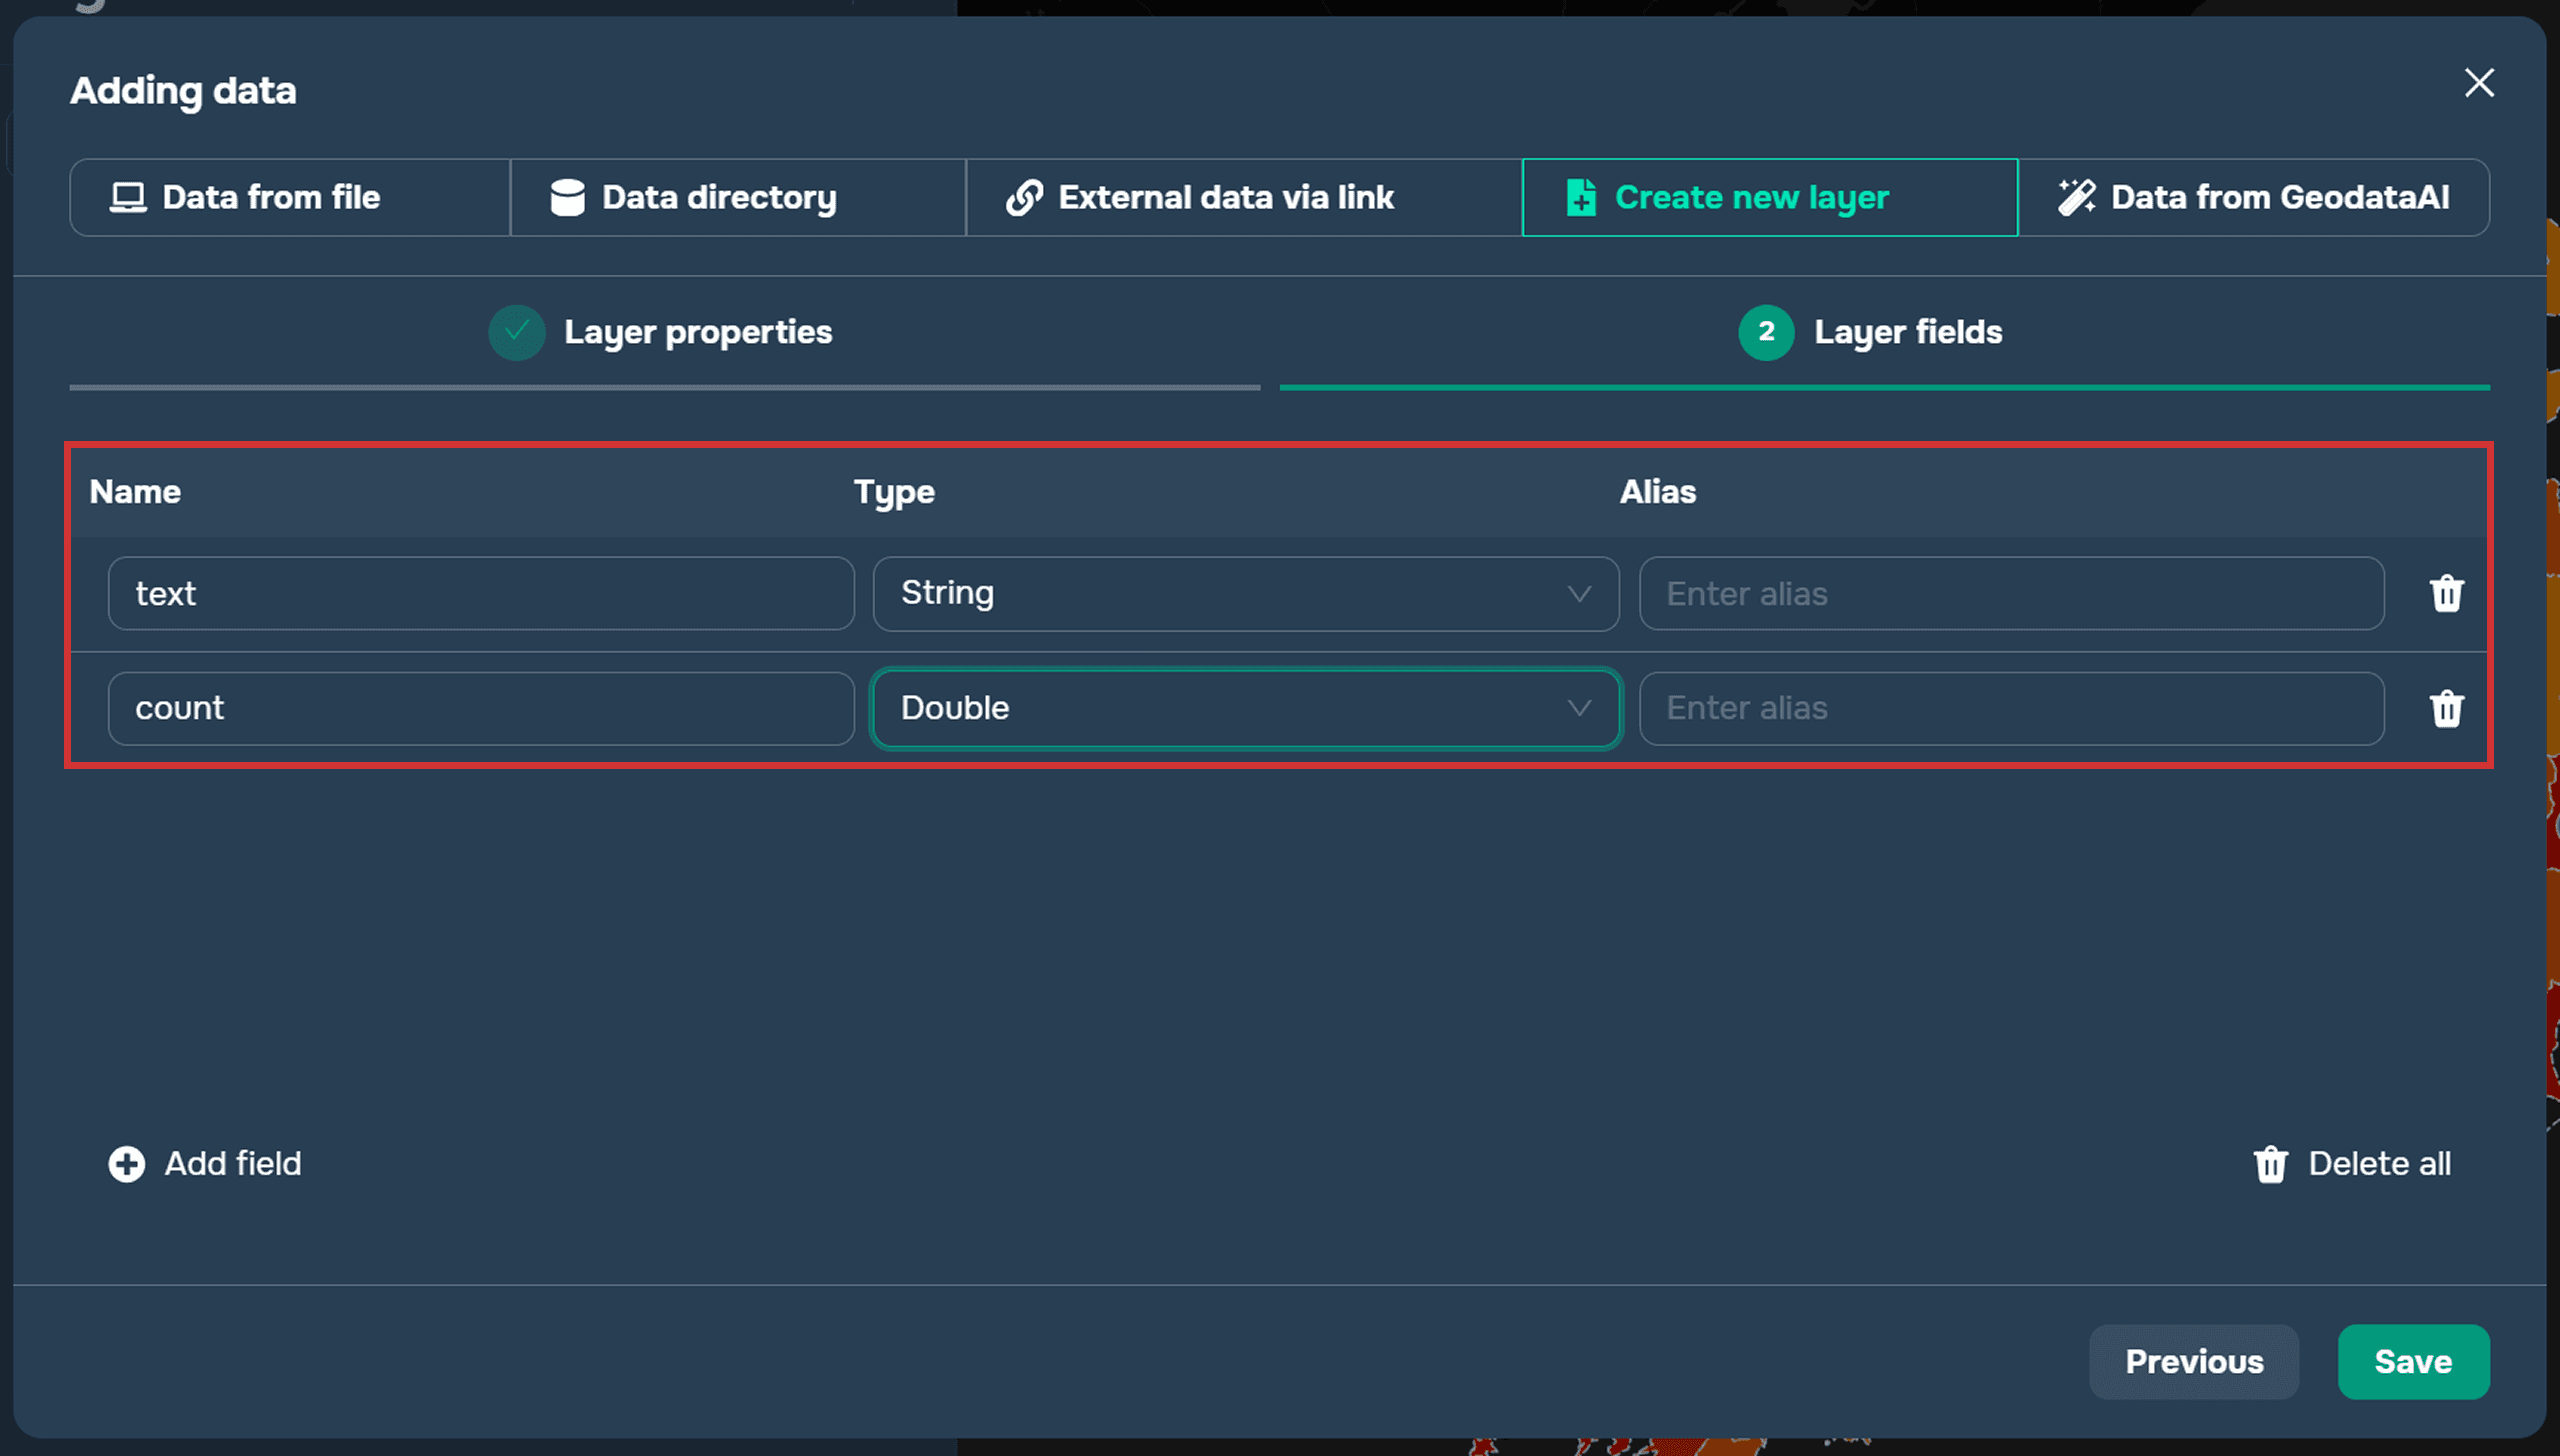
Step 2. Create attributes for the future layer, specifying data types and aliases. Then click Save.
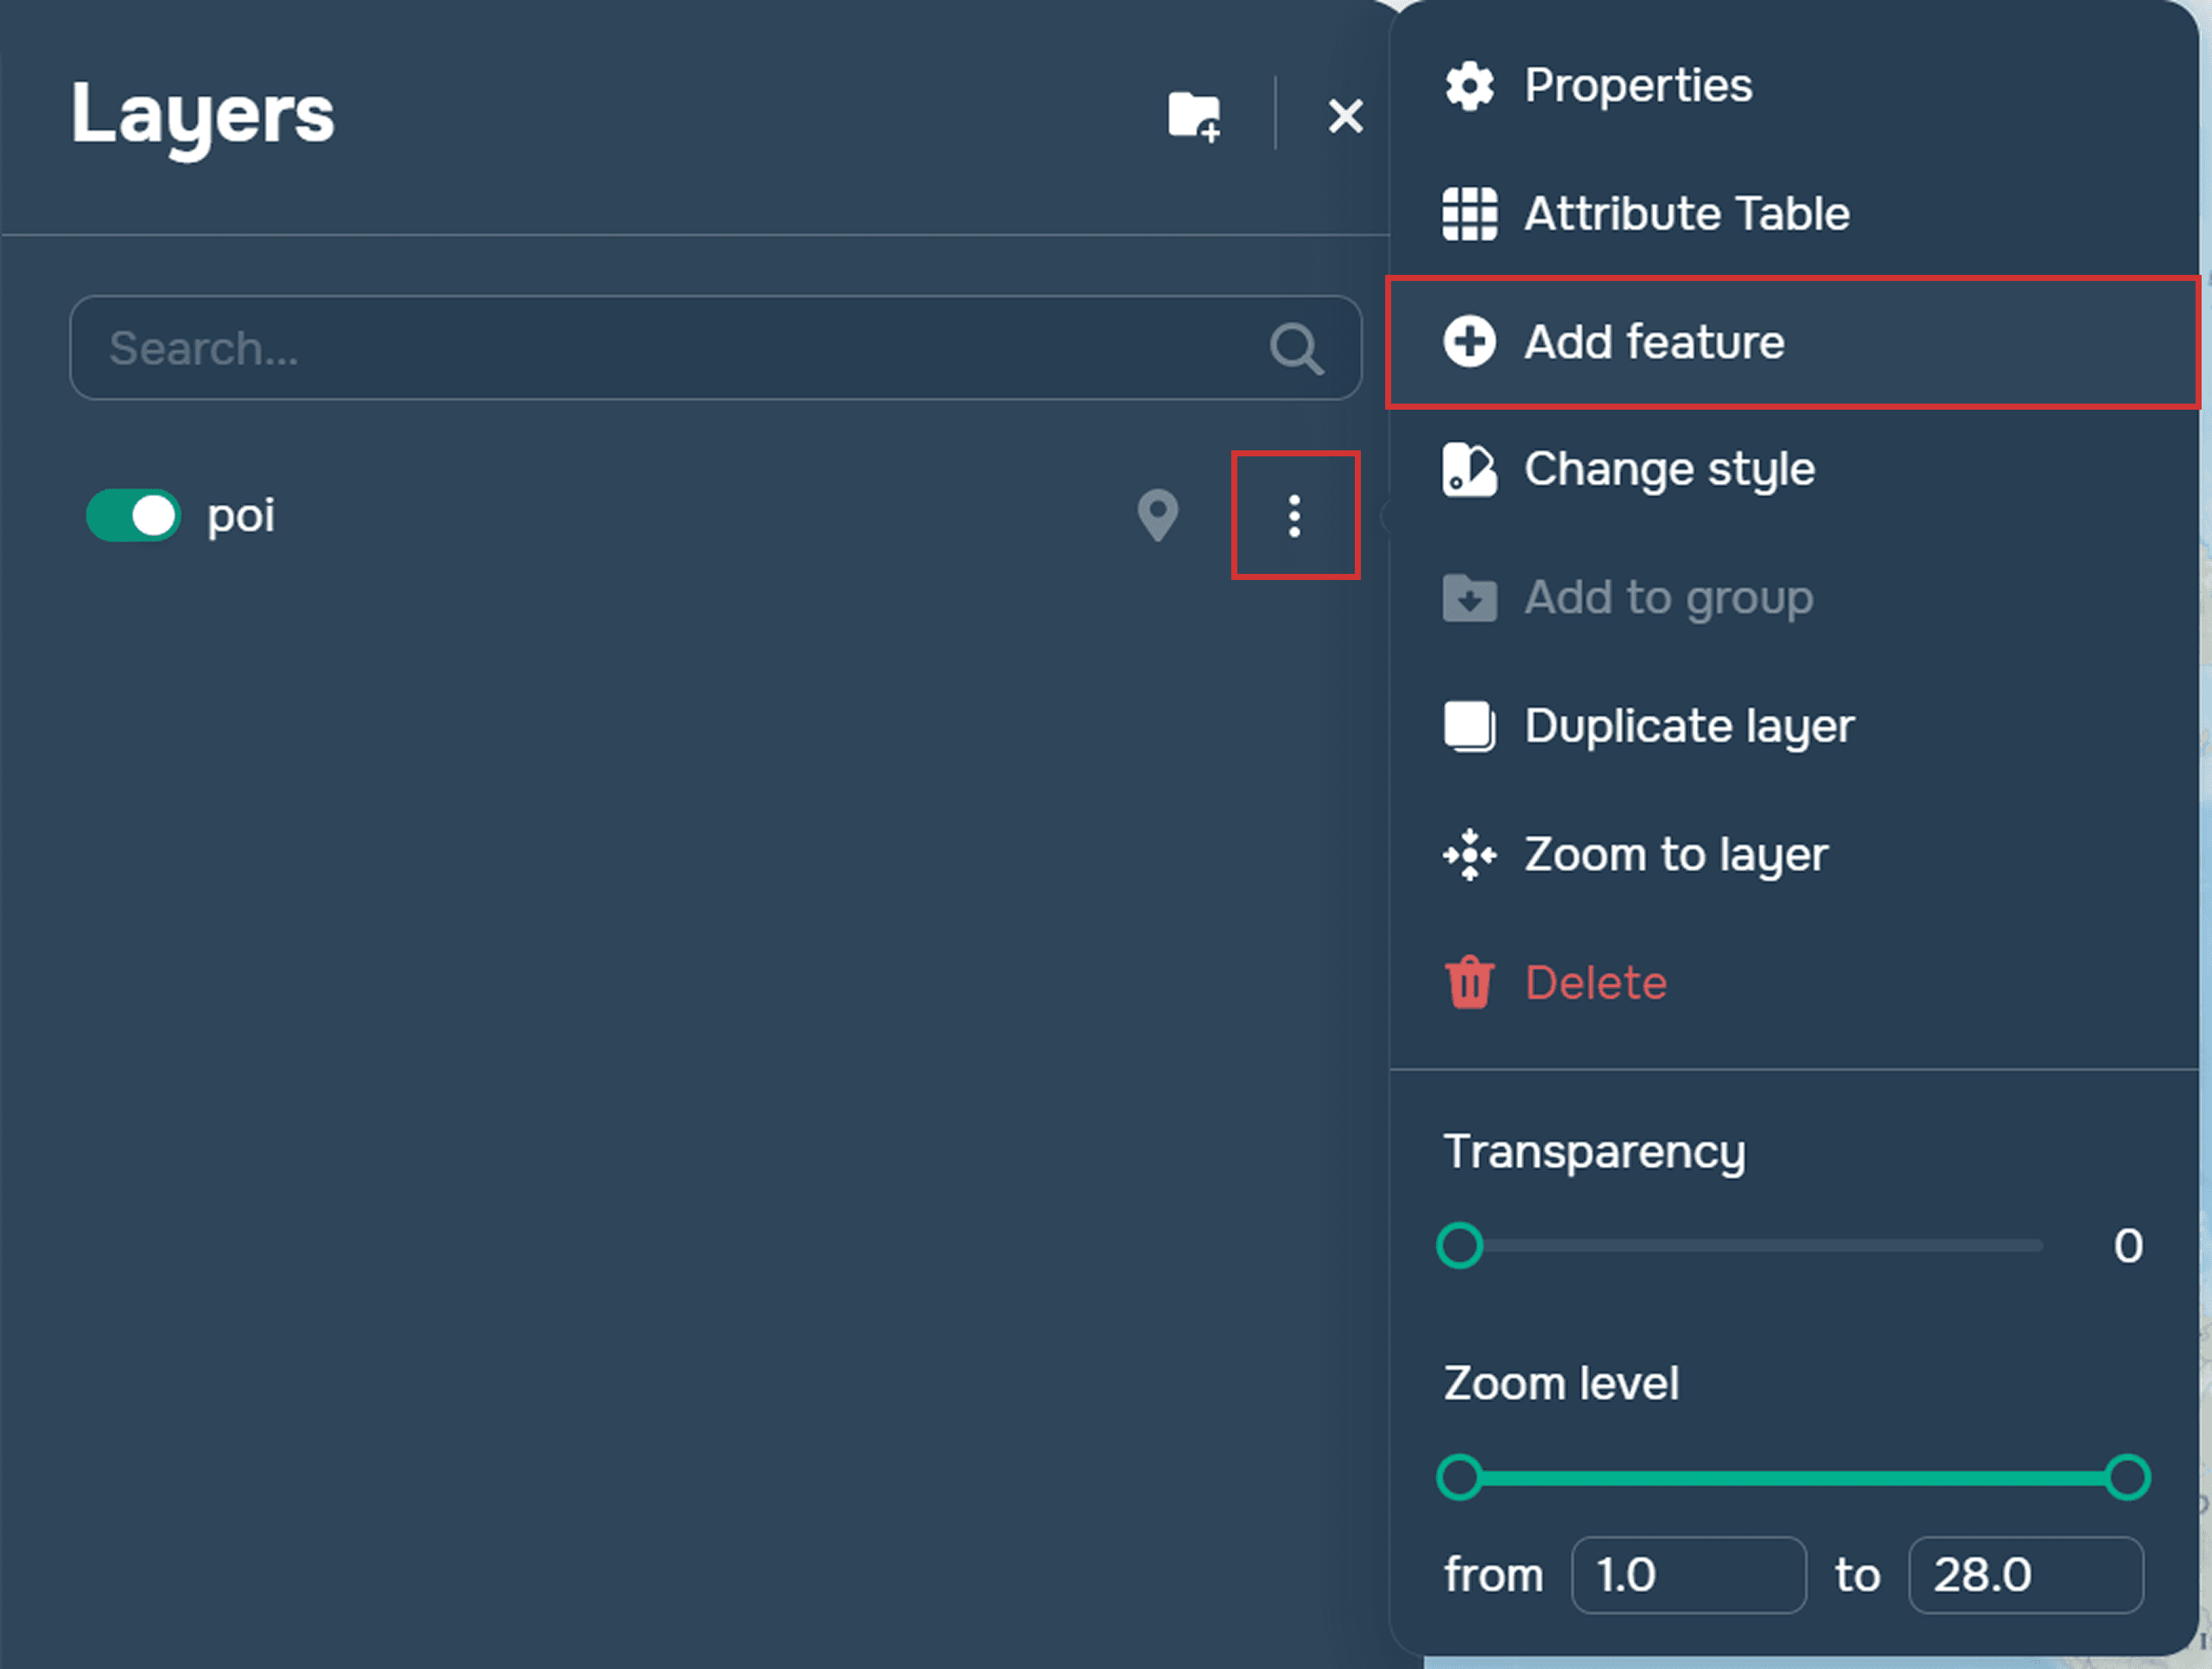
After this, the layer will be successfully created and added to the map. You only need to populate it with objects using the Add features menu.
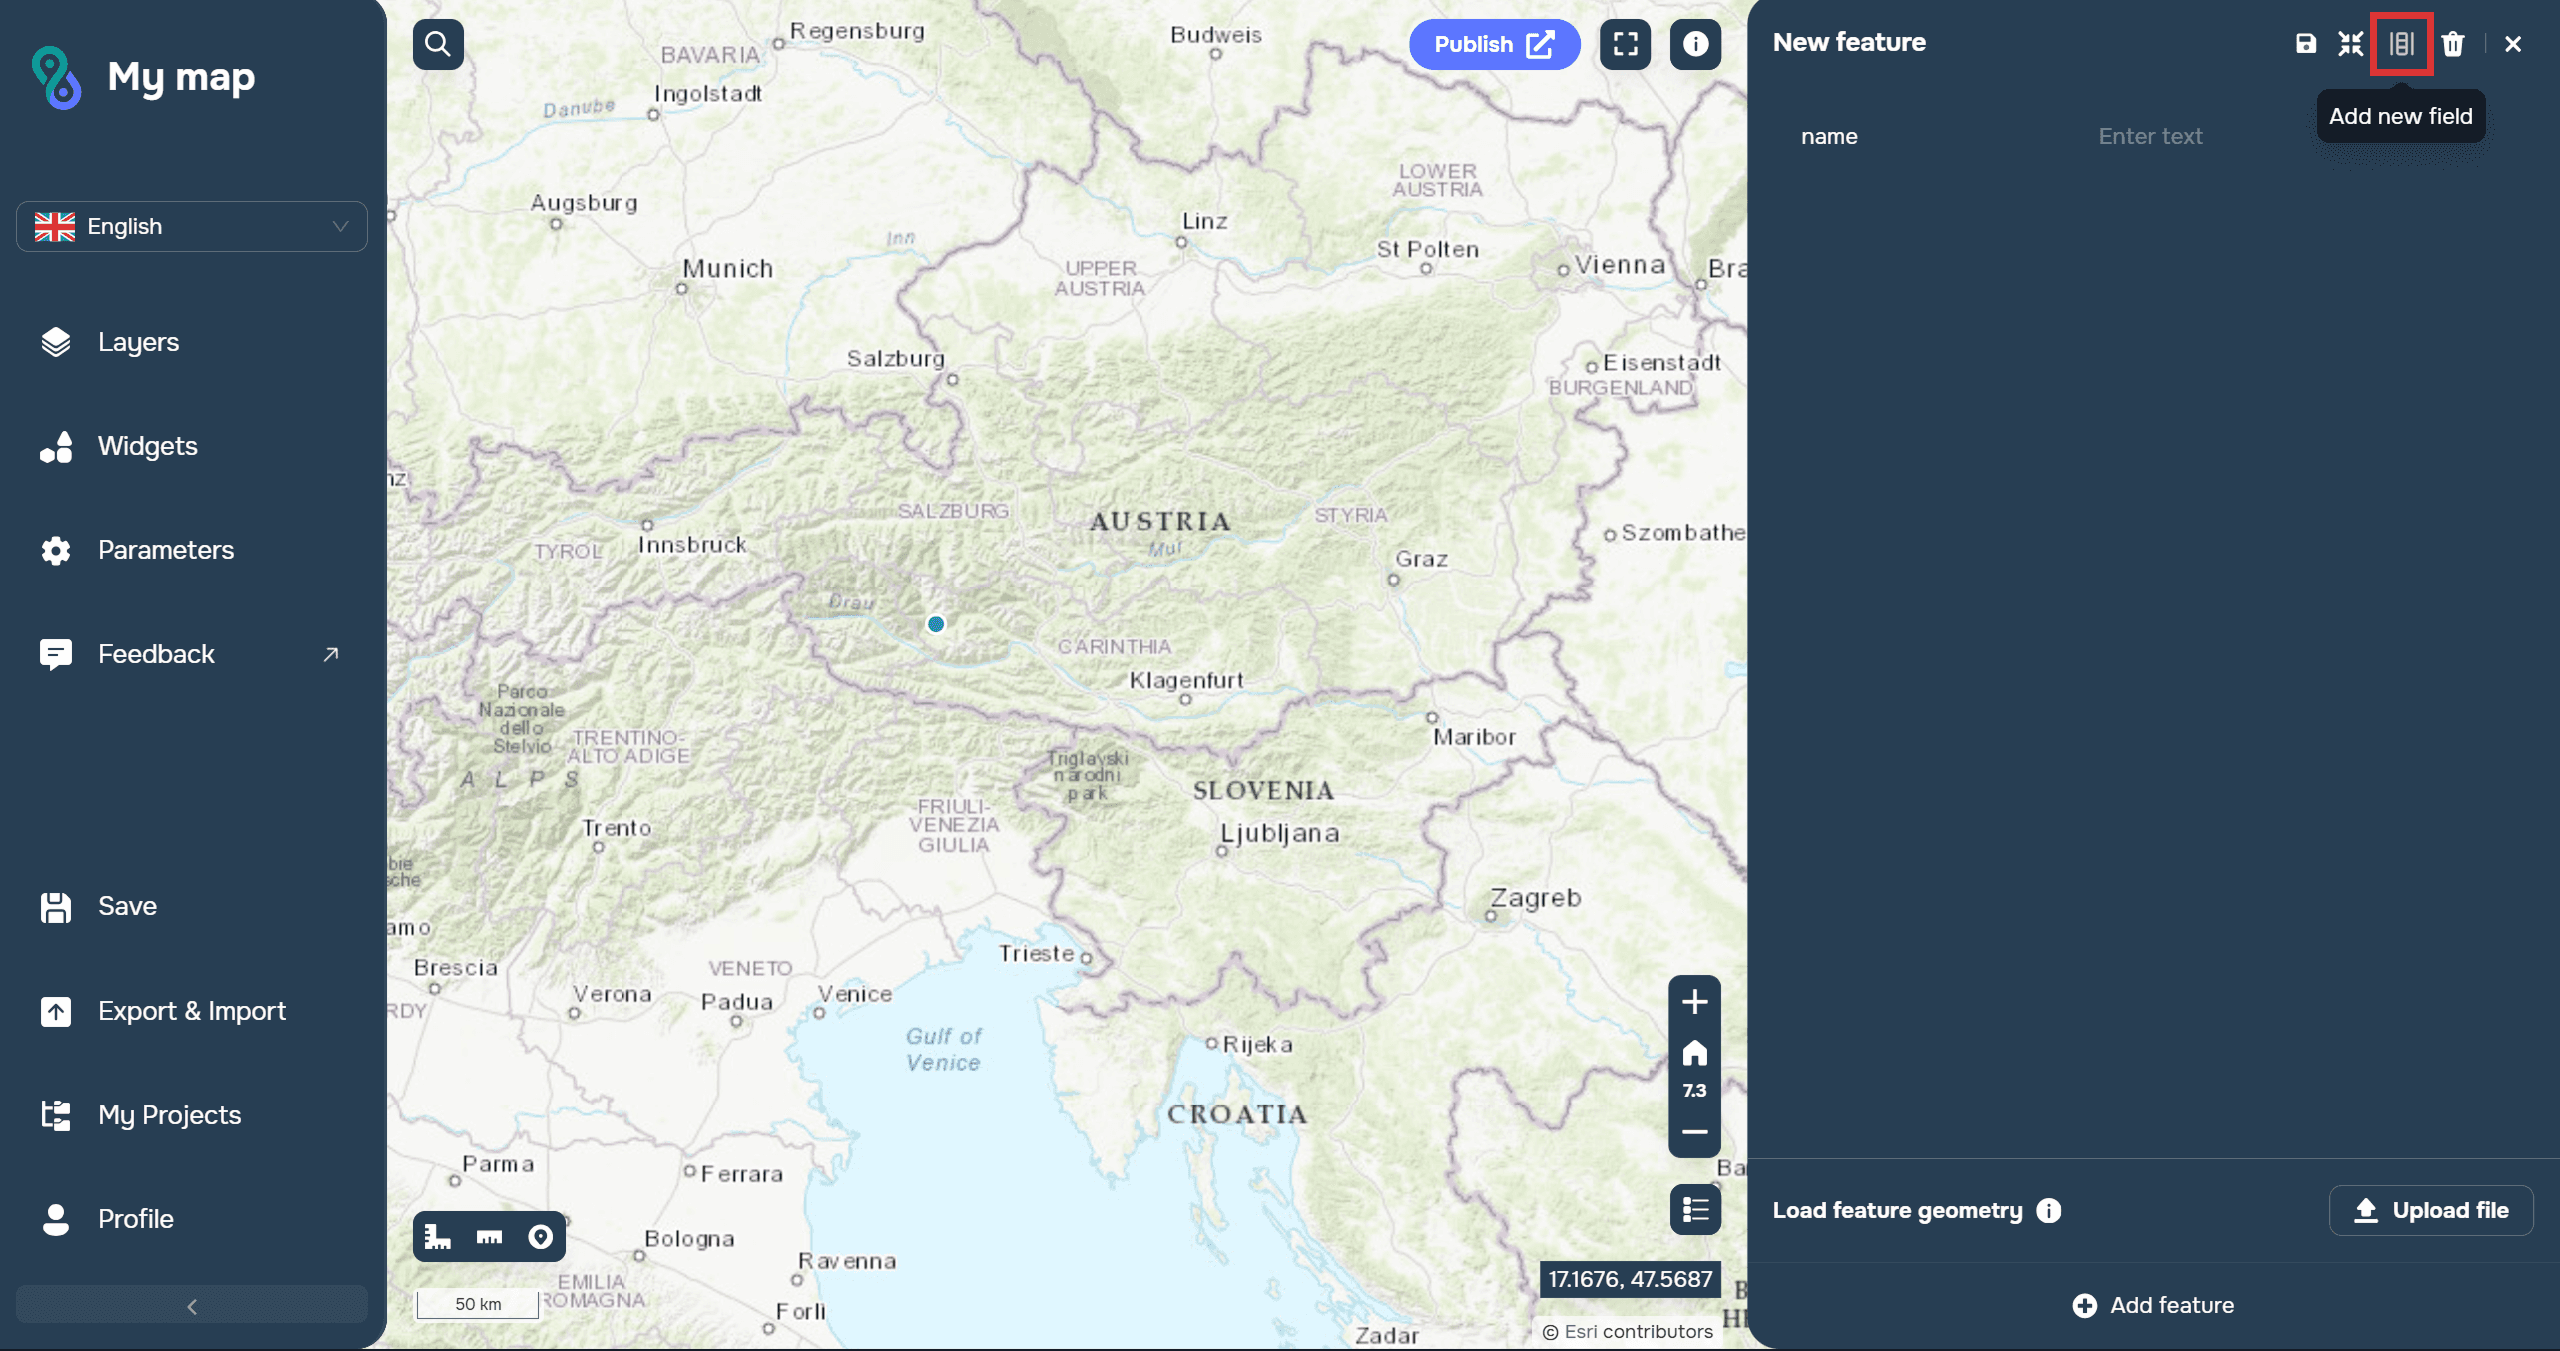
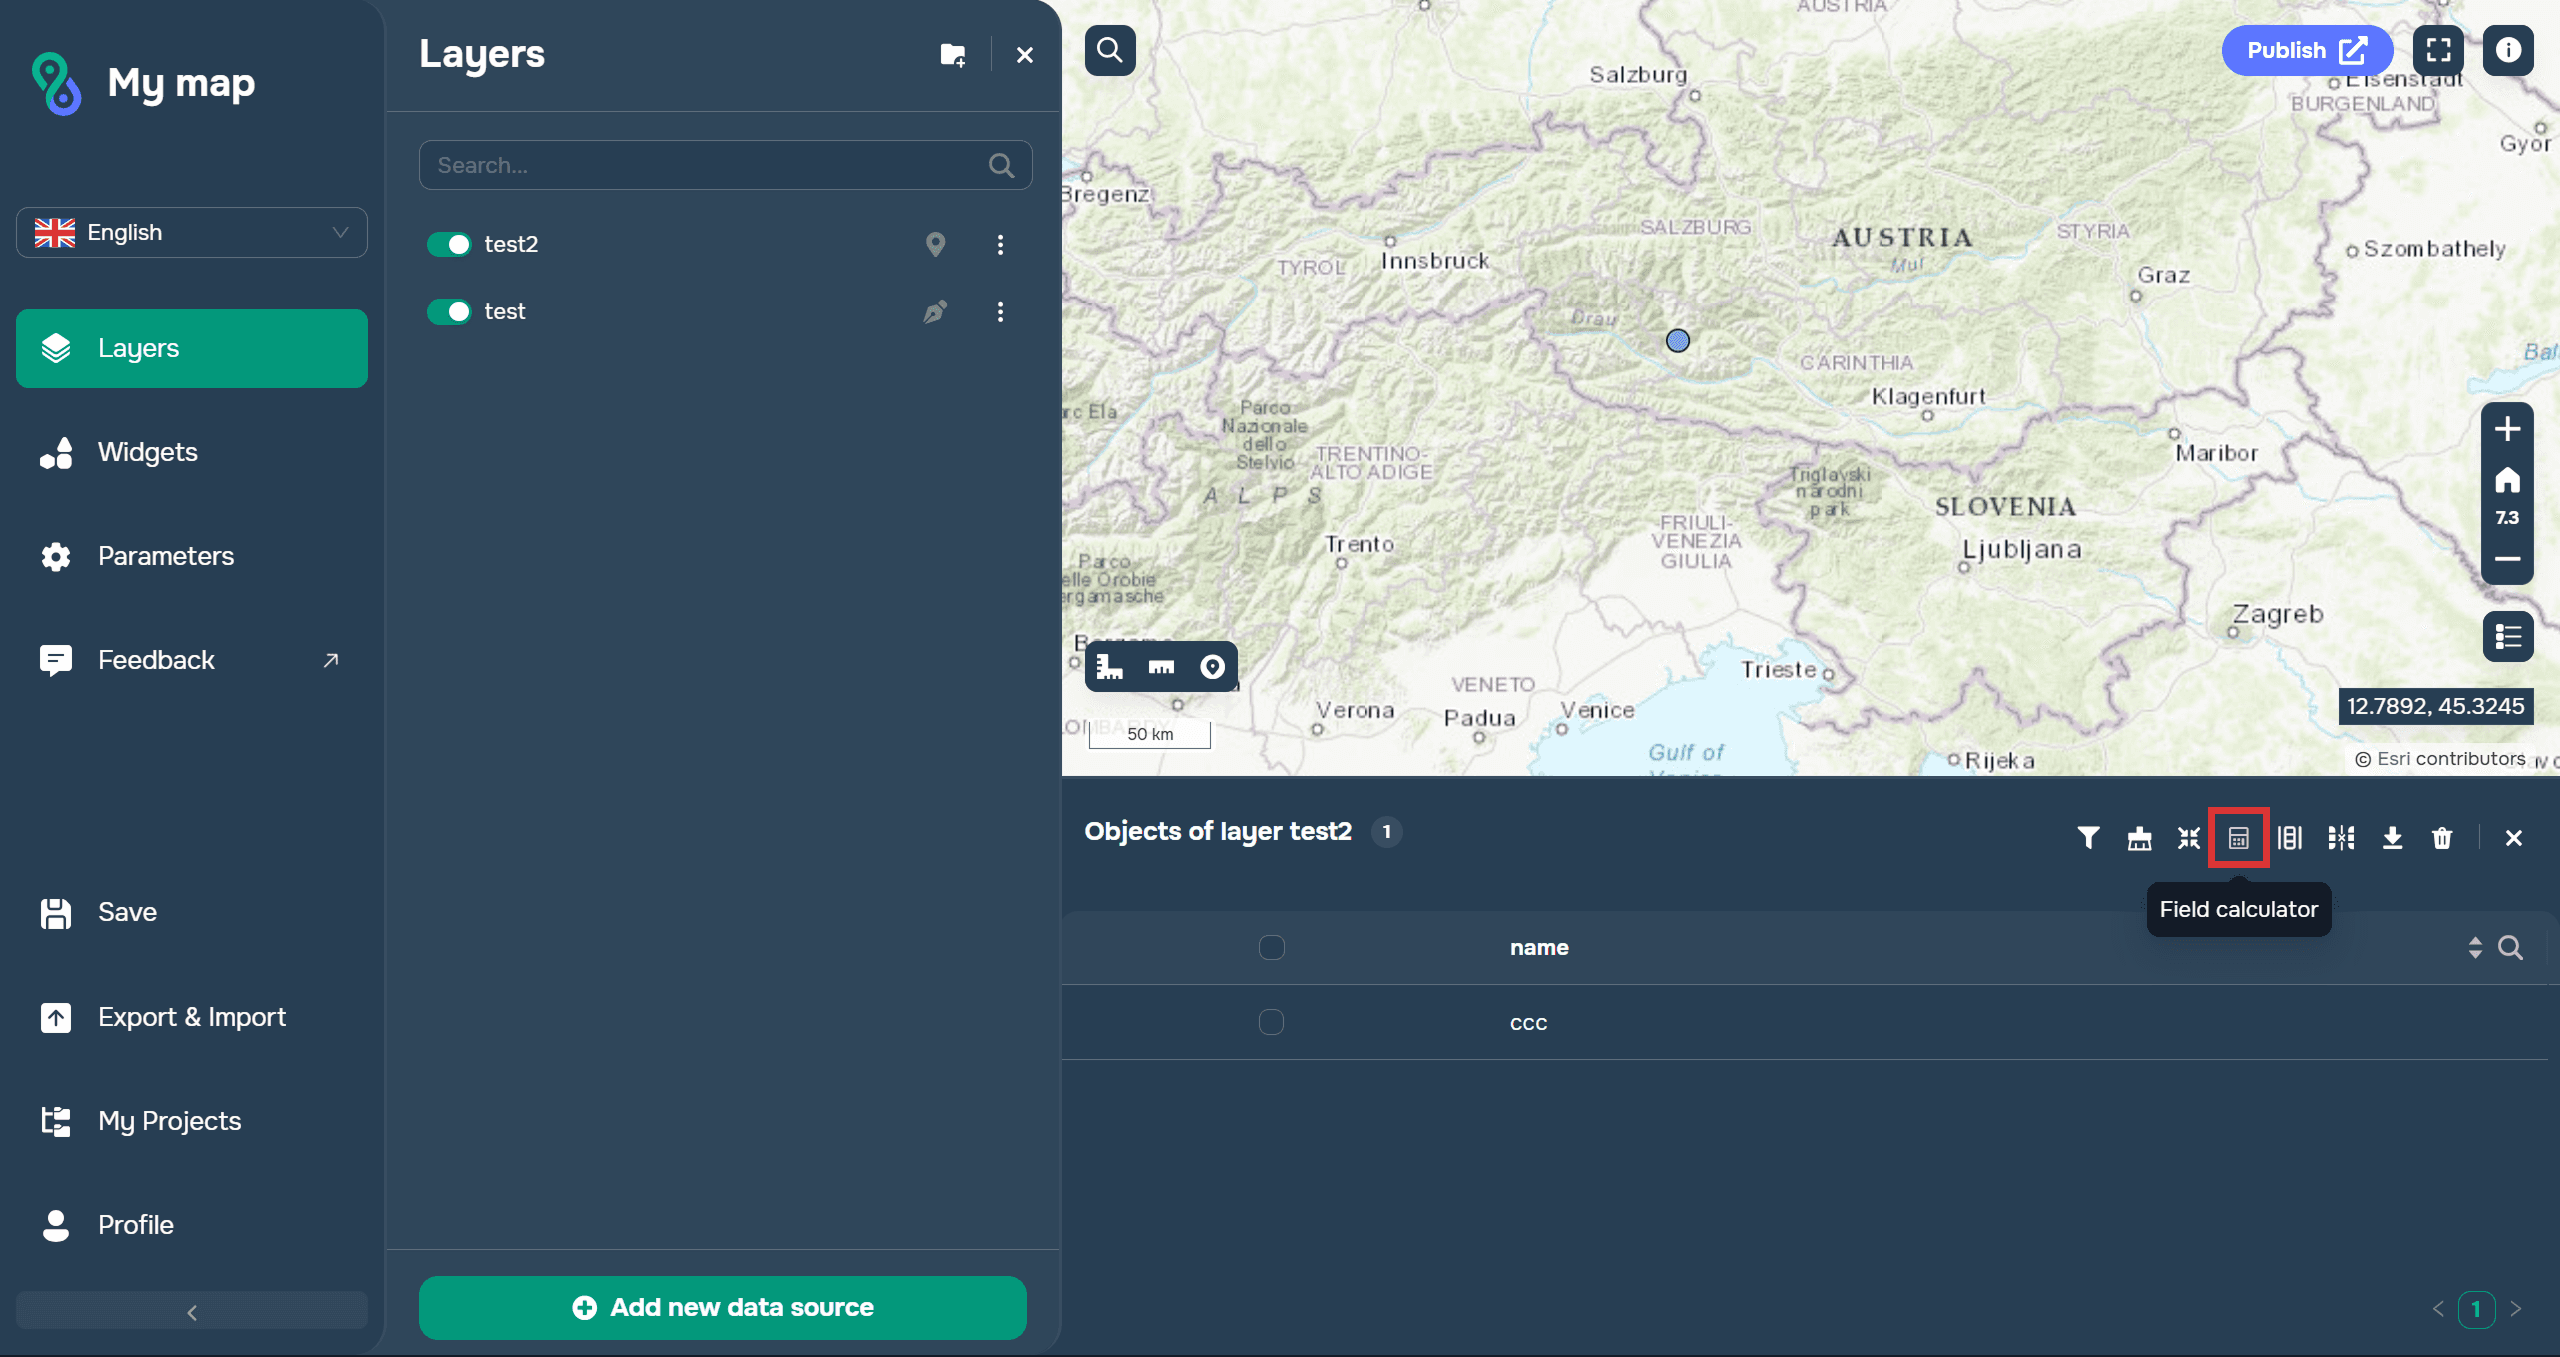
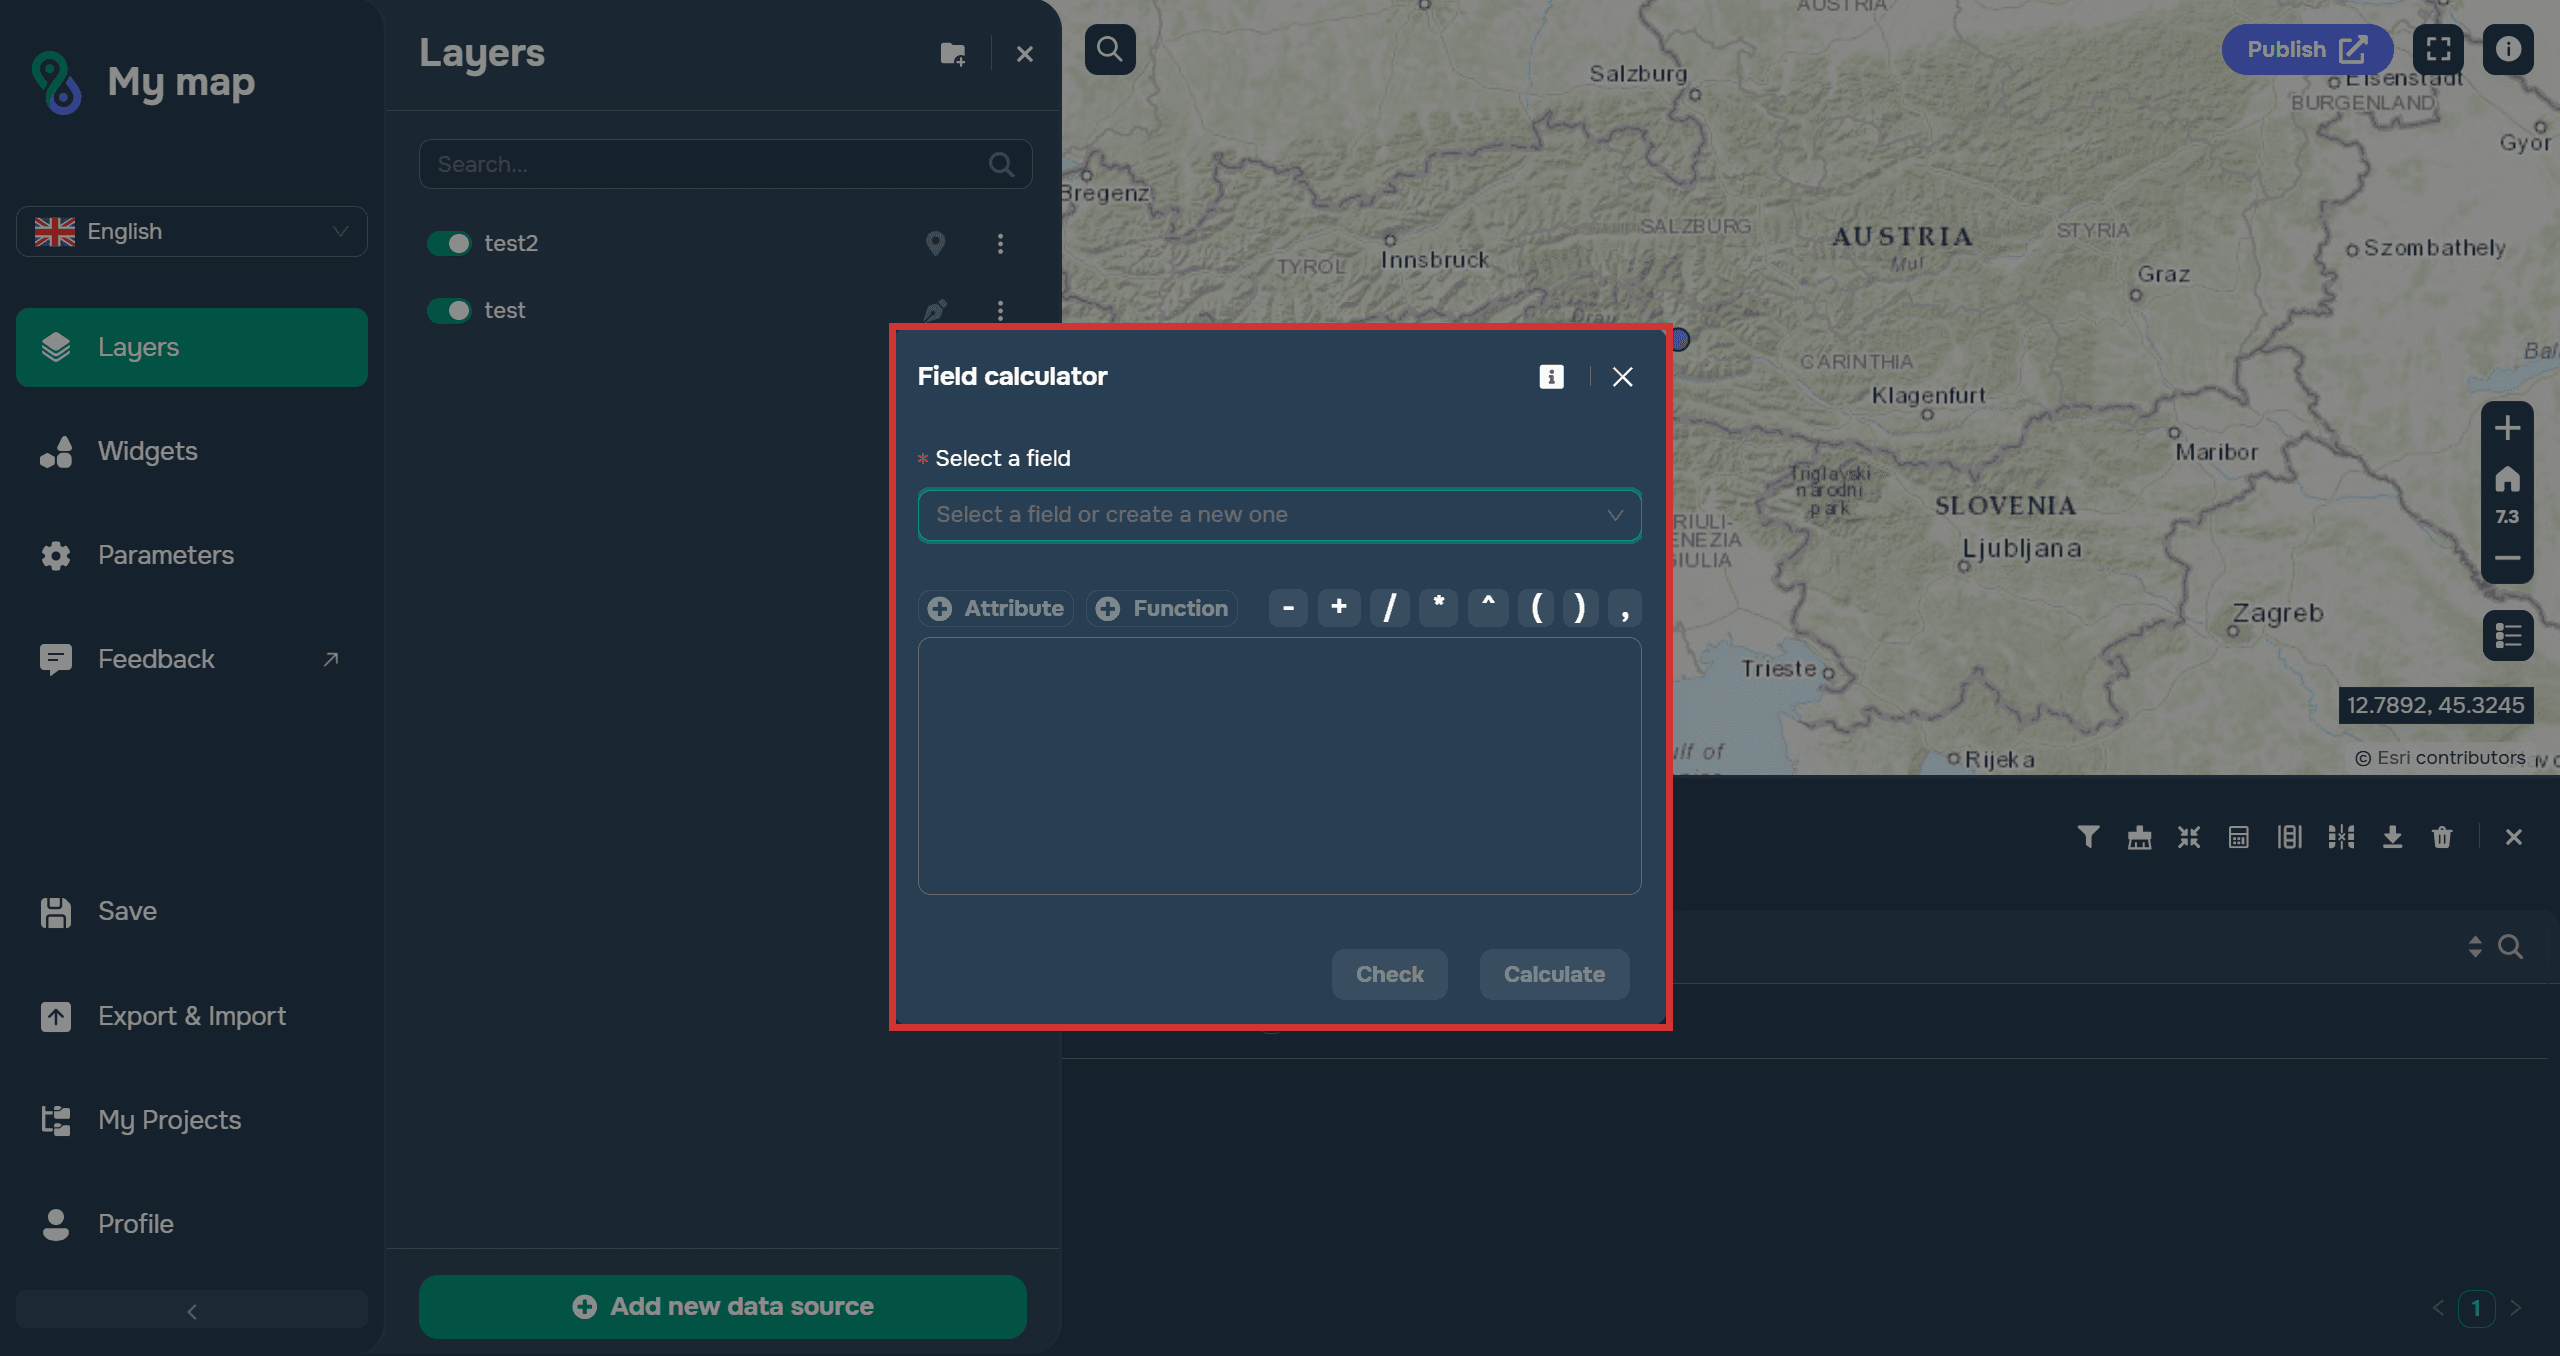
If you forgot to specify an important attribute when creating a layer, you can create it later when editing the layer. You can also calculate attribute values using the field calculator.
You can add another attribute by going into layer editing.
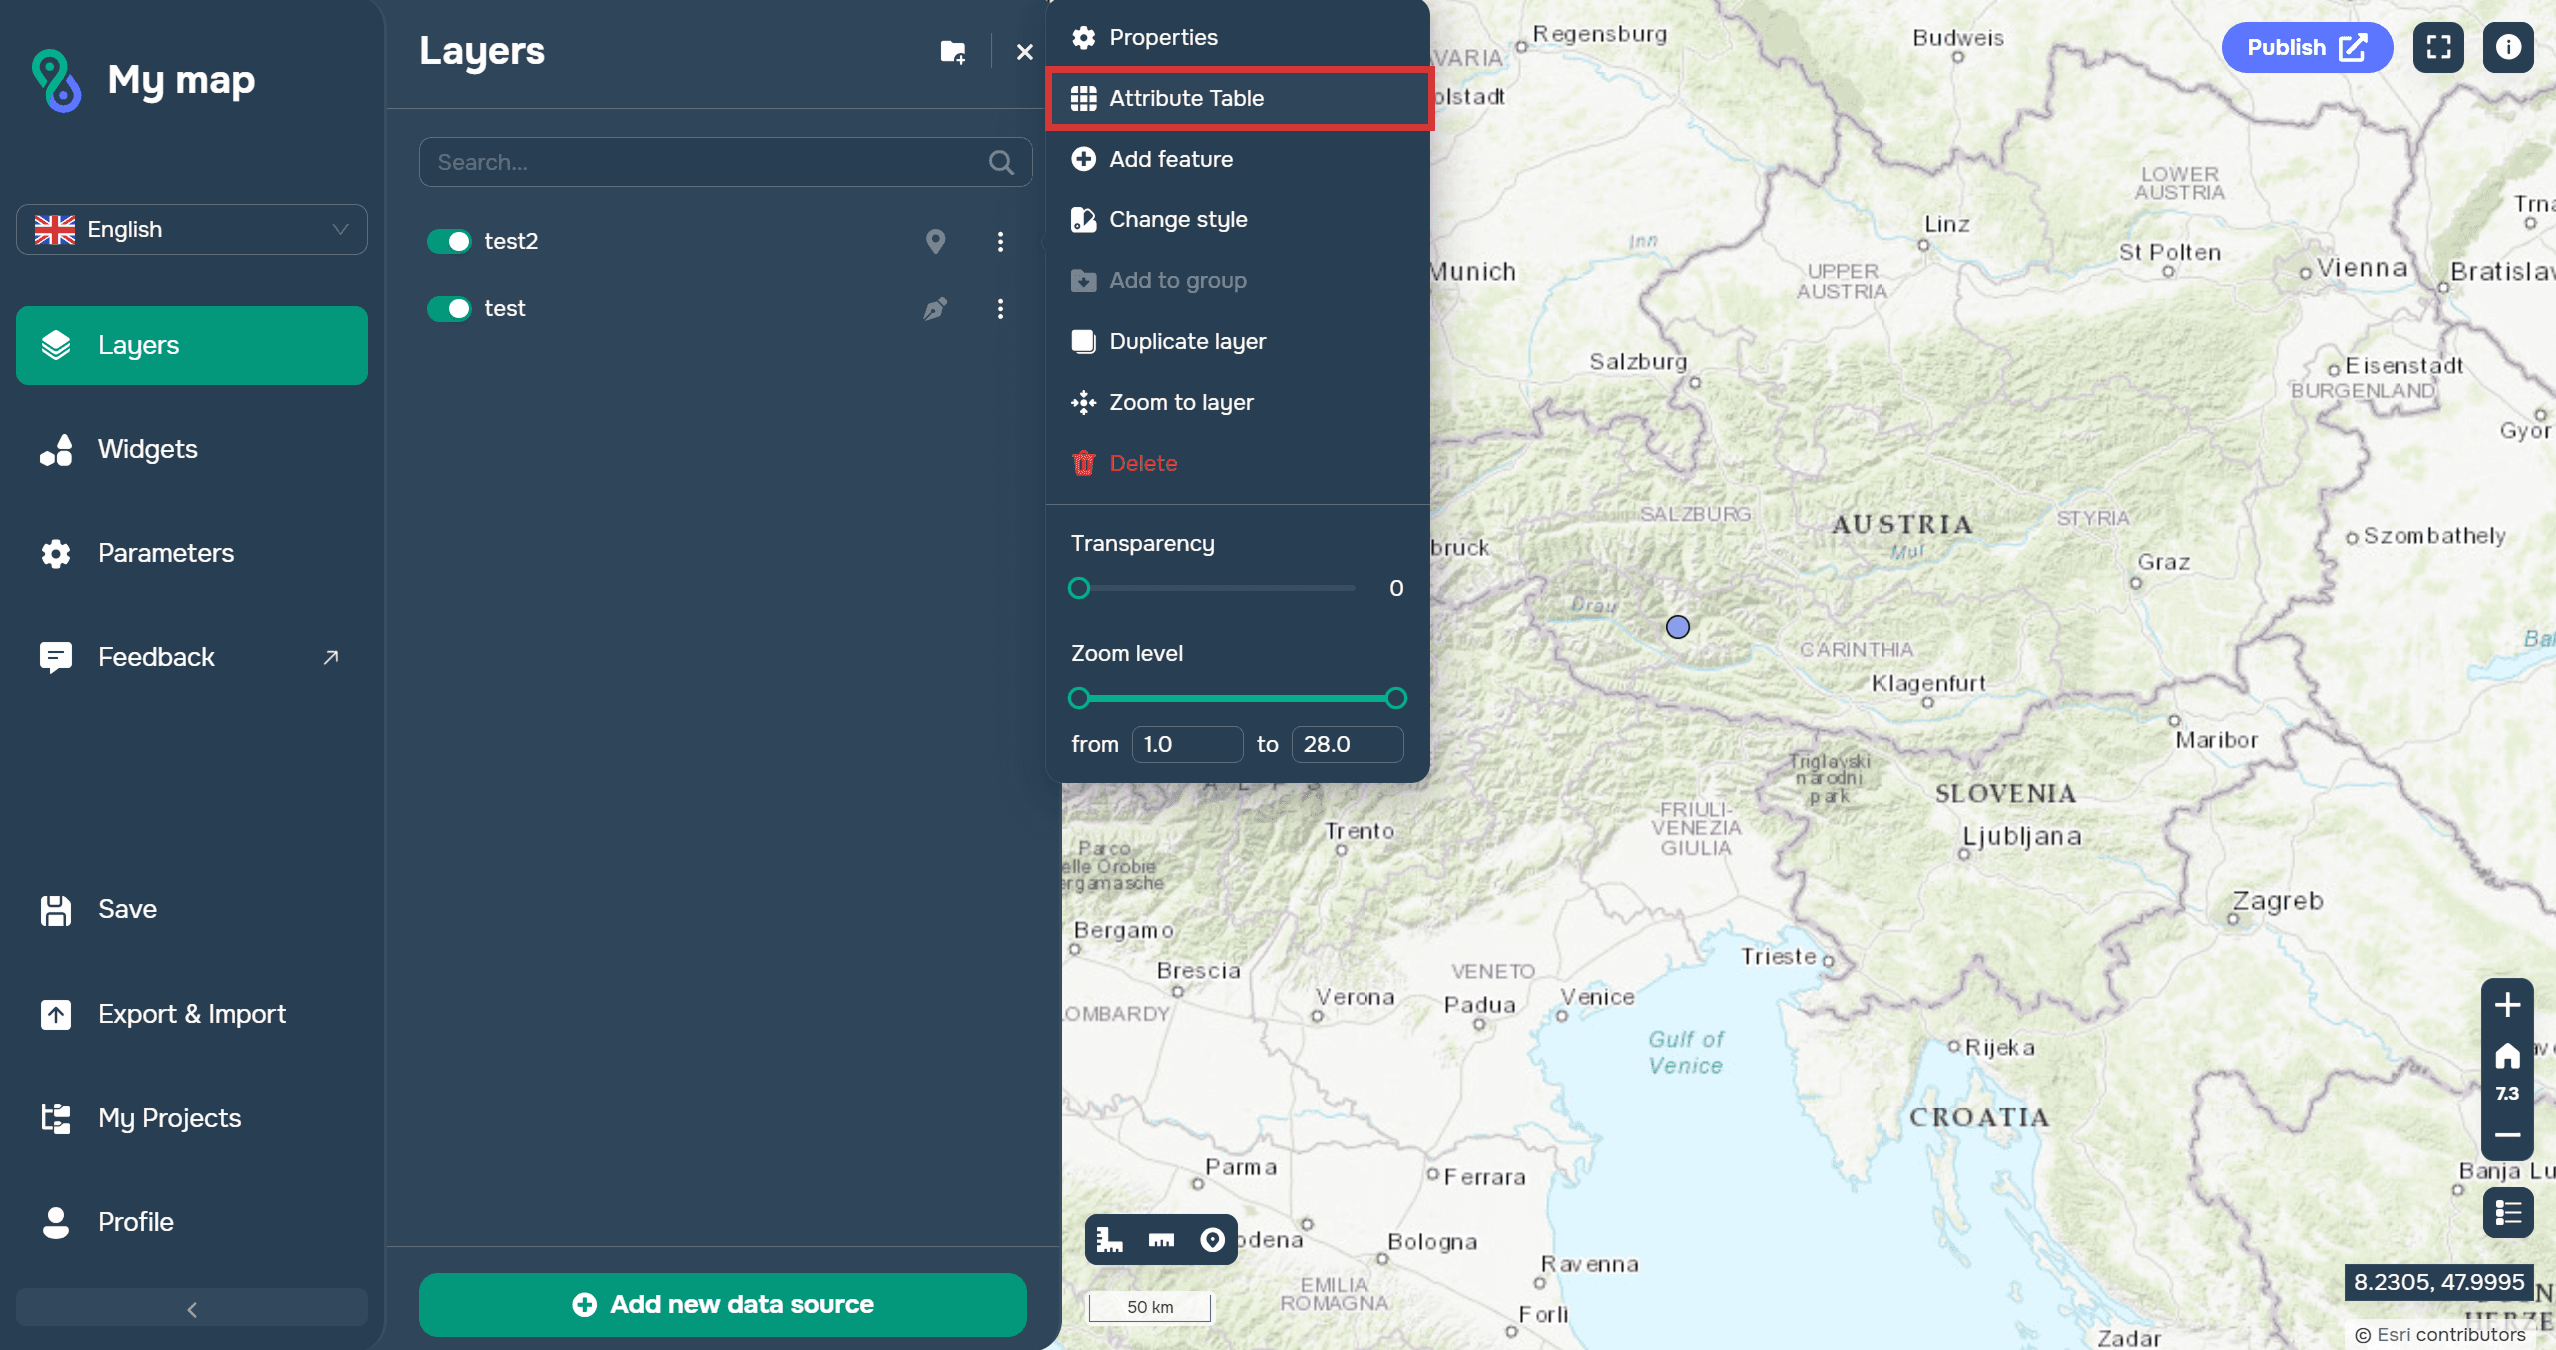
Attributes can be calculated using the attribute table.
It's also worth noting that a graphic layer doesn't have a coordinate reference; it consists of drawn vector shapes or text. Because of this, its creation is slightly different from other layers.
Differences:
it can't be tagged
it has no attribute information or attributes at all
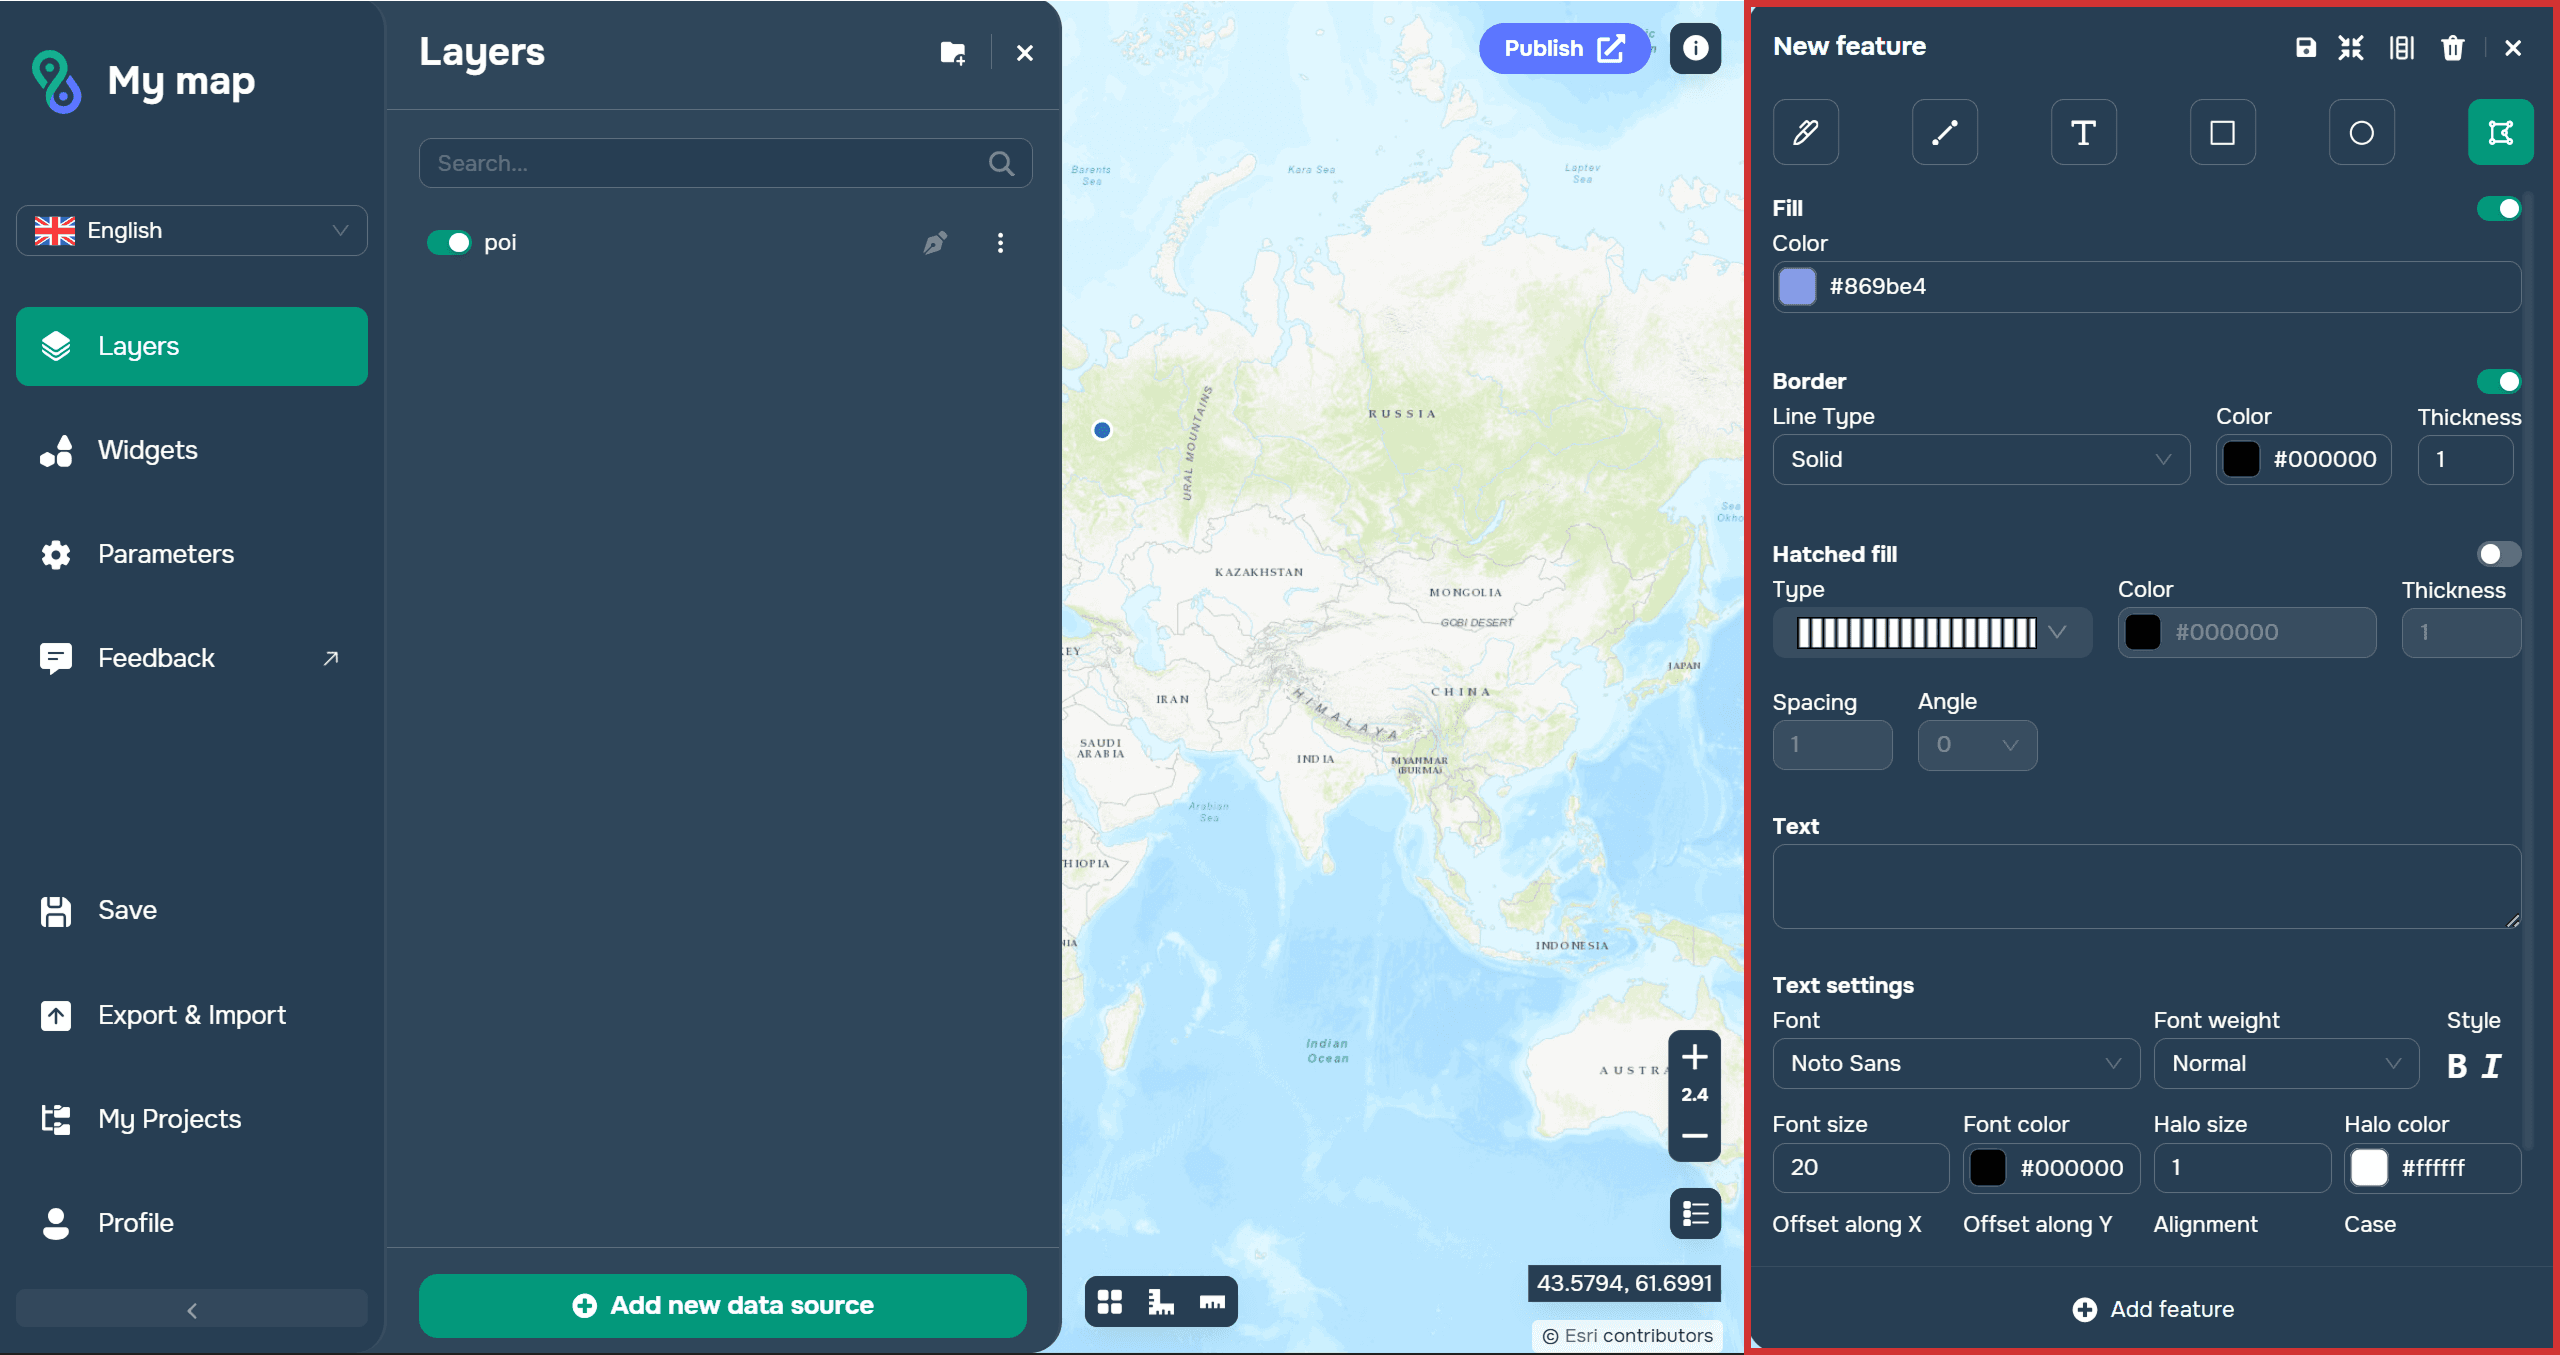
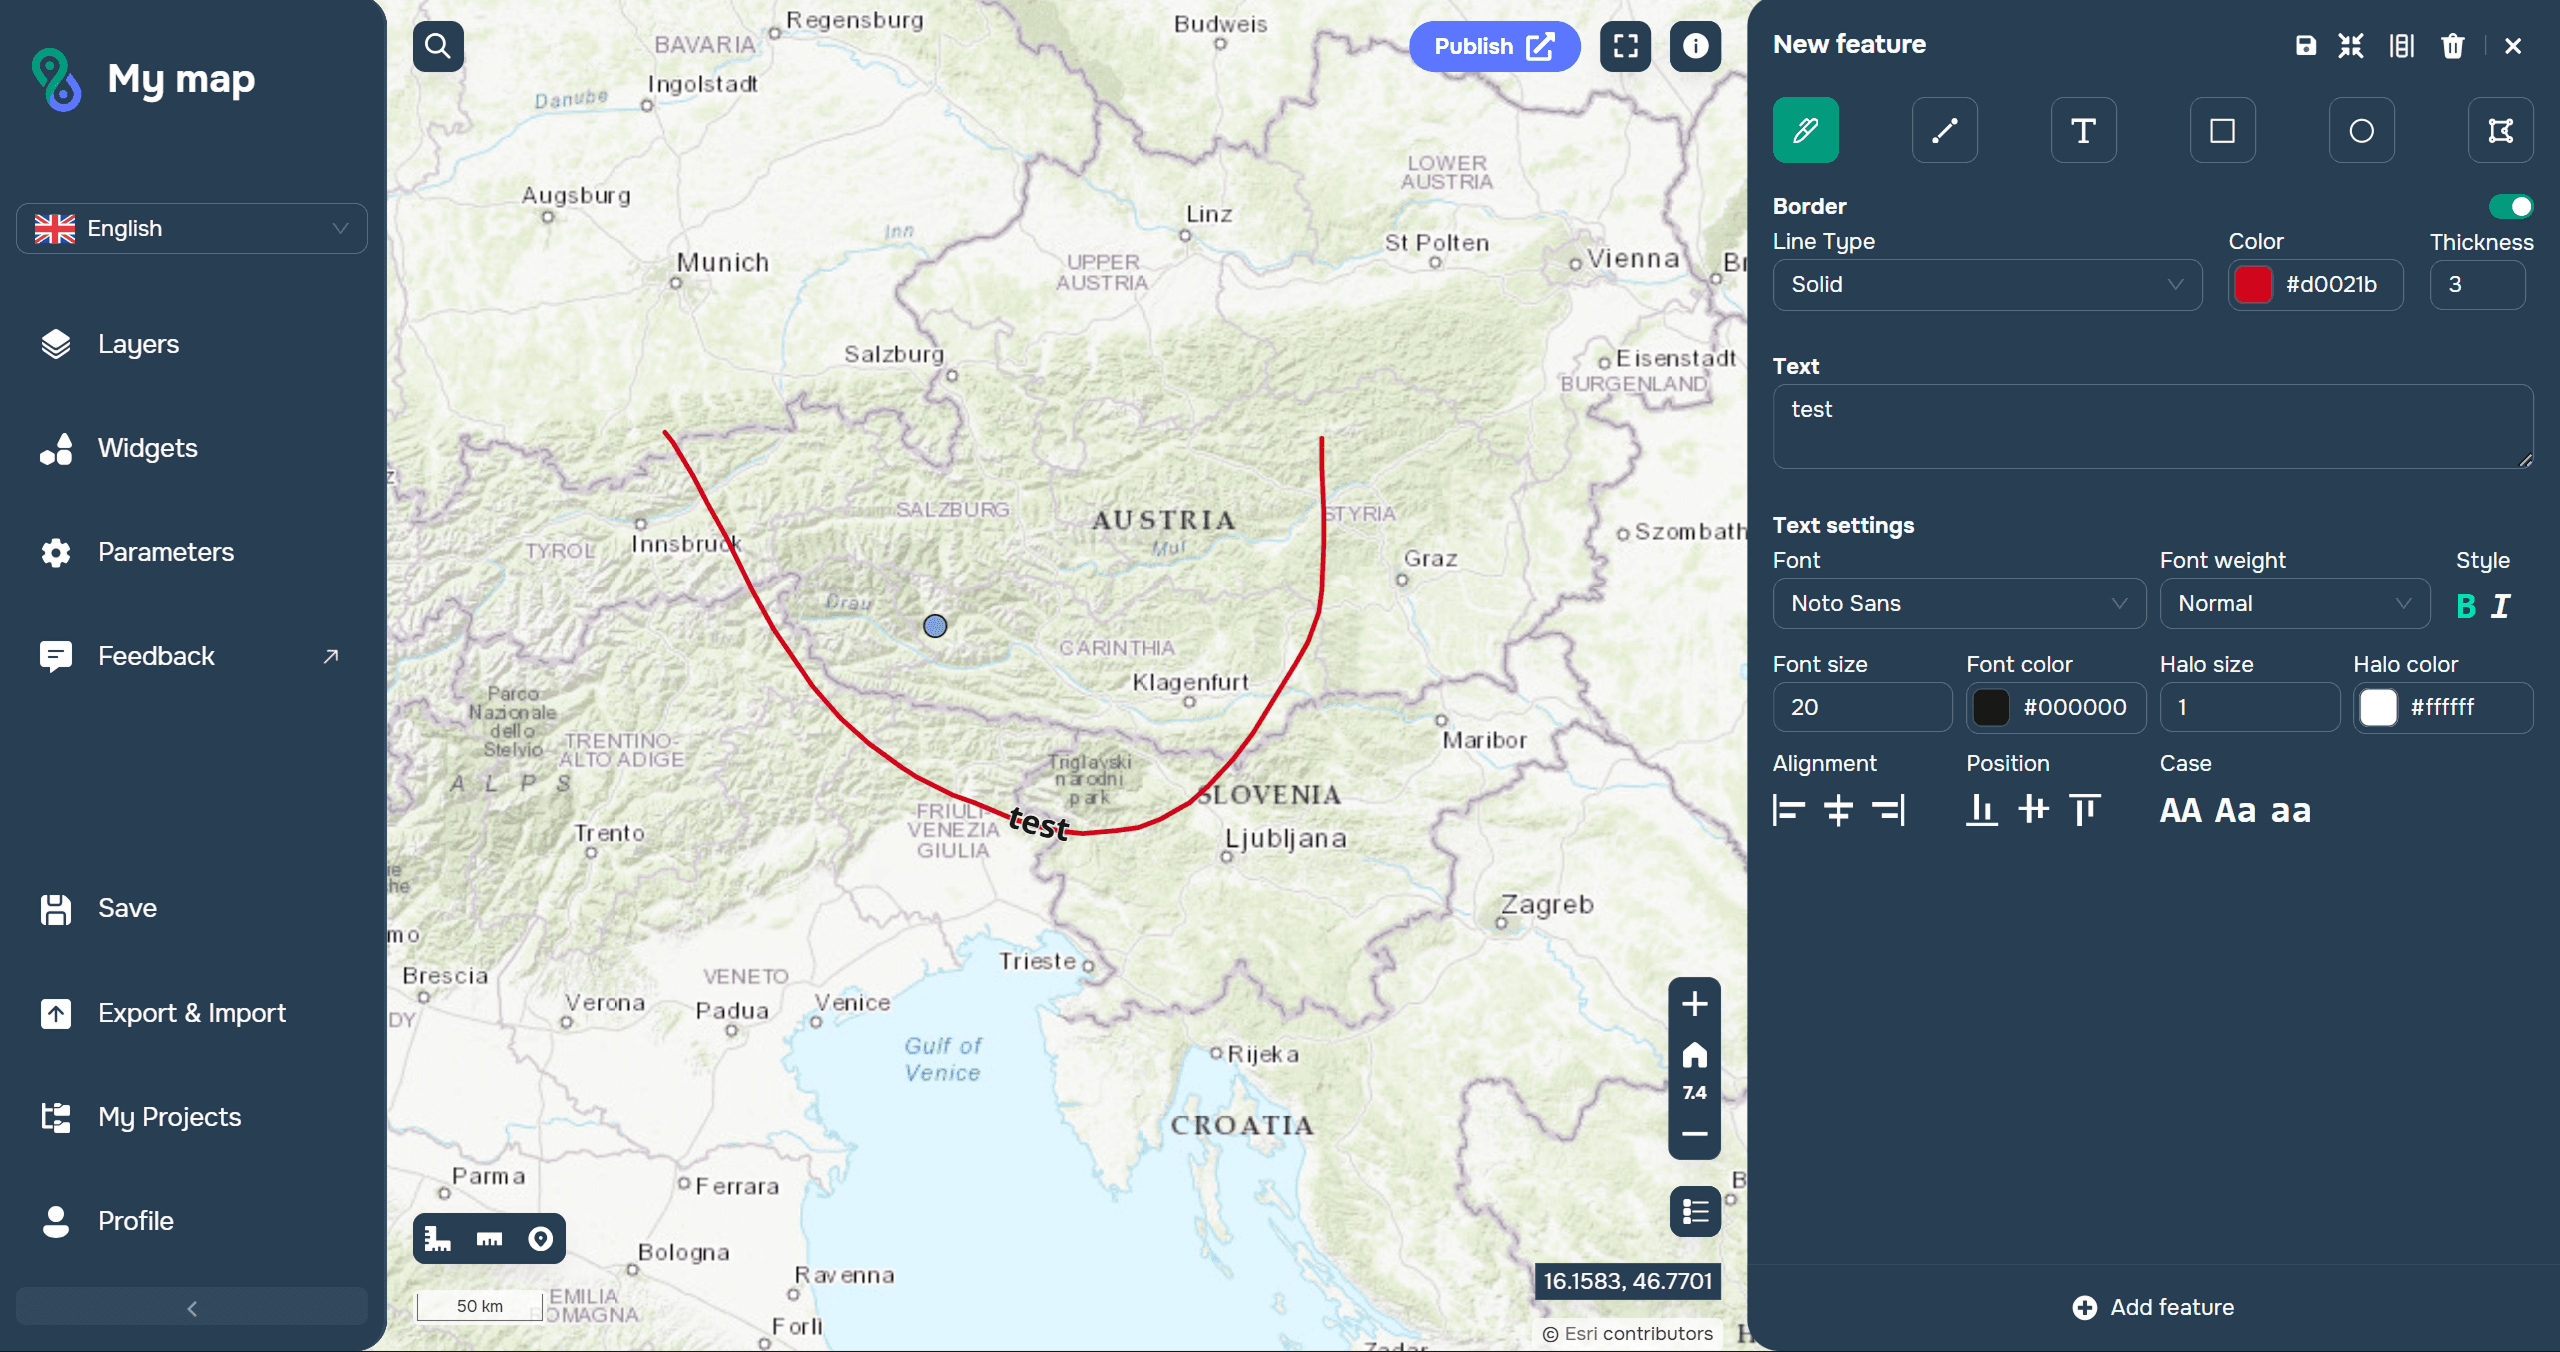
The following types of objects can be created in a graphic layer:
custom object (you can customize its color, thickness, and labels)
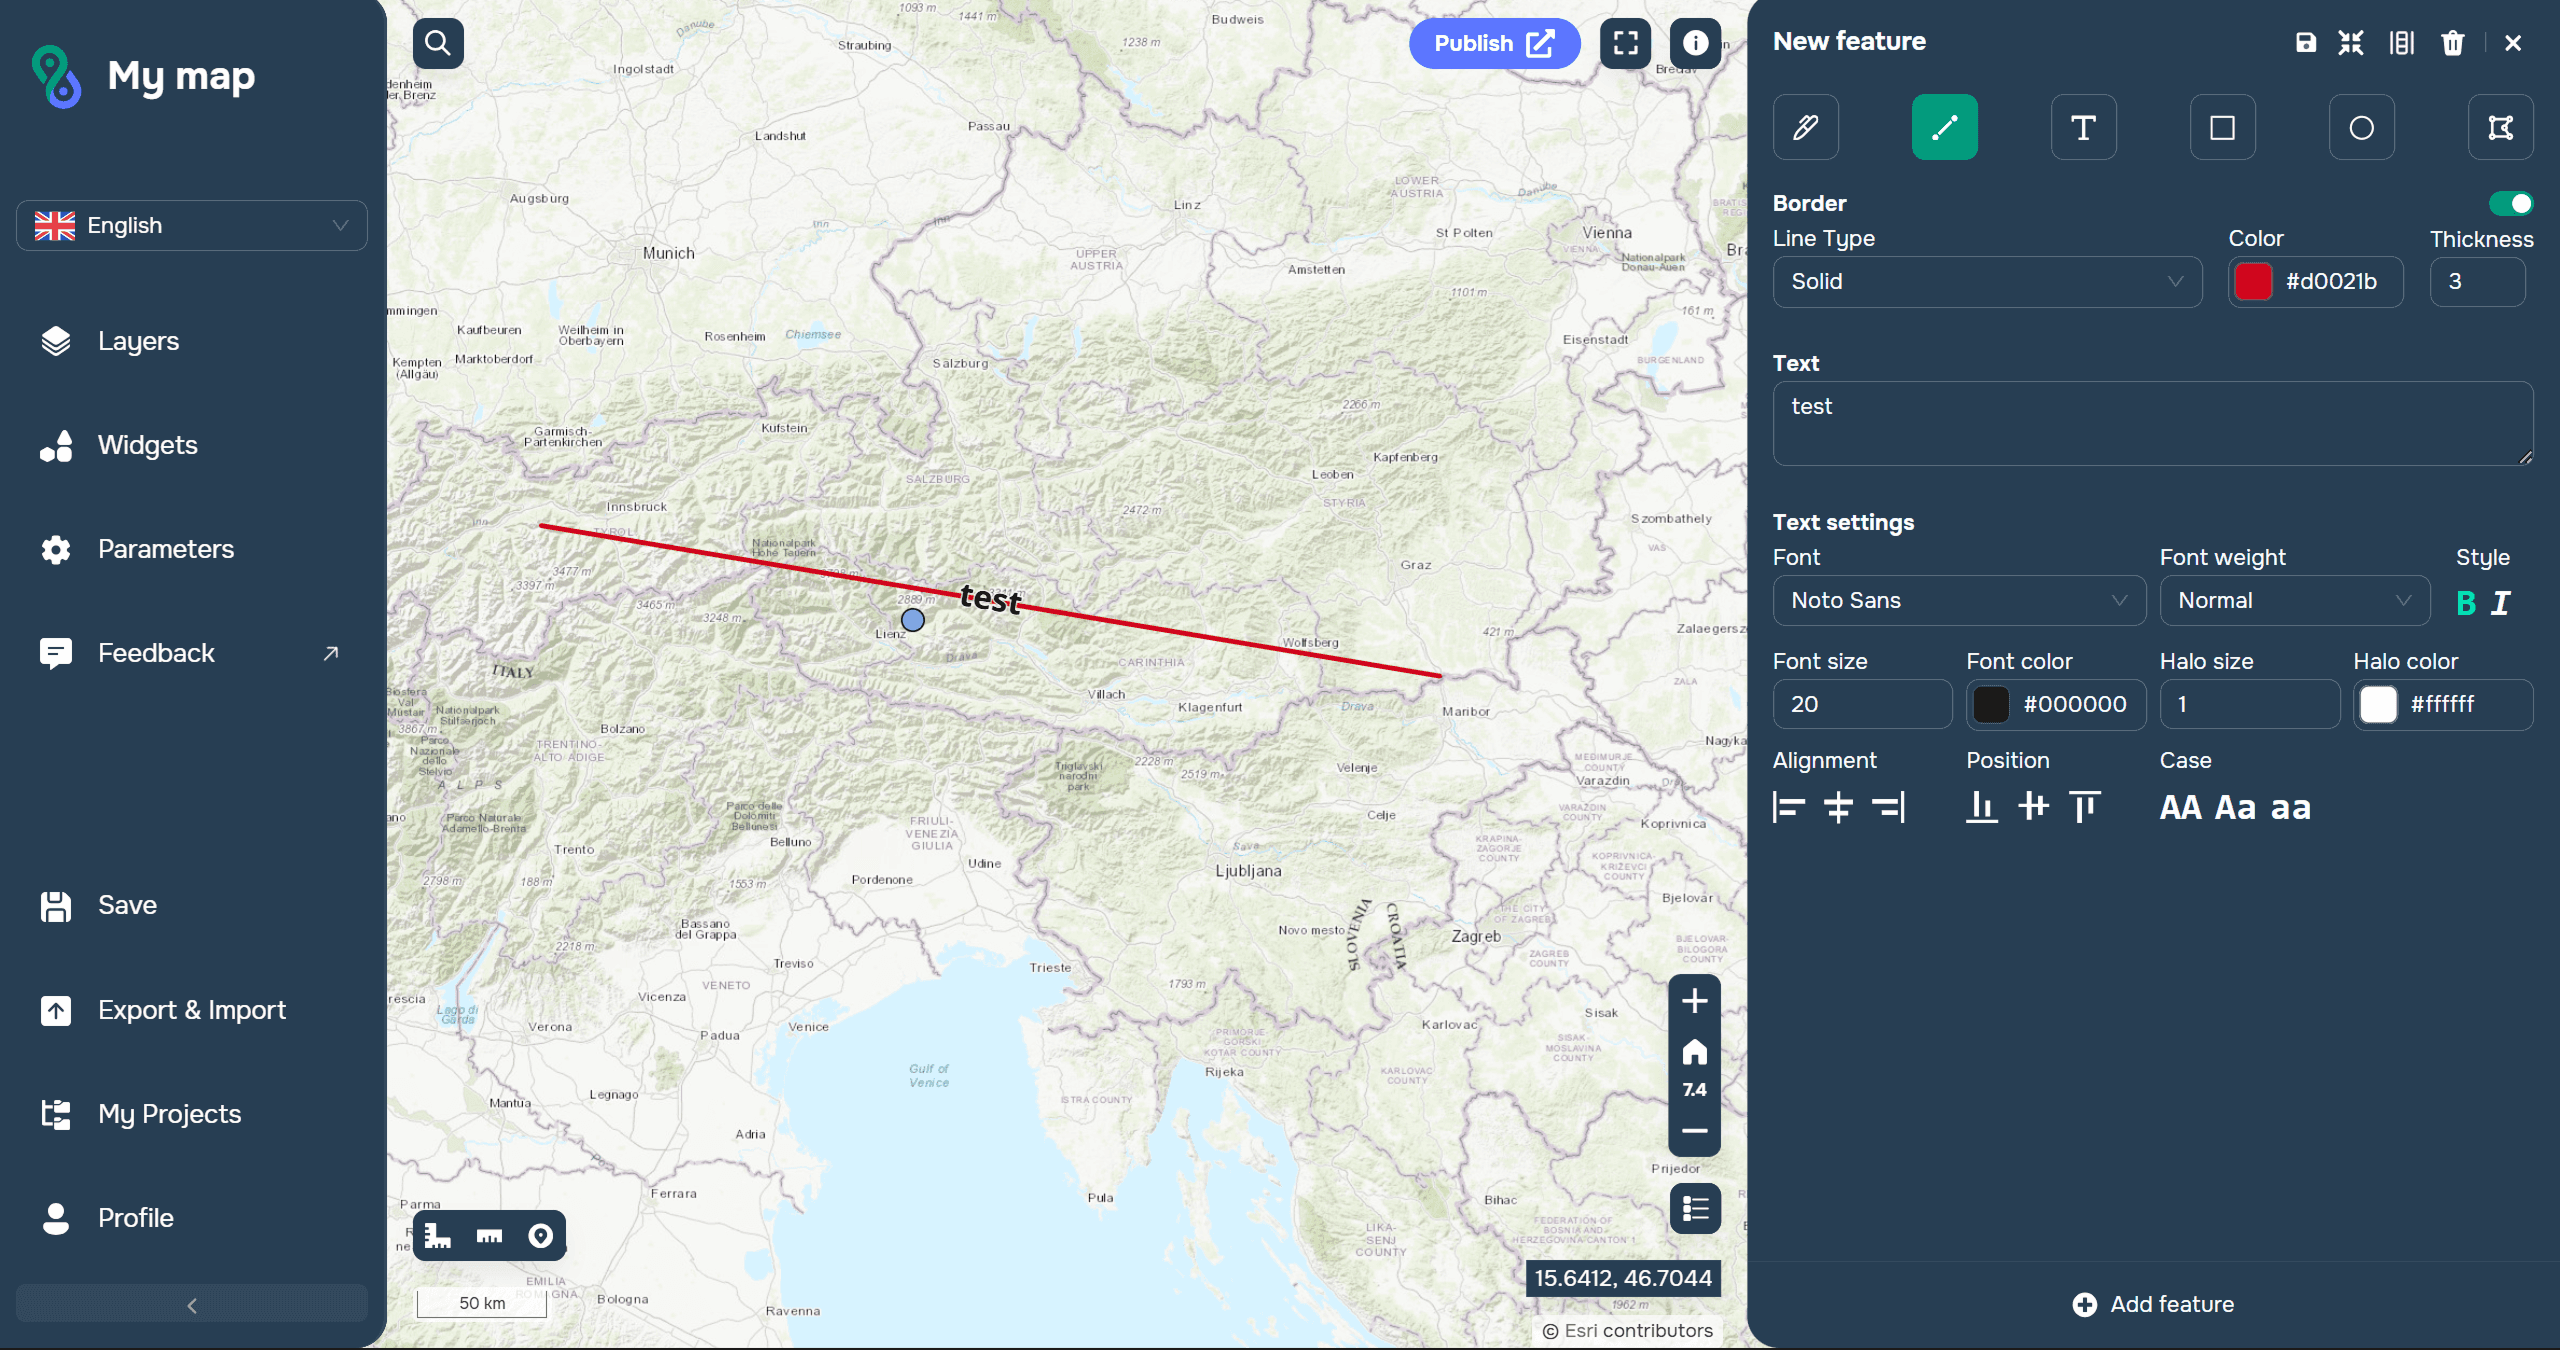
line (you can customize its color, thickness, and labels)
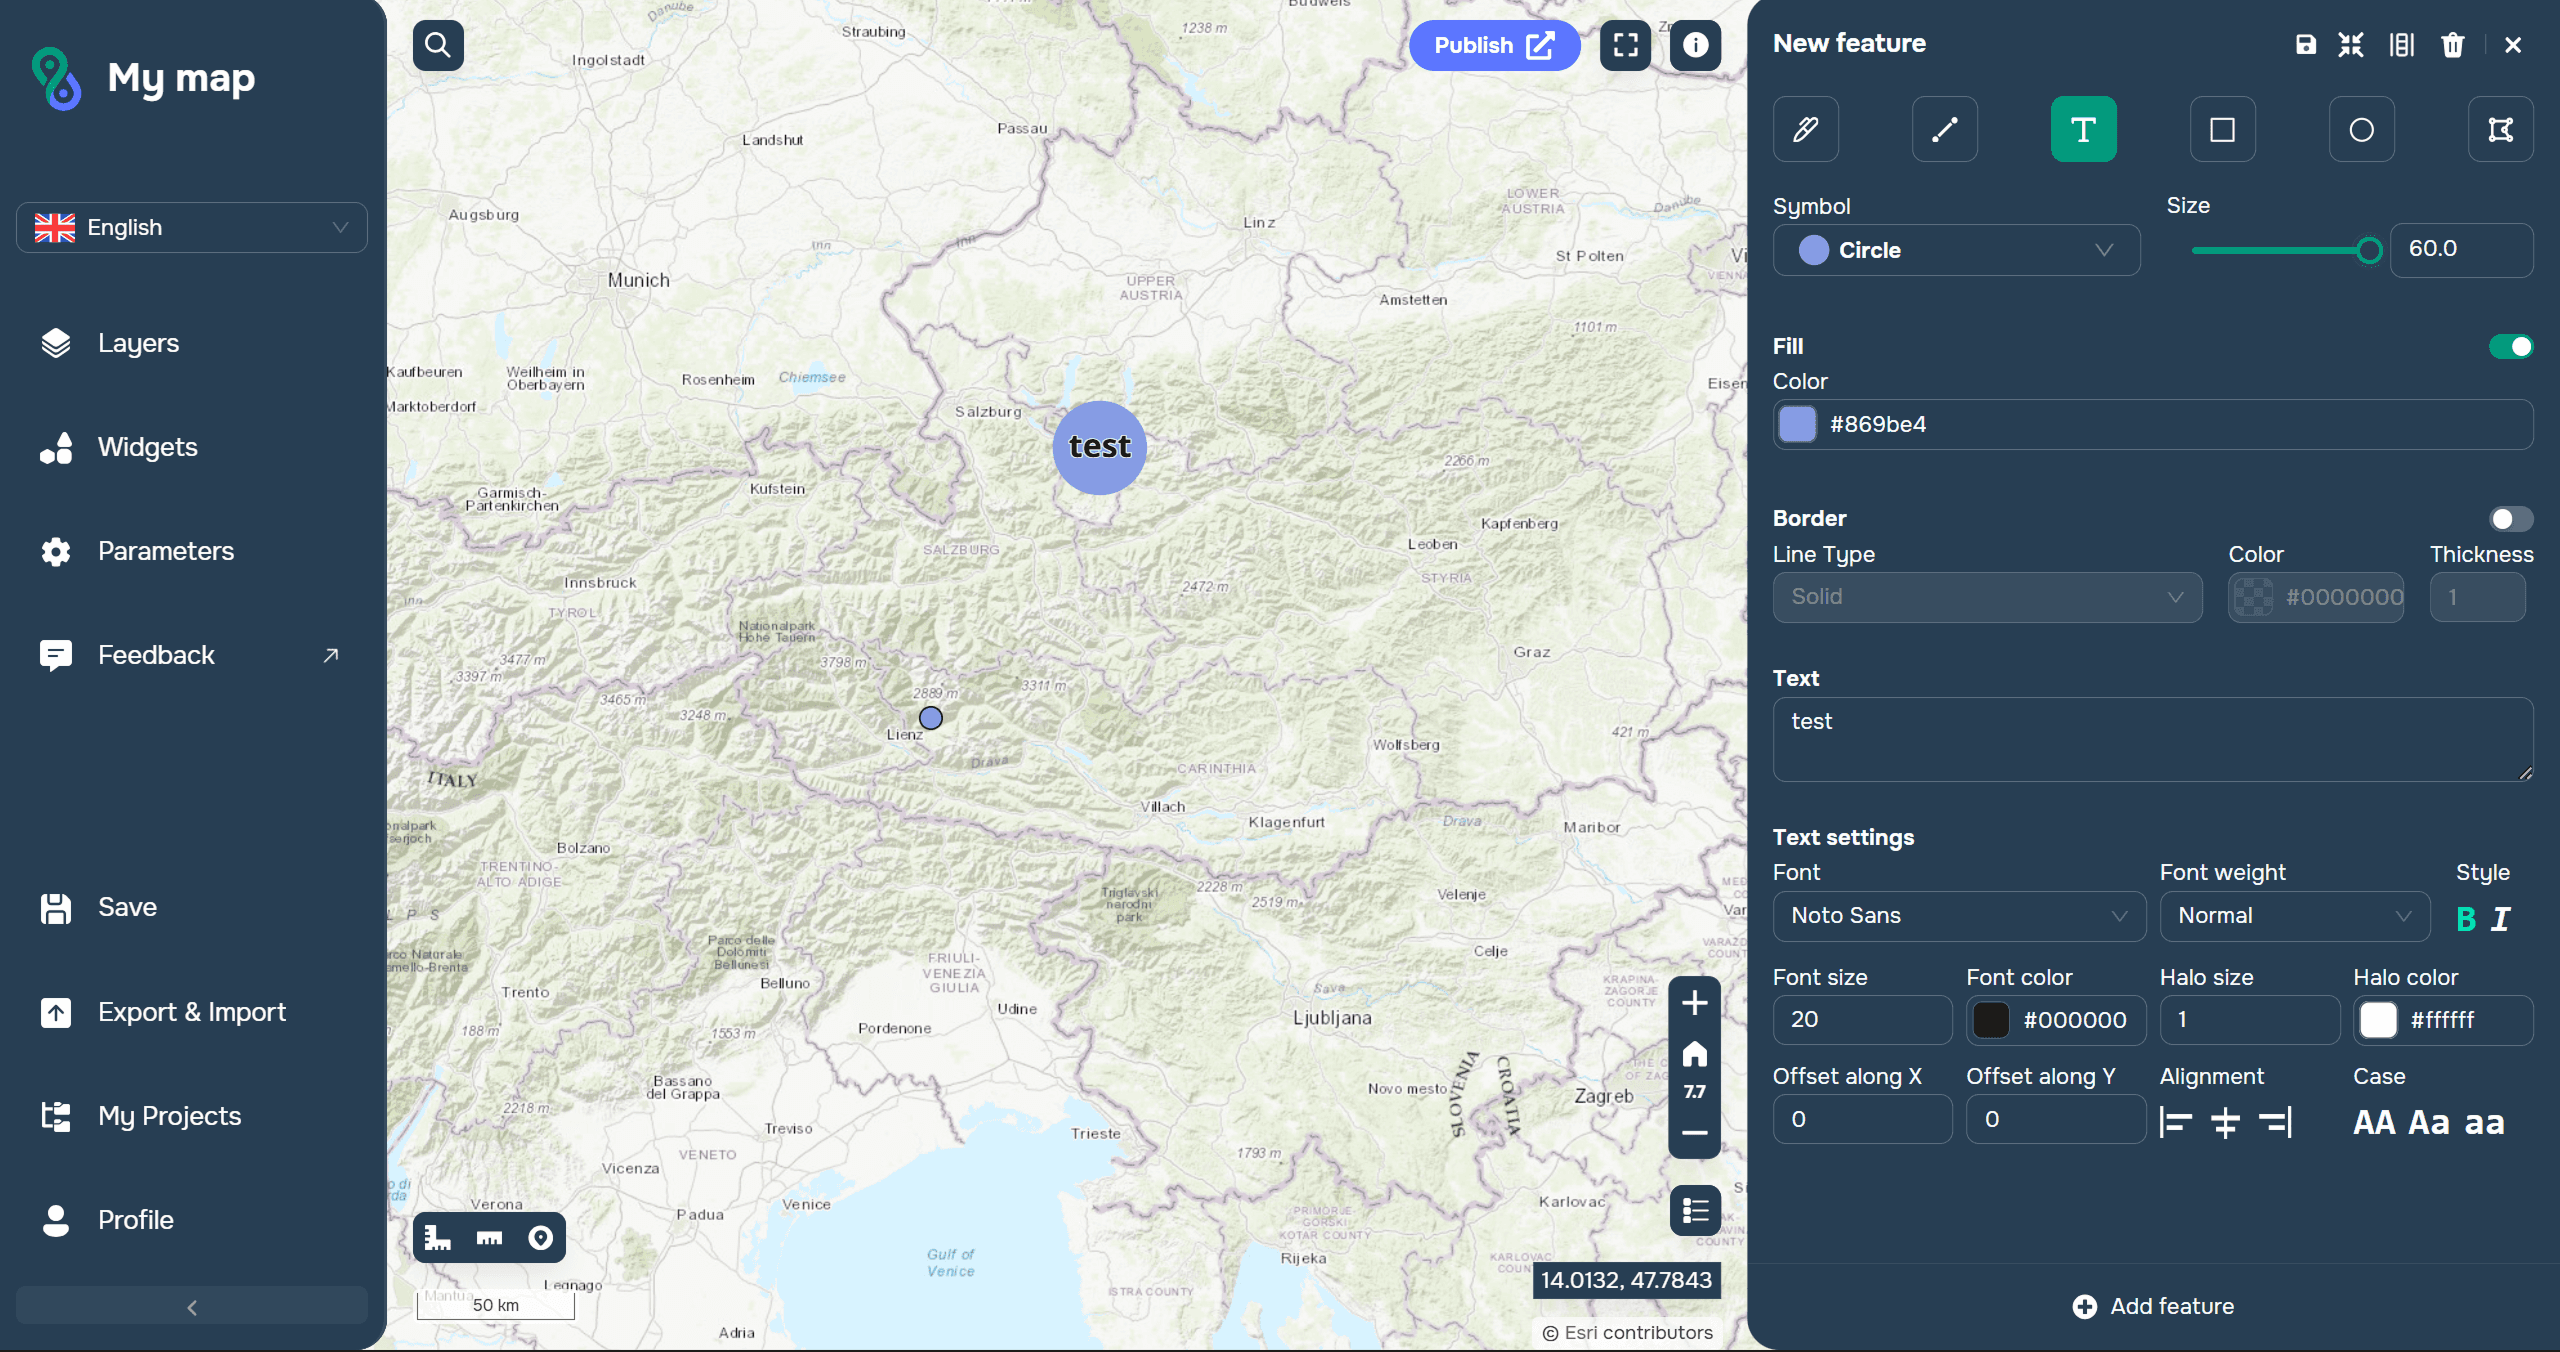
text (you can select the type of shape in which the text will be displayed, its size, color, stroke color and thickness, and customize the text itself)
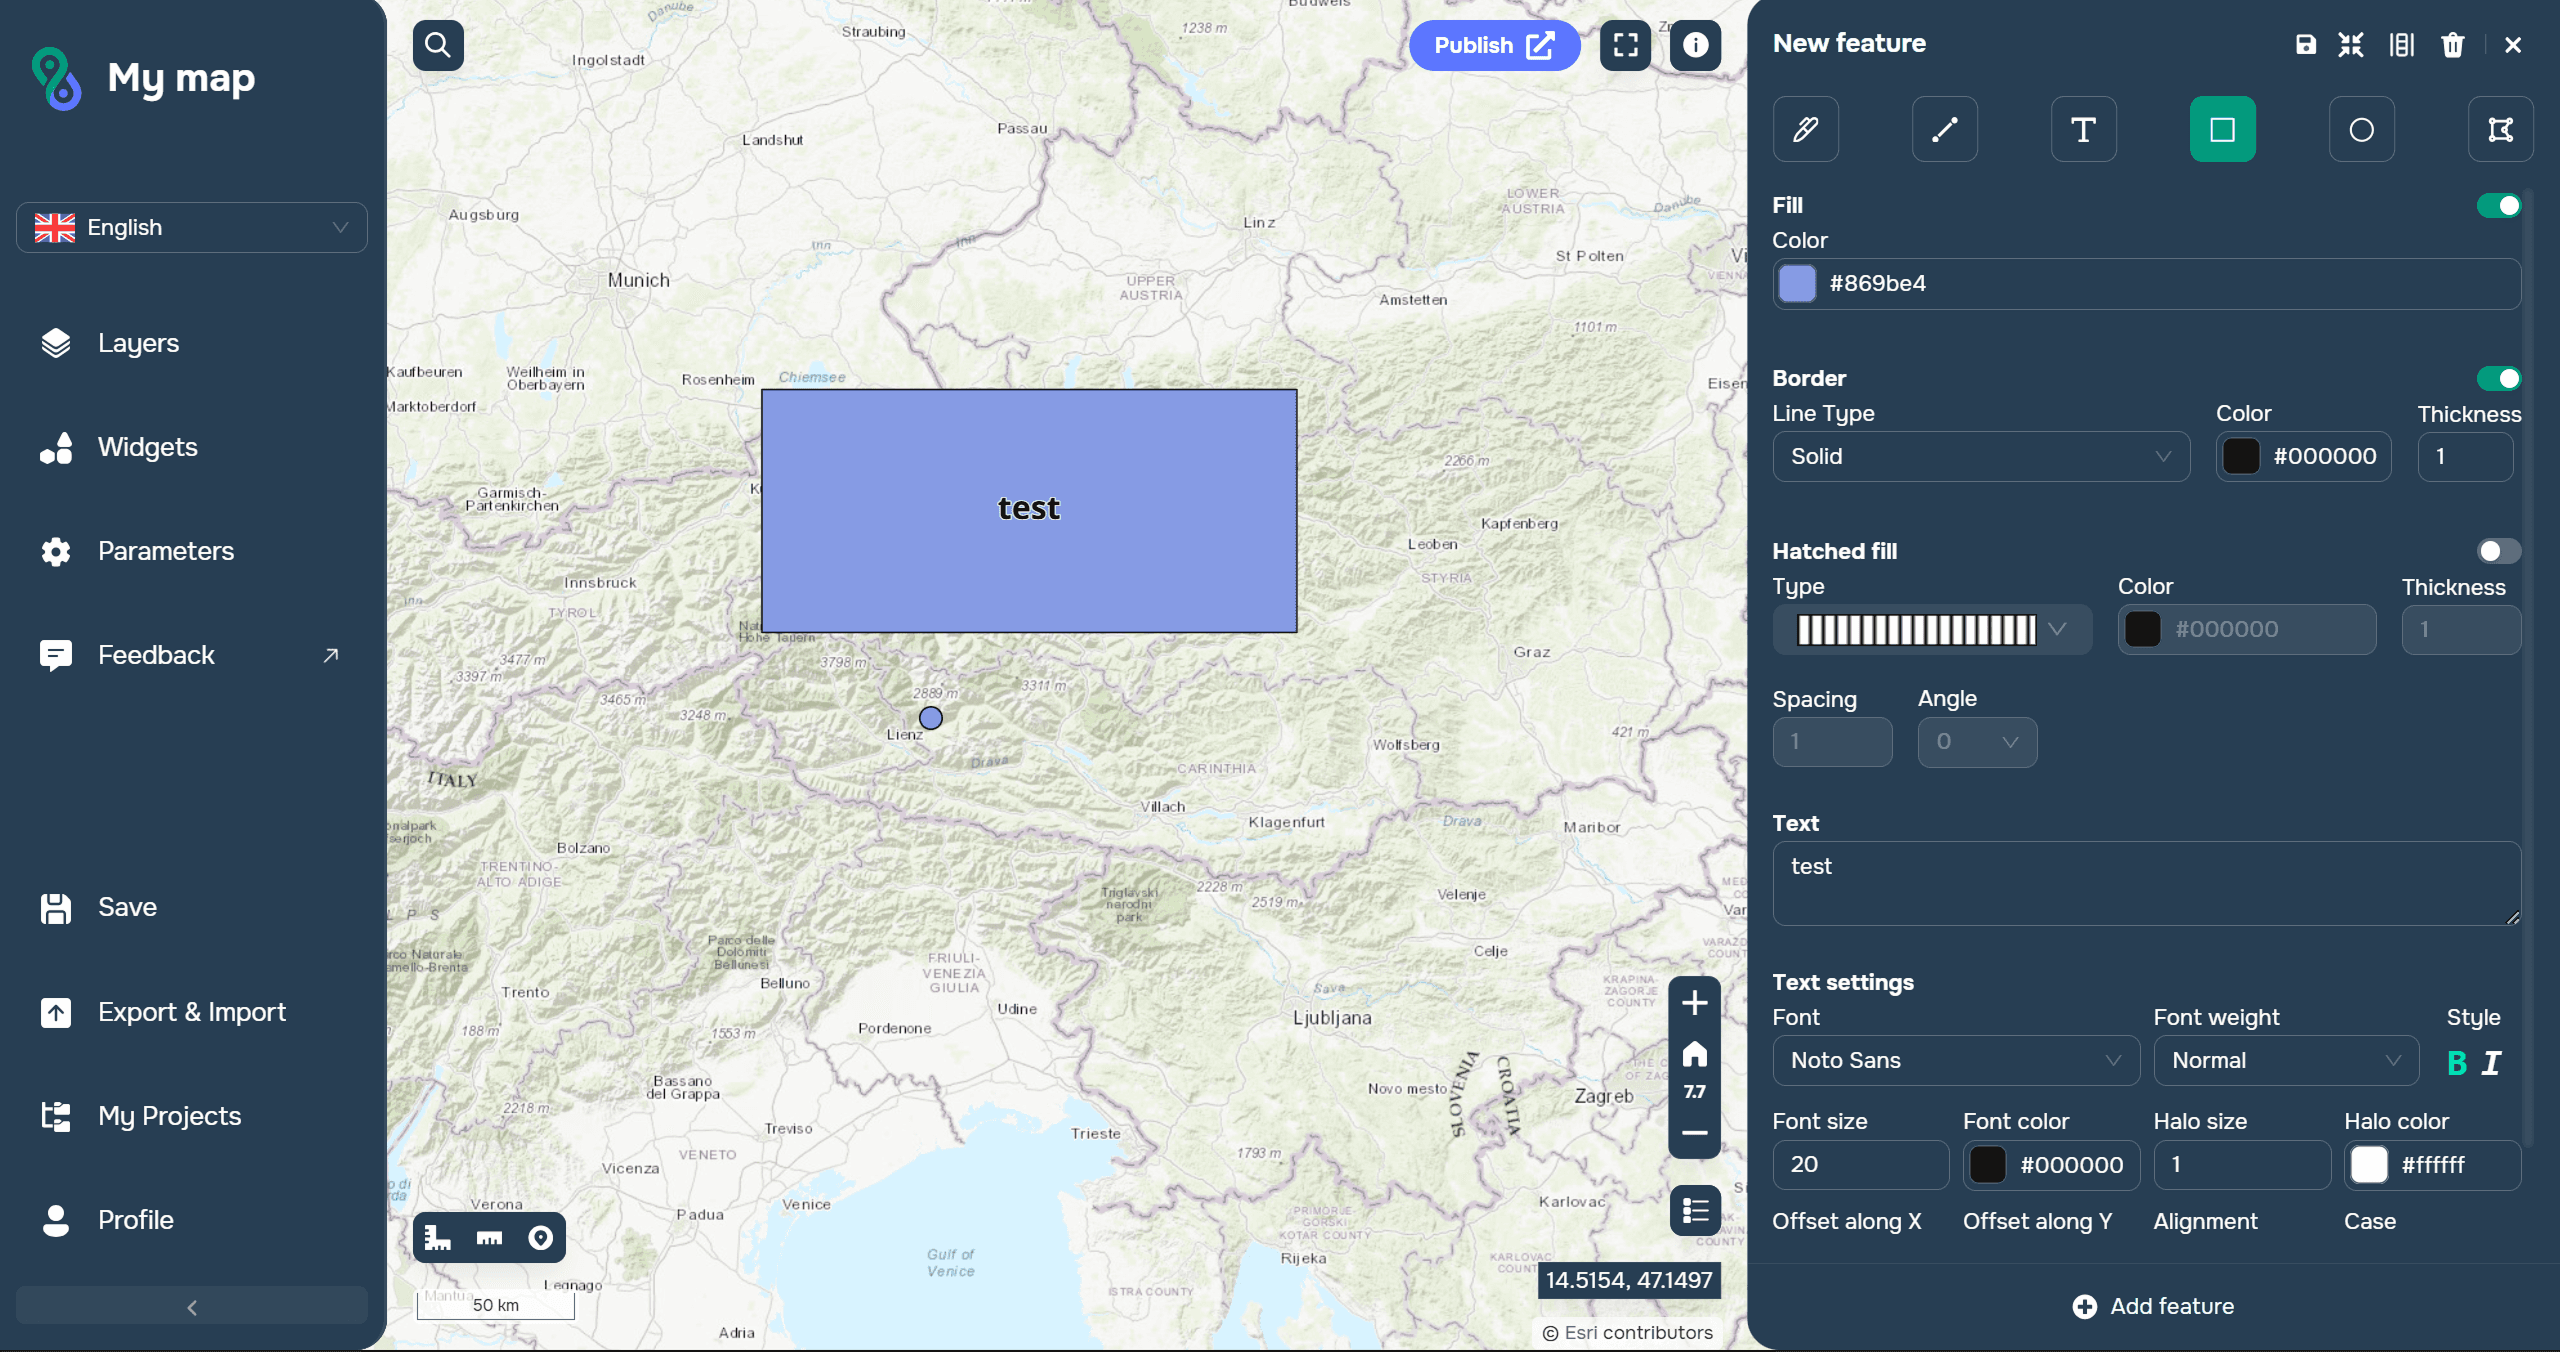
rectangle (you can customize its color, stroke color and thickness, optional hatch type, and labels)
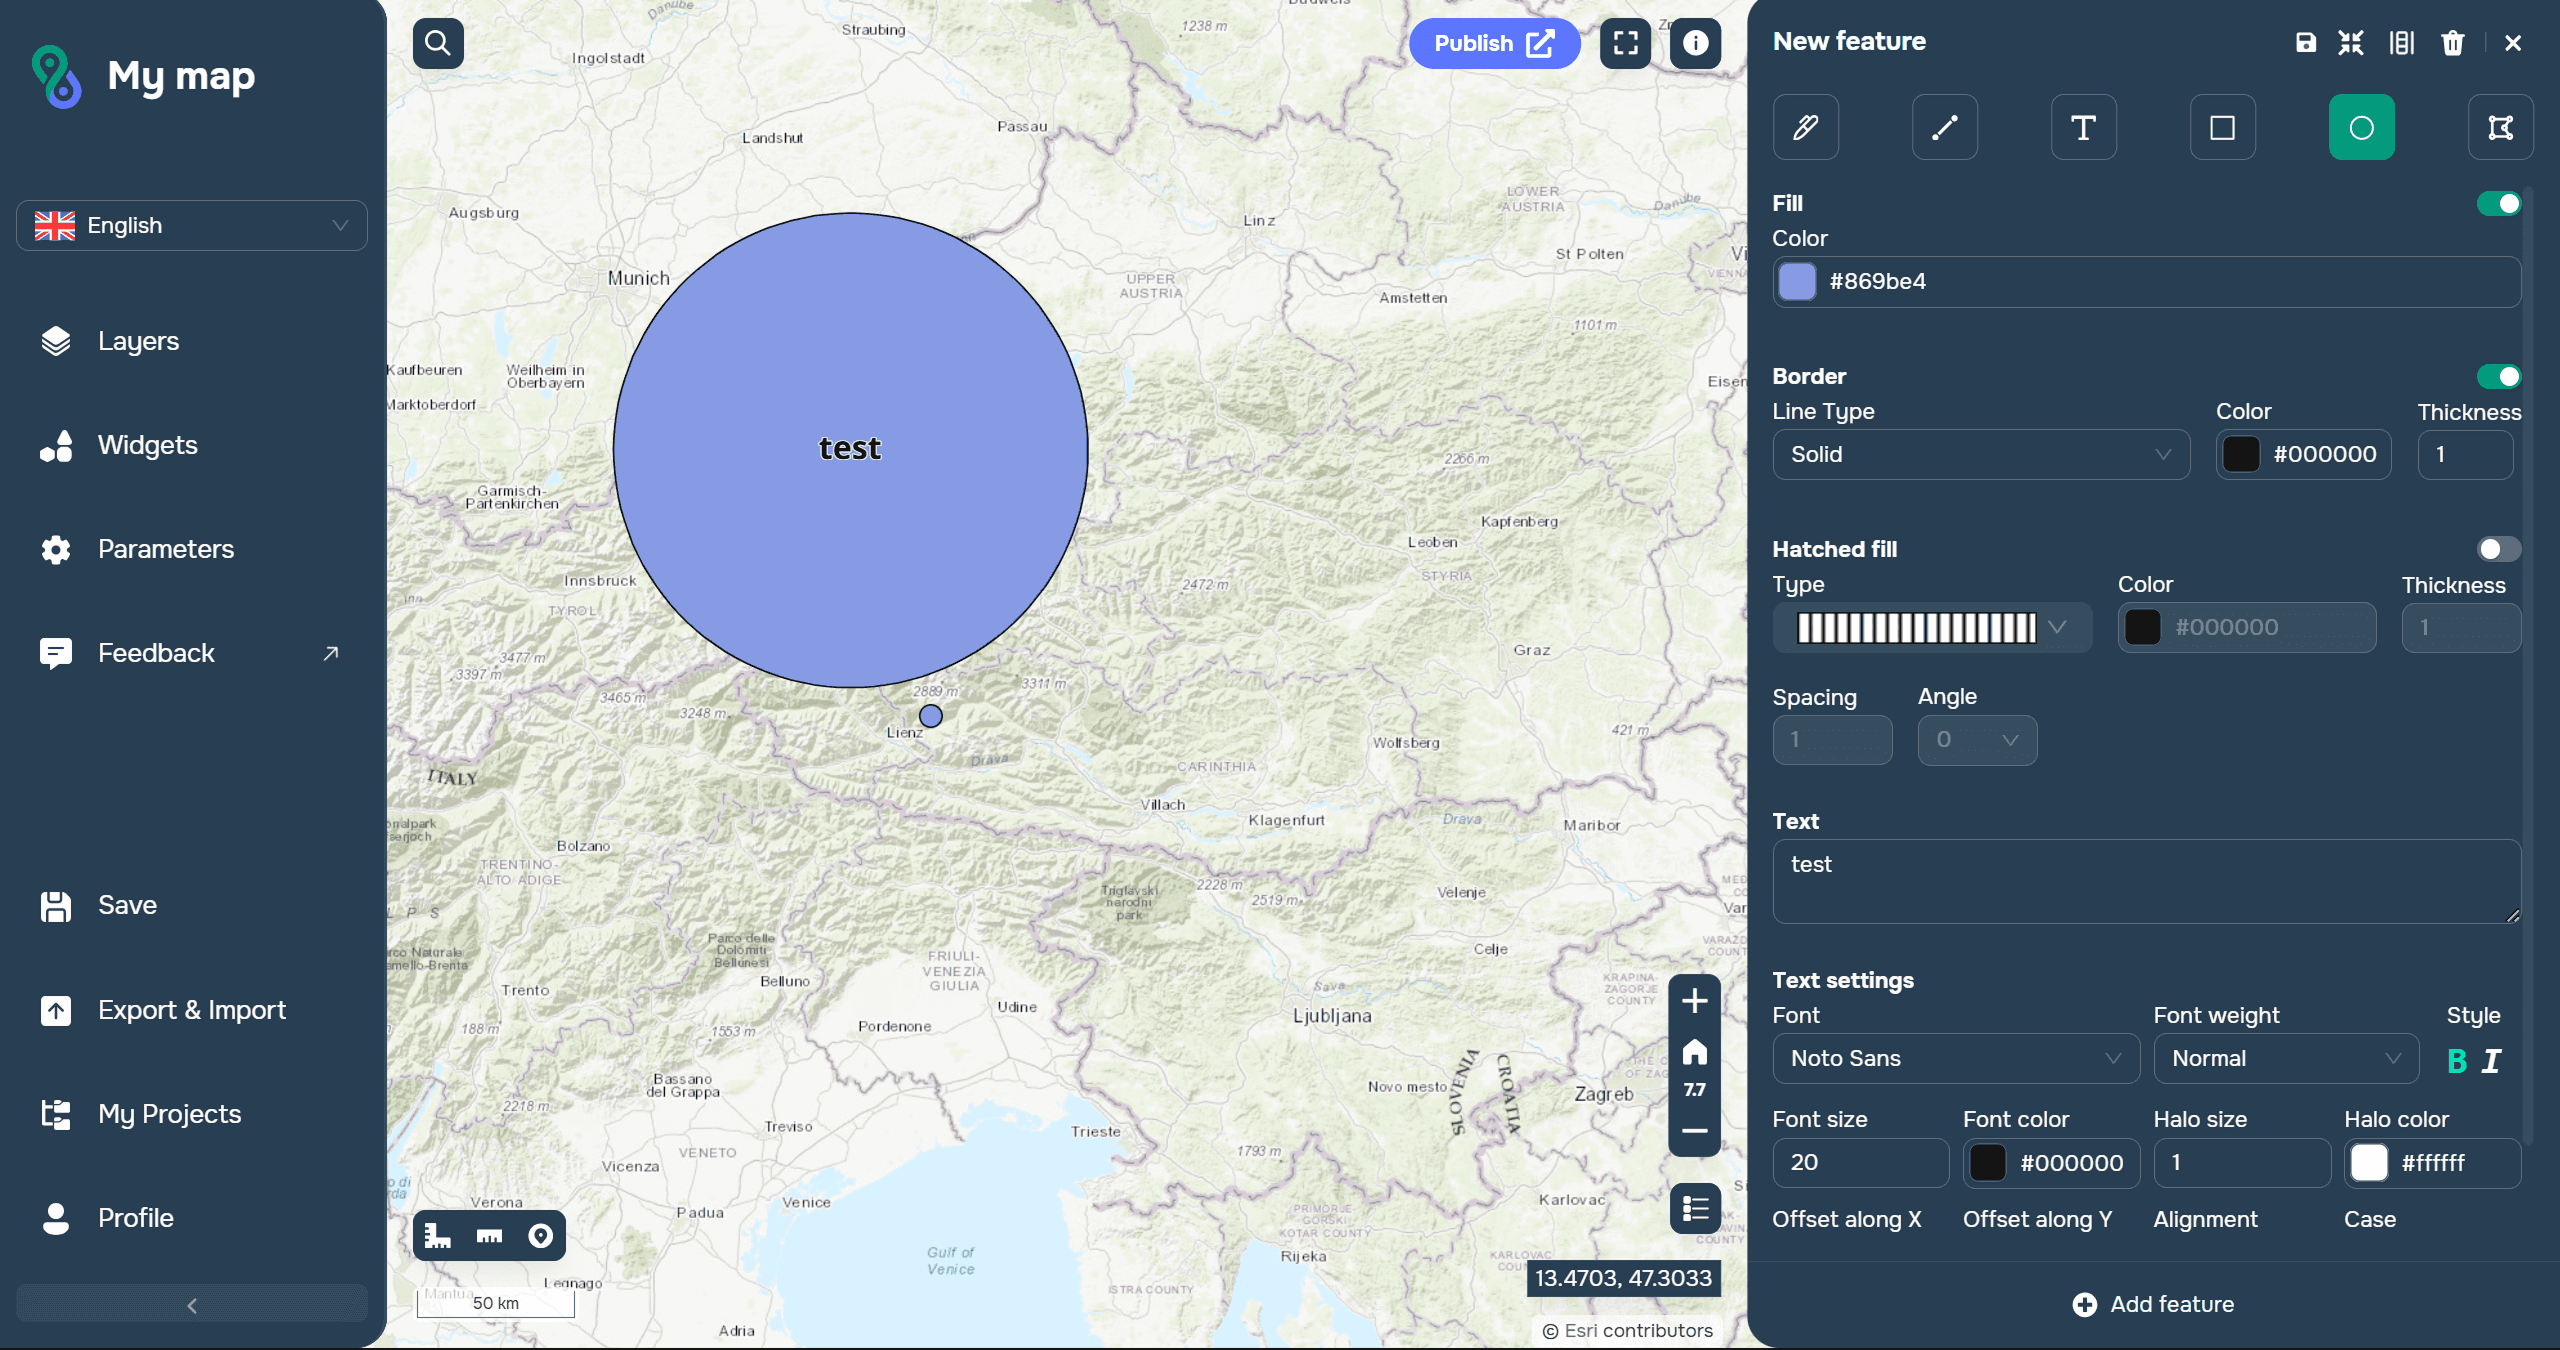
circle (you can customize its color, stroke color and thickness, optional hatch type, and labels)
custom shape (you can customize its color, stroke color and thickness, optional hatch type, and labels)
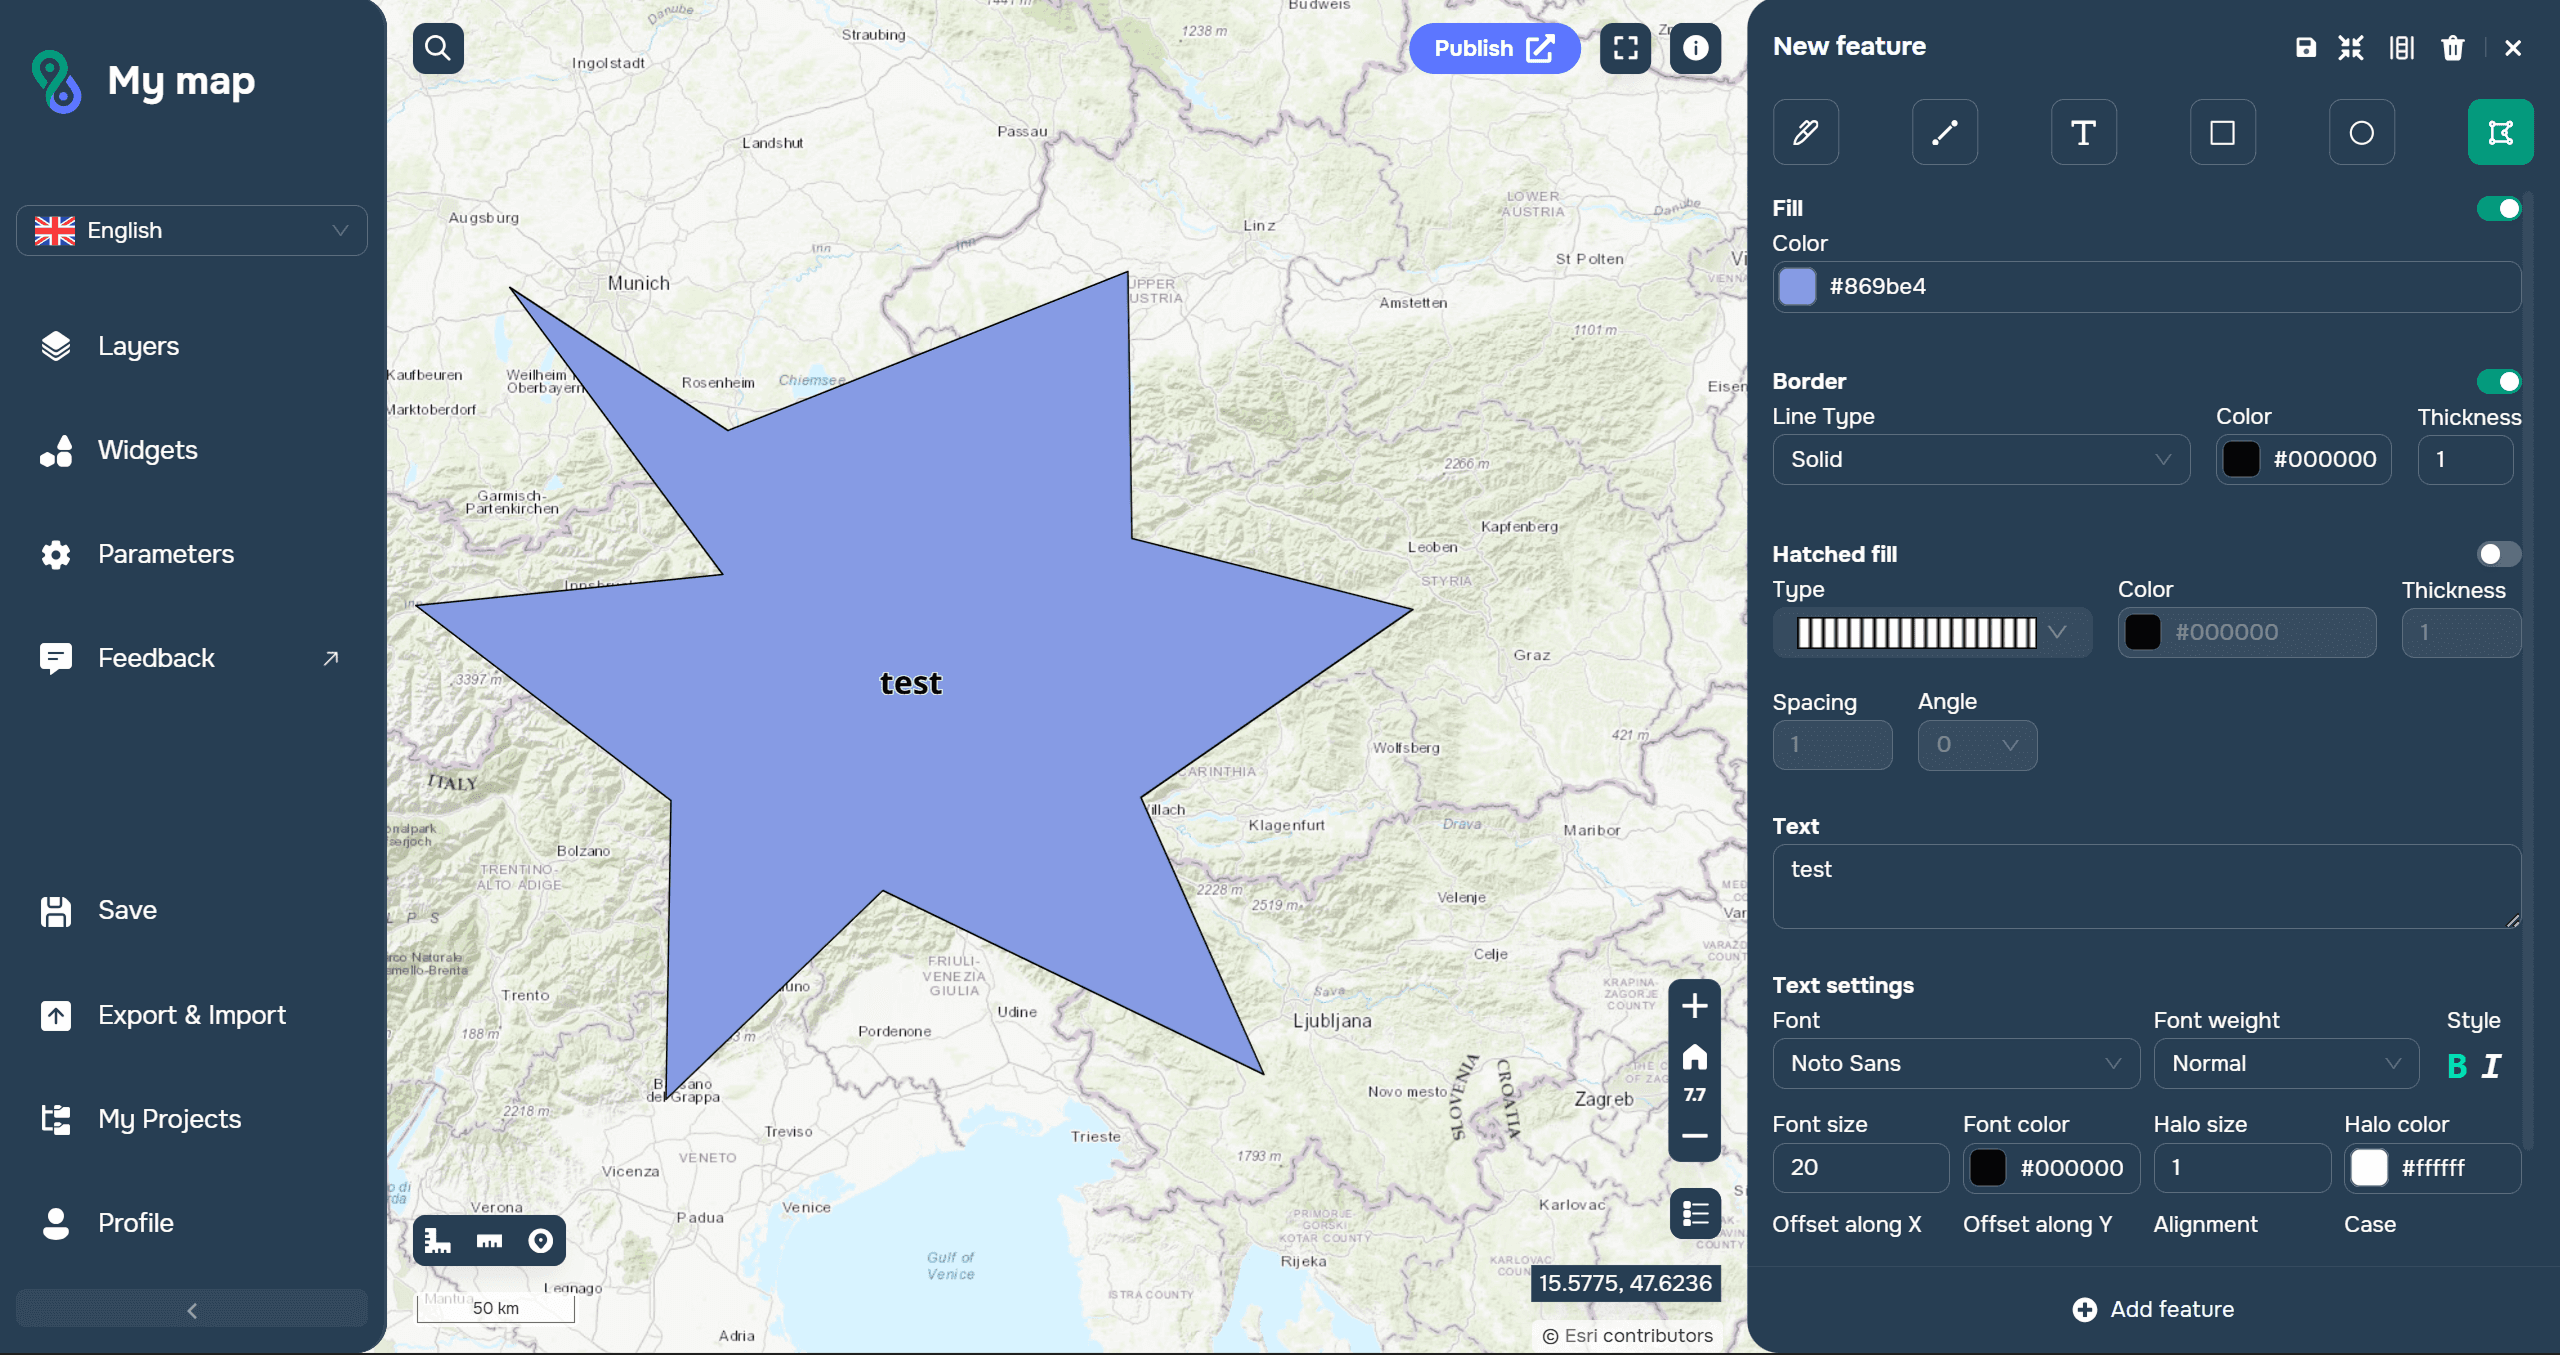
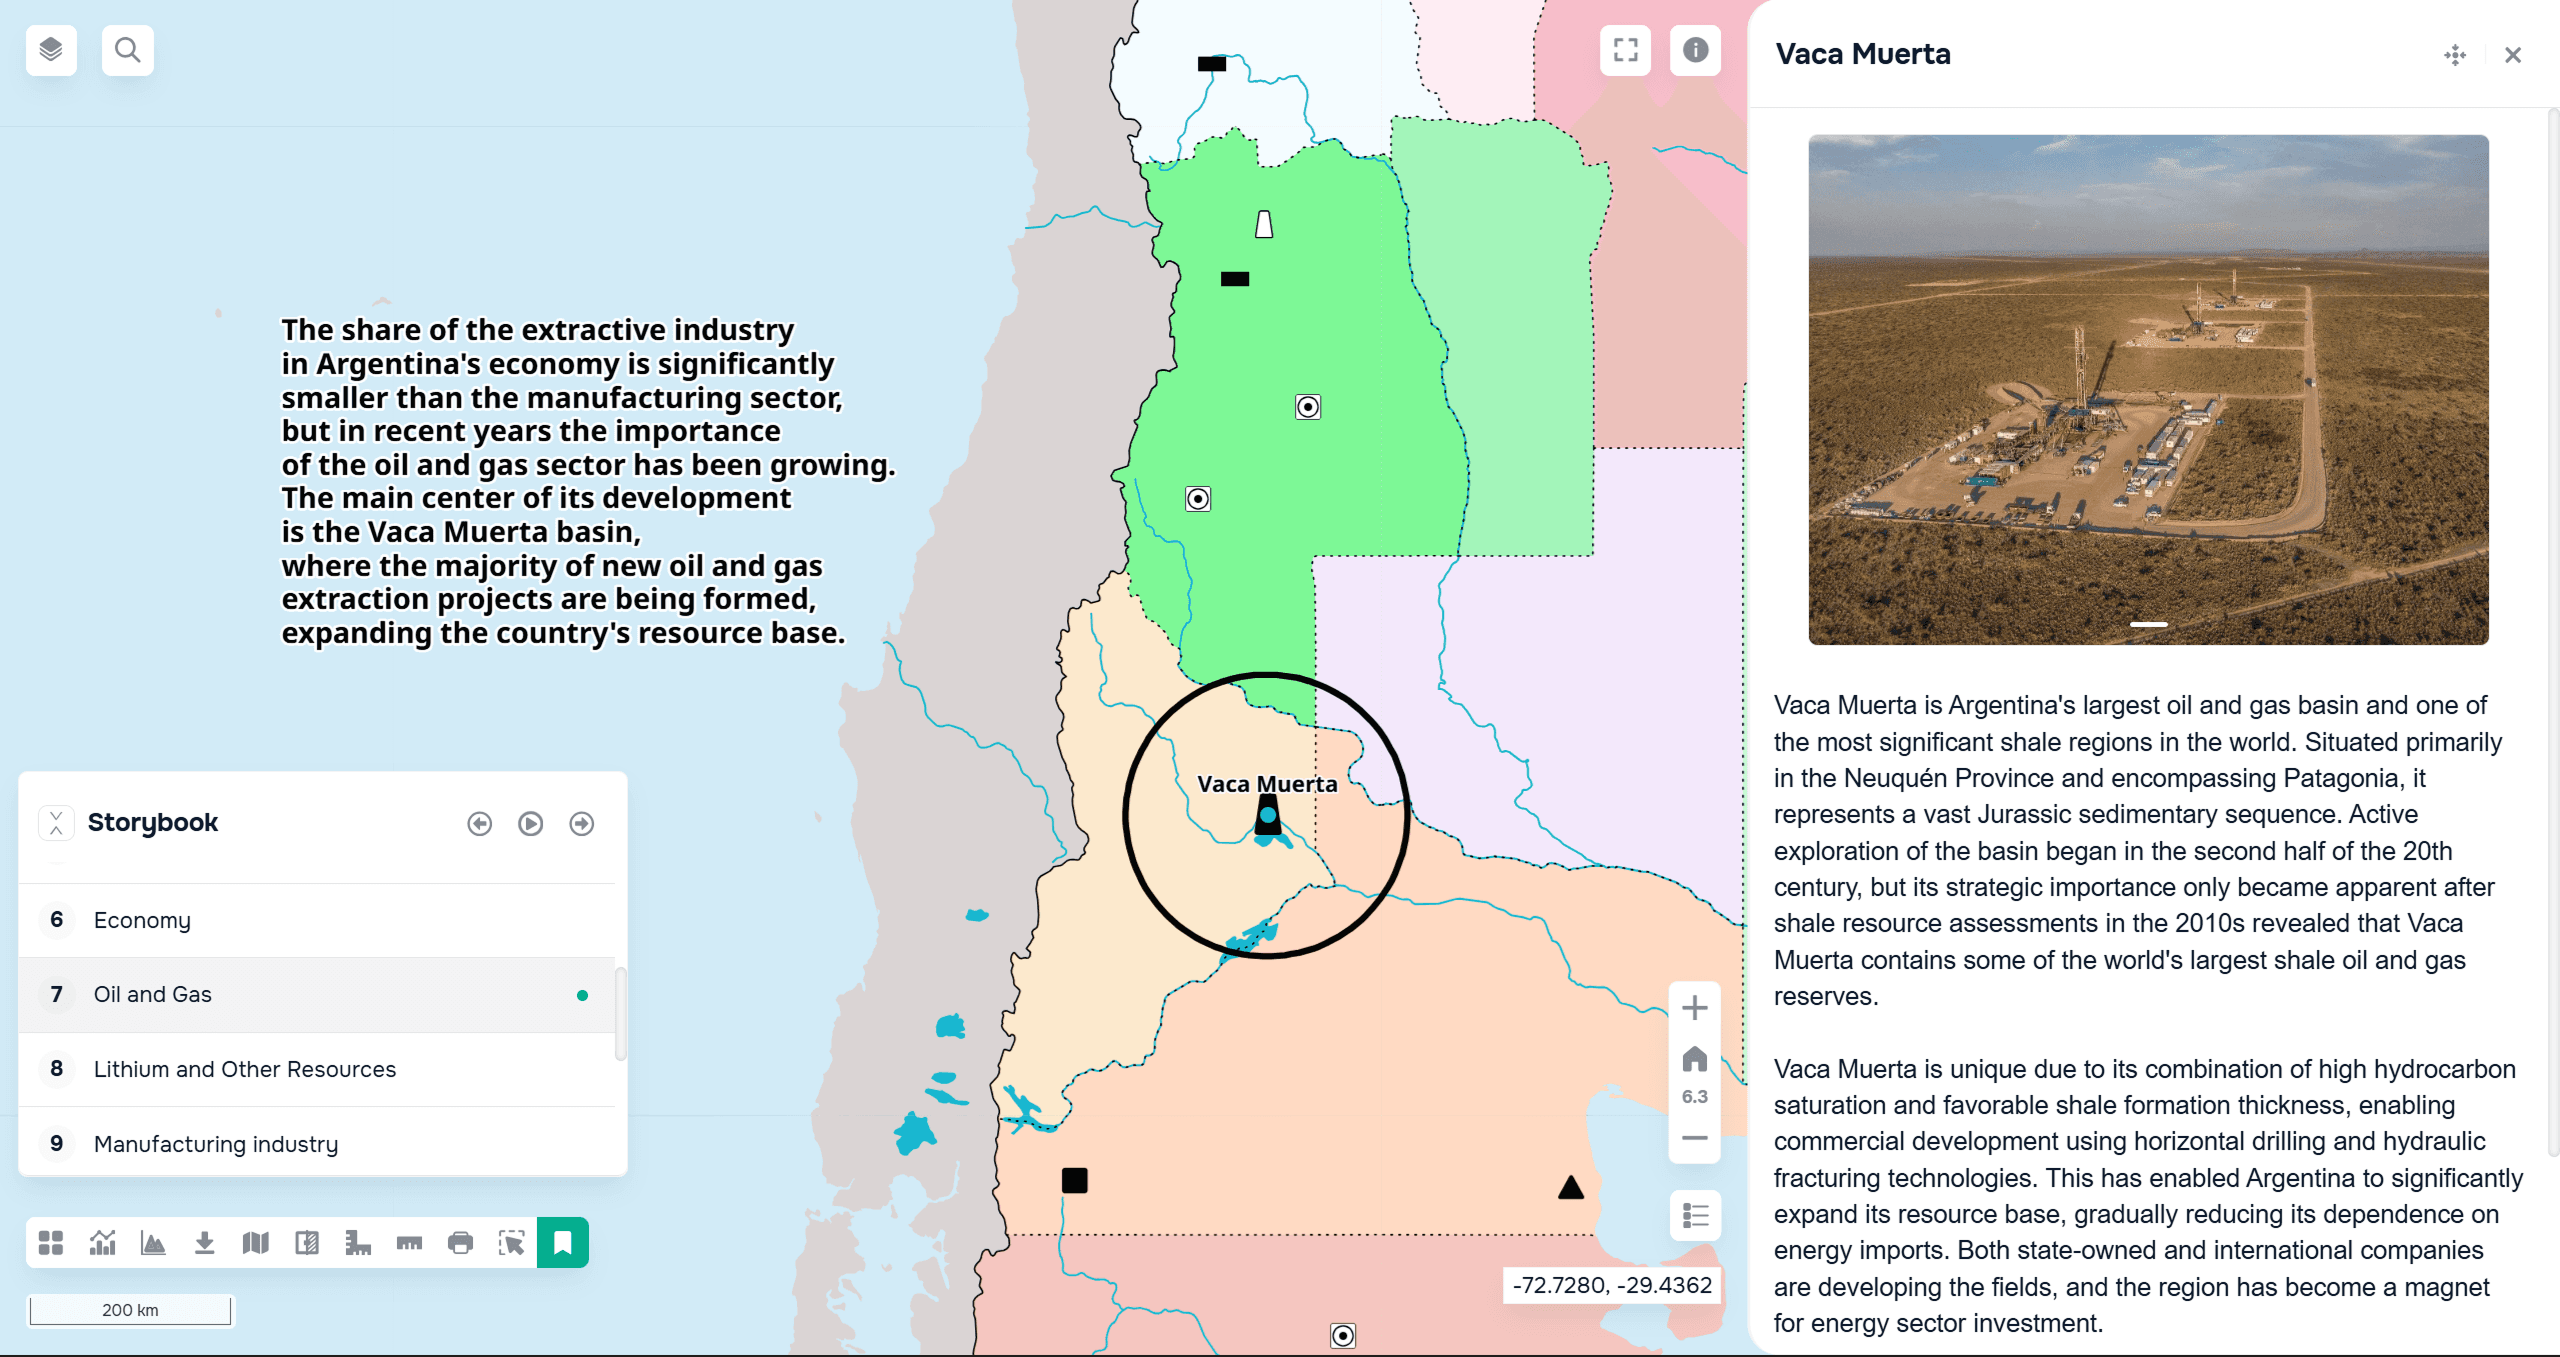
An example of a customized graphic layer with text and shapes.