A simple map can involve a surprising amount of configuration. Add a dataset, choose the right symbols, filter the records, select the fields for a pop-up, enable the tools readers will need, and prepare the project for publication. Each operation is manageable on its own. Together, they require familiarity with several parts of the GIS interface before the map begins to answer a useful question.
AI agents introduce another way to carry out that work. A user describes the intended change in ordinary language, and the agent connects the request to actions available in the application. The result can be a different layer style, a new analytical output or a dashboard beside the map.
This article explains where agents fit into desktop and web GIS, then follows the work they support in GISCARTA, from adding data to publishing a project.
What Makes an AI Assistant an Agent
The word AI covers several different capabilities in GIS. A model that identifies buildings in aerial imagery performs a recognition task. A chatbot that explains how to create a buffer provides guidance. An agent connected to GIS tools can take the next step and create that buffer in the project.
The distinction is execution. An agent needs access to operations it can invoke, along with enough information to choose the relevant data and parameters. That context might include layer names, field definitions, the current map configuration or the result of an earlier operation. The exact information available depends on the integration.
Consider the request to show features near a selected location. It contains several decisions. Which layer contains the relevant features? Does “near” mean 500 metres in a straight line or a ten-minute walk? Should the map hide other features, create a separate output layer, or simply draw a surrounding area? Ordinary language makes the request easier to express, but those choices still determine the result.
A useful agent translates a sufficiently specific request into supported operations. Where information is missing, the workflow needs clarification or an explicit assumption. A plausible answer in the conversation is not enough; the layer, chart or map must also reflect the intended change.
AI Agents in Desktop GIS
Desktop GIS is a natural place for agents because the project already brings together data, processing tools and cartographic settings. The agent can work in the same environment as the analyst, with the output available for inspection in the layer panel, attribute table or map canvas.
QGIS already has third-party plugins that support this approach. The AI Agent describes capabilities including inspecting the open project, styling layers, running Processing algorithms, editing data and creating layouts from natural-language requests. Its default workflow presents proposed changes in a plan before the user applies them, with an optional automatic mode.

AI Agent by TeraLab
Another example is QGPT Agent, which connects natural-language interaction with QGIS operations. The existence of these plugins matters because users can add an agent to an established desktop workflow instead of moving their entire project into a new application.

QGPT Agent
The integration is still specific to the plugin. Installing an AI extension does not mean that every QGIS command becomes available through conversation. The supported tools, model connection, project context and review controls must be checked for the chosen extension. A plugin that helps retrieve data may serve a different purpose from one that builds processing workflows.
There is also a practical distinction between suggesting code and running a GIS operation. A generated expression can be useful, but the user may still need to paste it into the correct editor and diagnose errors. An agent with tool access can perform more of that work within the application. For recurring analytical tasks, the value lies in reducing the manual transitions between steps while keeping the intermediate results available for review.
AI in Web GIS Portals
In a web GIS, the work often centres on a shared map or application. Data must be understandable to people who did not prepare it: the symbols need to communicate a pattern, the pop-ups need useful attributes, and the interface needs an appropriate set of controls.
AI can support different parts of this process. Some assistants help with one narrow task. Esri’s ArcGIS Arcade assistant in Map Viewer, for example, generates Arcade expressions from natural-language instructions. Its documented scope is expression authoring, with limited layer context. It should not be treated as a general agent that operates an entire map.
Other integrations expose analytical tools to agents. The CARTO MCP Server allows configured Workflows to be called as tools by compatible agents. A GIS team can define an operation with specified inputs and outputs, then make that operation available through conversation.
These examples show why the interface alone tells us little. Two products may both have a chat panel, while one explains a procedure and the other executes a spatial workflow. The useful questions are which operations the assistant can perform, what information it receives, and how the user checks the outcome.
For map authors, a particularly practical role is project configuration. Changing a style, enabling a widget or choosing pop-up fields is usually well defined once the user names the target and the desired setting. An agent can bring those operations into a single conversational workflow, with the map providing immediate visual feedback.
What Still Requires Cartographic Judgement
An agent changes how a command is given. It does not change what the underlying data means.
A district coloured by total population answers a different question from one coloured by population density. A count of shops describes the supplied dataset, which may be incomplete or out of date. A circular buffer measures proximity, while a travel-time area depends on a transport network and travel assumptions. These distinctions remain important even when the software performs every requested step correctly.
The same applies to presentation. A map can use the requested colours and still be difficult to read. A chart can calculate the intended statistic and still obscure it with too many categories. The author must judge whether the result communicates the question clearly at the scale and screen size readers will use.
The most effective workflow therefore alternates instruction and inspection: describe a change, examine the result, and refine it where necessary. This is also the approach that makes the GISCARTA AI Agent useful during map creation.
Working with the GISCARTA AI Agent
The GISCARTA AI Agent is part of the Map Builder and helps users configure their projects. The agent window opens when a new project is created. Requests can be entered as text or voice commands, and the interface includes controls for repeating or cancelling a command, clearing the conversation history and uploading a file with geodata.
Usage is tied to the available token balance, which can be checked through the profile icon or the information button beside the agent’s name. A token balance should not be interpreted as a fixed number of map operations; requests can differ substantially in complexity.
These capabilities cover different stages of map creation. The author can examine the distribution of features, define areas of interest and present summaries by category or territory. Some of the work concerns data, some concerns analysis, and some concerns how the result is presented.
The requests below illustrate how to describe these tasks. Layer and field names should be replaced with those in the actual project, and results should be checked after each change.
Managing Widgets
The agent manages the platform’s widgets through natural-language requests. A command such as “Enable the geoprocessing widget” makes the relevant tool available on the map. The dashboard widget can also be added and enabled before its charts are configured. This allows authors to assemble the tools their project needs as the work progresses. The resulting interface can then be checked to ensure that each widget serves the map’s purpose.

The request to enable a widget, with the corresponding control visible on the map.
Adding Data to the Map
The agent supports adding data to the map, and its interface includes a geodata upload control. An illustrative request is “Add the uploaded dataset to this map”. If a layer is already in the project, a request such as “Show the selected layer” changes its visibility instead. Clear layer names help identify the intended dataset as the project grows. After adding data, check that the features appear in the correct location and contain the fields needed for analysis.

A data-addition request, the new layer in the layer list and its features on the map.
Styling Layers
The agent can change layer styles through requests that specify the layer and its visual properties. For example, ask it to give the buffer layer a pink fill, a red outline and enough transparency to keep the streets visible. Fill, outline and transparency can be adjusted to make overlapping features easier to distinguish. When specifying a numerical value, check whether the setting represents transparency or opacity. The map provides immediate feedback on whether the revised style communicates the intended pattern.

The styling request and the resulting fill, outline and transparency of the selected layer.
Filtering Layers
The agent can configure layer filters to show features that meet a specified condition. For example, ask it to show only records where the Status field is Active in the selected layer. Naming the layer, field and value makes the intended subset explicit. Filtering changes which records are displayed without asking the agent to delete the remaining data. Check the visible features and their count to confirm that the condition matches the intended records.

A filter request and the map showing the matching features.
Configuring Layer Info Windows
The agent can configure which attributes appear in a layer’s info window. For example, ask it to show the name, category and description fields for the selected layer. This focuses the window on information readers need after clicking a feature. The requested field names must match those available in the dataset. Check several features, including records with missing values or long descriptions, to ensure that the result remains readable.

The info-window request and an open feature window showing the chosen attributes.
Adding External Data from the Model’s Knowledge Base
The agent supports adding external data from the model’s knowledge base. An illustrative request is to add a point layer of cities in a specified region. Define the geographic scope and type of features clearly, since city locations and administrative boundaries represent different information. Check the returned data for location accuracy, completeness and currency before publishing conclusions based on it. Where a particular release, licence or measurement date matters, use a dataset with verifiable provenance.

The external-data request and the resulting layer, including any source information returned by the agent.
Creating Dashboards
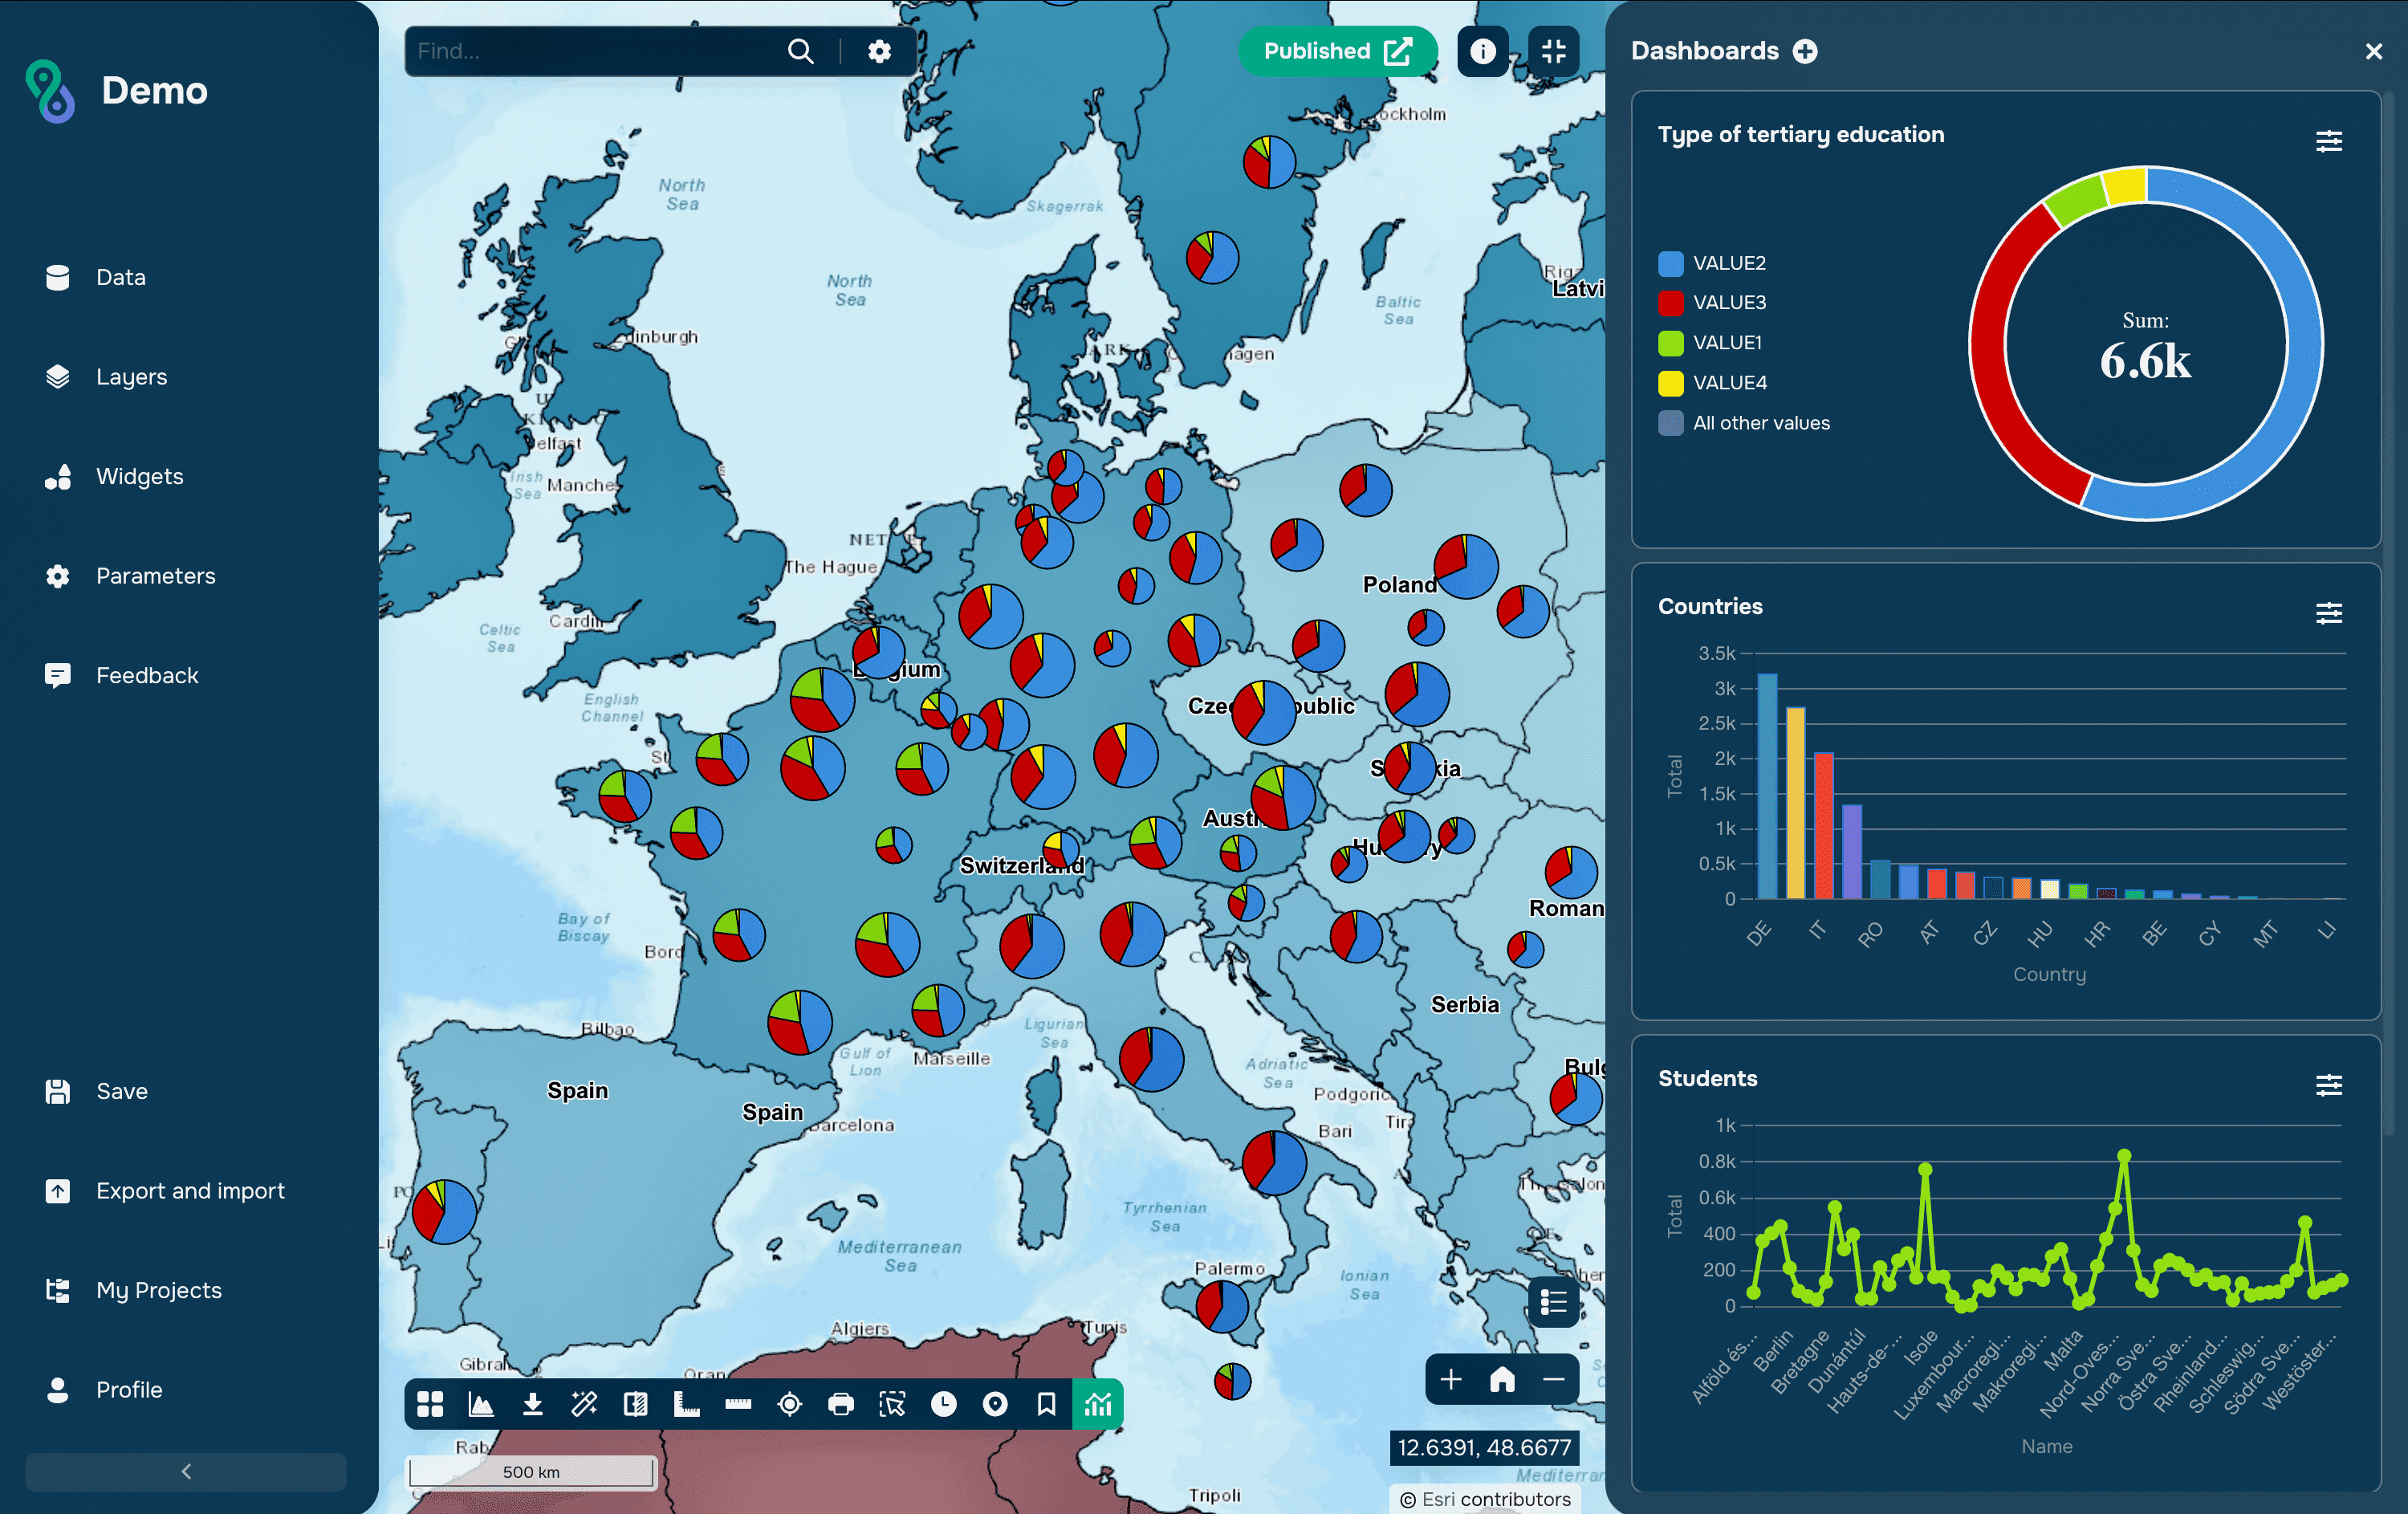
The agent can create dashboards that present summaries alongside the map. For example, ask it to create a doughnut chart counting features by Category, using the layer’s category colours. A bar chart can provide a clearer comparison when the data contains many categories or territories. Specify the source layer, grouping field, statistic and chart type so the request defines what should be calculated. Check the totals, labels and grouping, especially when several records may represent the same feature.

The dashboard request with the resulting chart and map visible together.
Running Geoprocessing Tools
The agent can launch the platform’s geoprocessing tools using the inputs and parameters specified in a request. For example, ask it to create a buffer around the features in a selected layer and add the result as a new layer. The resulting polygons can then be renamed and styled for the map. Naming the input, distance and output makes the operation easier to verify than a general request to analyse accessibility. Check the output geometry before using it in further analysis.

The buffer request and the new buffer layer around the input features.
Building Service Areas and Routes
The agent supports building service areas and routes along a transport network. For example, ask it to create a ten-minute riding service area from a selected location using an available travel mode. Unlike a circular buffer, this area represents reachability under the routing tool’s network and travel assumptions. A routing request should identify the start, destination and travel mode. Check that the result follows the intended network and treat the travel time as an estimate.

A service-area or routing request with its origin, travel mode and resulting geometry.
Configuring Base Maps
The agent can configure the base map that provides geographic context for the project. For example, ask it to switch to a light basemap available in the project. A quiet background helps coloured points and transparent polygons remain visible, while other tasks may call for imagery or detailed streets. Use the available base-map name where possible to identify the intended option. Check labels and thematic colours at the scales readers are likely to use.

The base-map request and the thematic layers displayed against the selected background.
Publishing the Project
The agent supports project publication as part of the map-building workflow. An illustrative request is “Publish this project”. Before publication, check the title, initial view, visible layers, info windows and dashboard labels. Review the sharing settings to ensure that they match the intended audience. Open the resulting viewer and test the map as a reader to confirm that the published project works as intended.

The publication request and the resulting project opened in its viewer.
Writing Requests That Produce Useful Maps
The strongest requests give the agent a clear target and a specific change. “Improve the map” leaves most of the decisions unstated. “Make the buffer layer transparent enough to show the streets and give it a red outline” describes a result that can be checked immediately.
For analytical tasks, include the units and intended output. For charts, identify the grouping field and statistic. For filters, name the field and matching value. When several layers have similar names, use the exact layer reference available in the interface.
Break a complex task into stages when the result of one step affects the next. Add and inspect the data before filtering it. Check the analytical output before choosing its styling. Verify the chart’s grouping before adjusting its colours. Short, explicit steps make corrections easier to explain.
GISCARTA brings these operations into the map-building conversation, allowing authors to move between data, presentation and analysis through requests tied to a visible result. The author’s attention can then stay on the questions that give the map its value: what the data represents, which comparison matters and whether the finished project communicates it clearly.