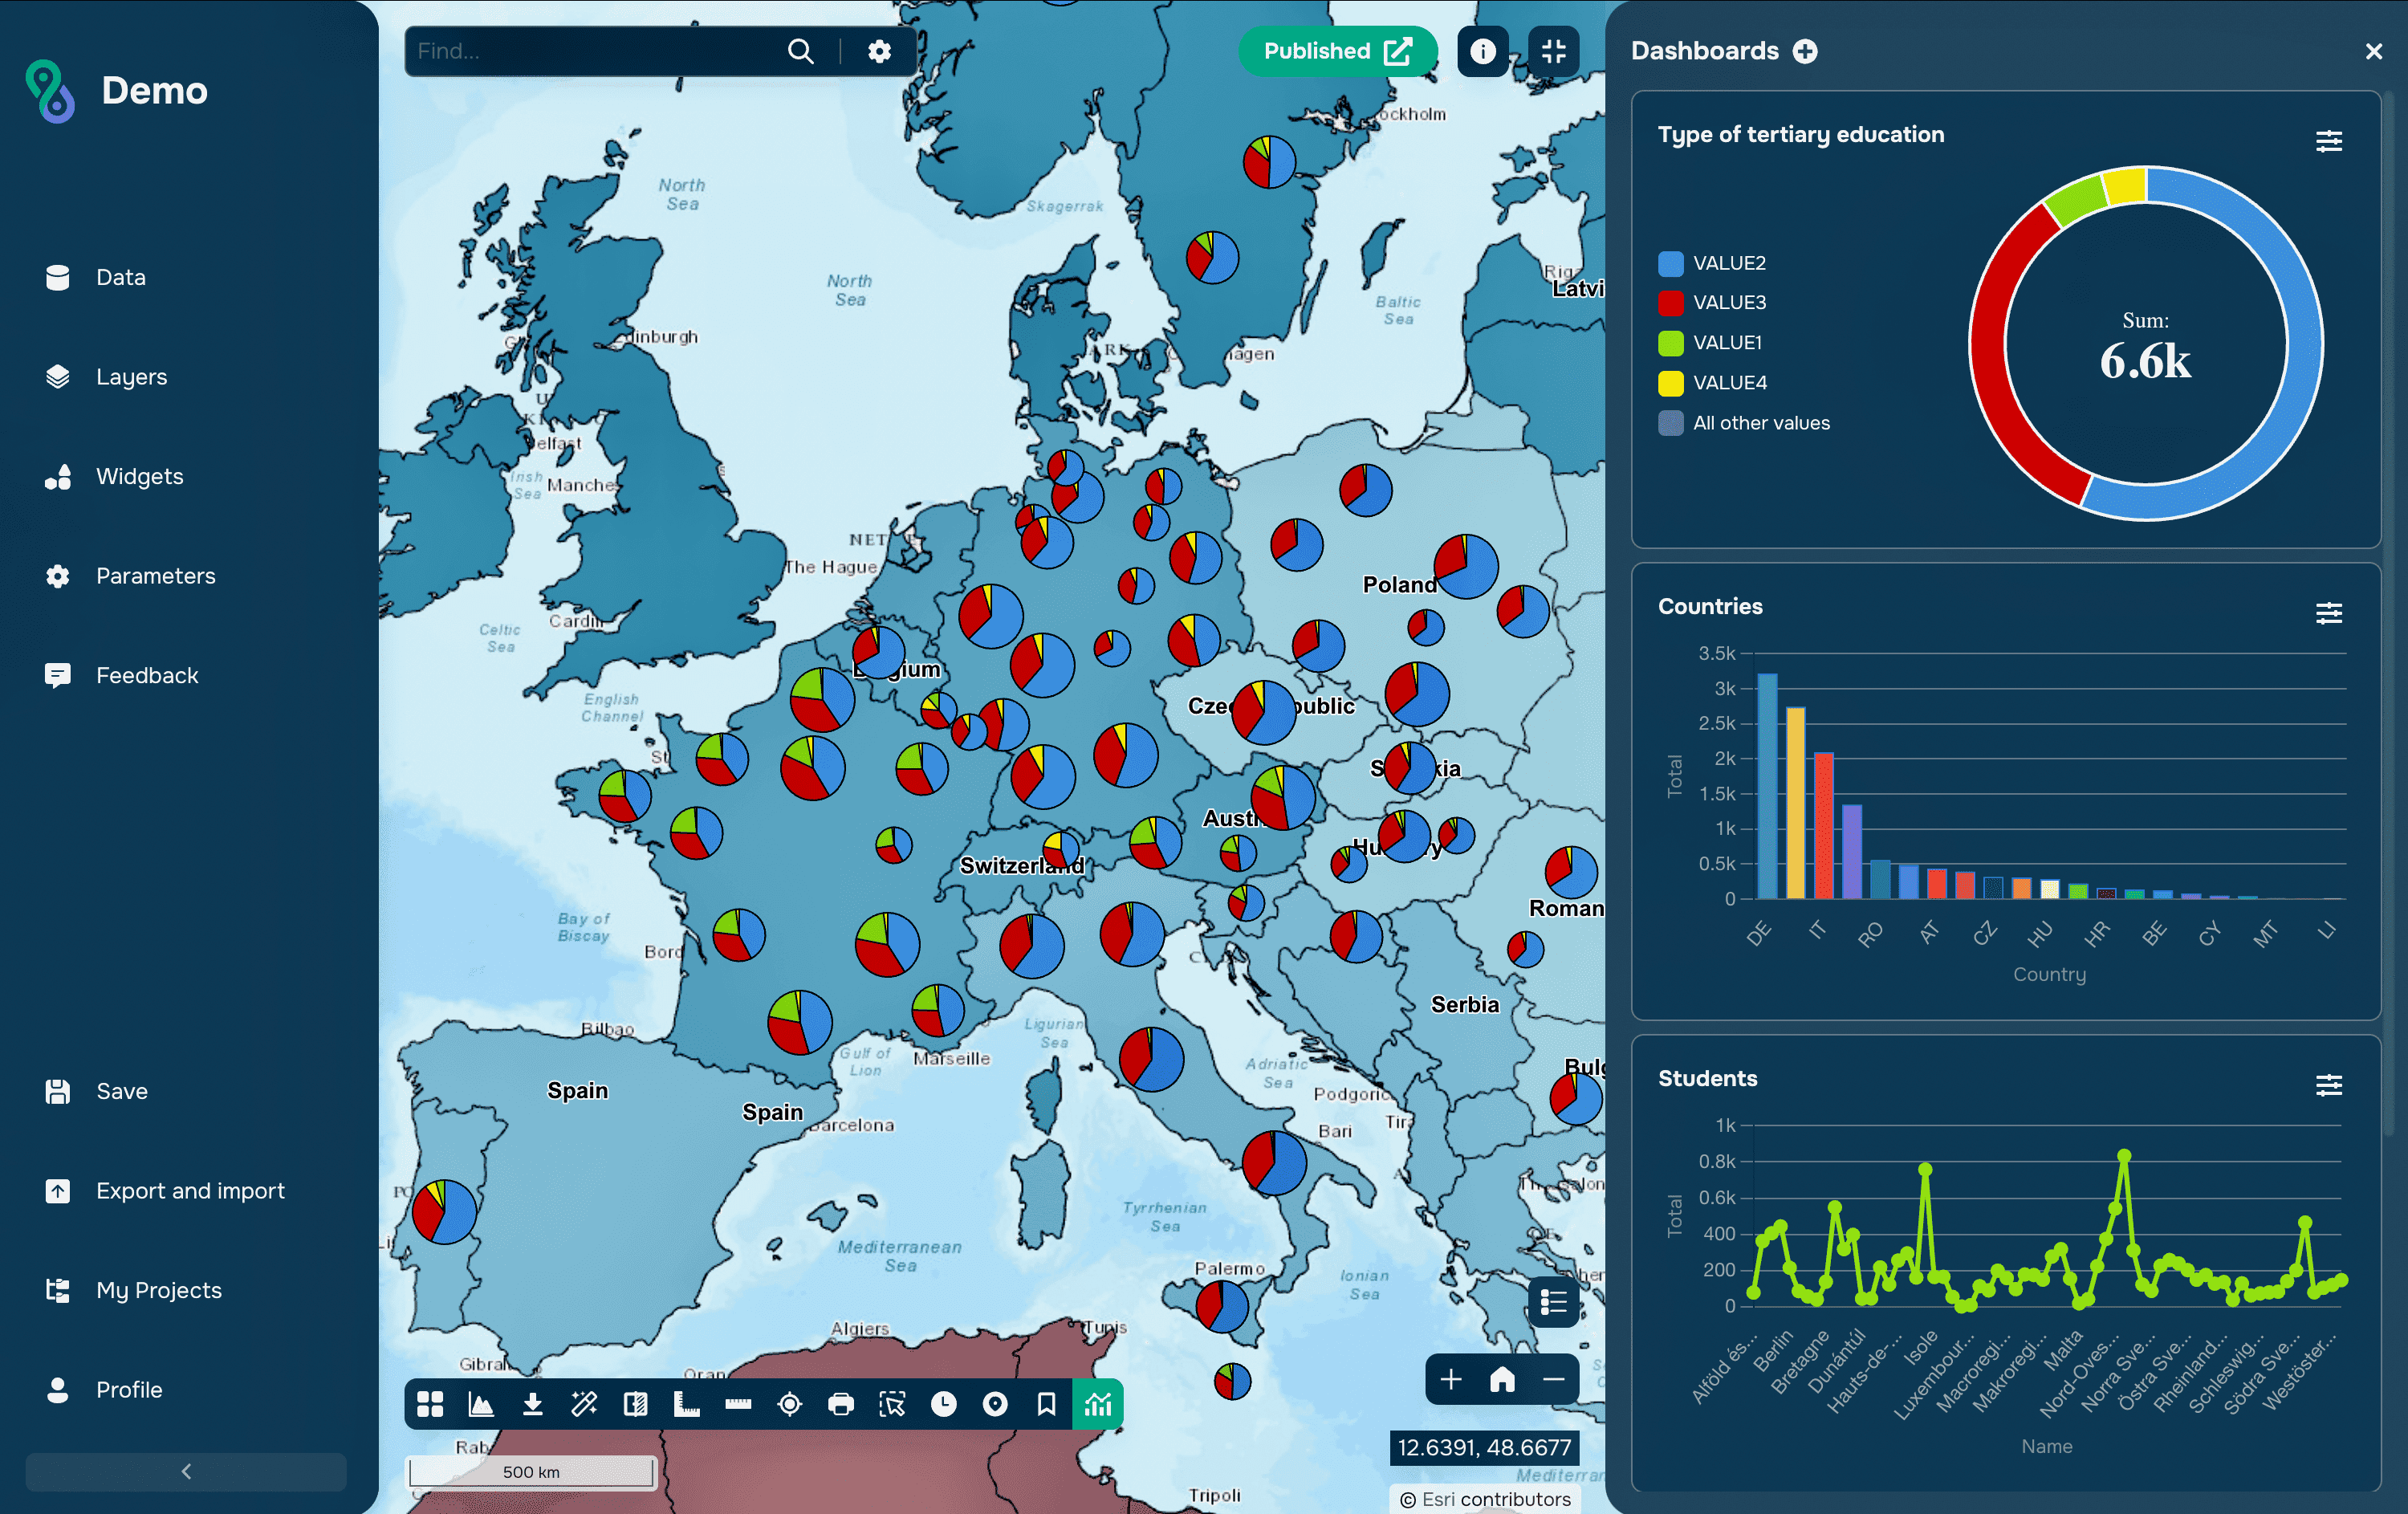
When working with geographic information systems, users often encounter large volumes of spatial data. Thousands of objects can be displayed simultaneously on a map: buildings, roads, land parcels, utility networks, natural features, and much more. To quickly find the information you need and focus only on the objects of interest, data filtering is used.
What is filtering?
Filtering is the process of selecting objects based on specified conditions. Instead of displaying the entire layer, the user can display only those objects that meet certain criteria.
For example, you can display:
cities with a population of over 100,000;
land parcels of a certain category;
federal roads;
buildings constructed after 2020.
Filtering makes the map more visually appealing, speeds up information retrieval, and facilitates analysis without changing the original data.
Filtering in GISCARTA
In GISCARTA, filtering is available for vector layers and allows you to quickly select features by their attribute values.
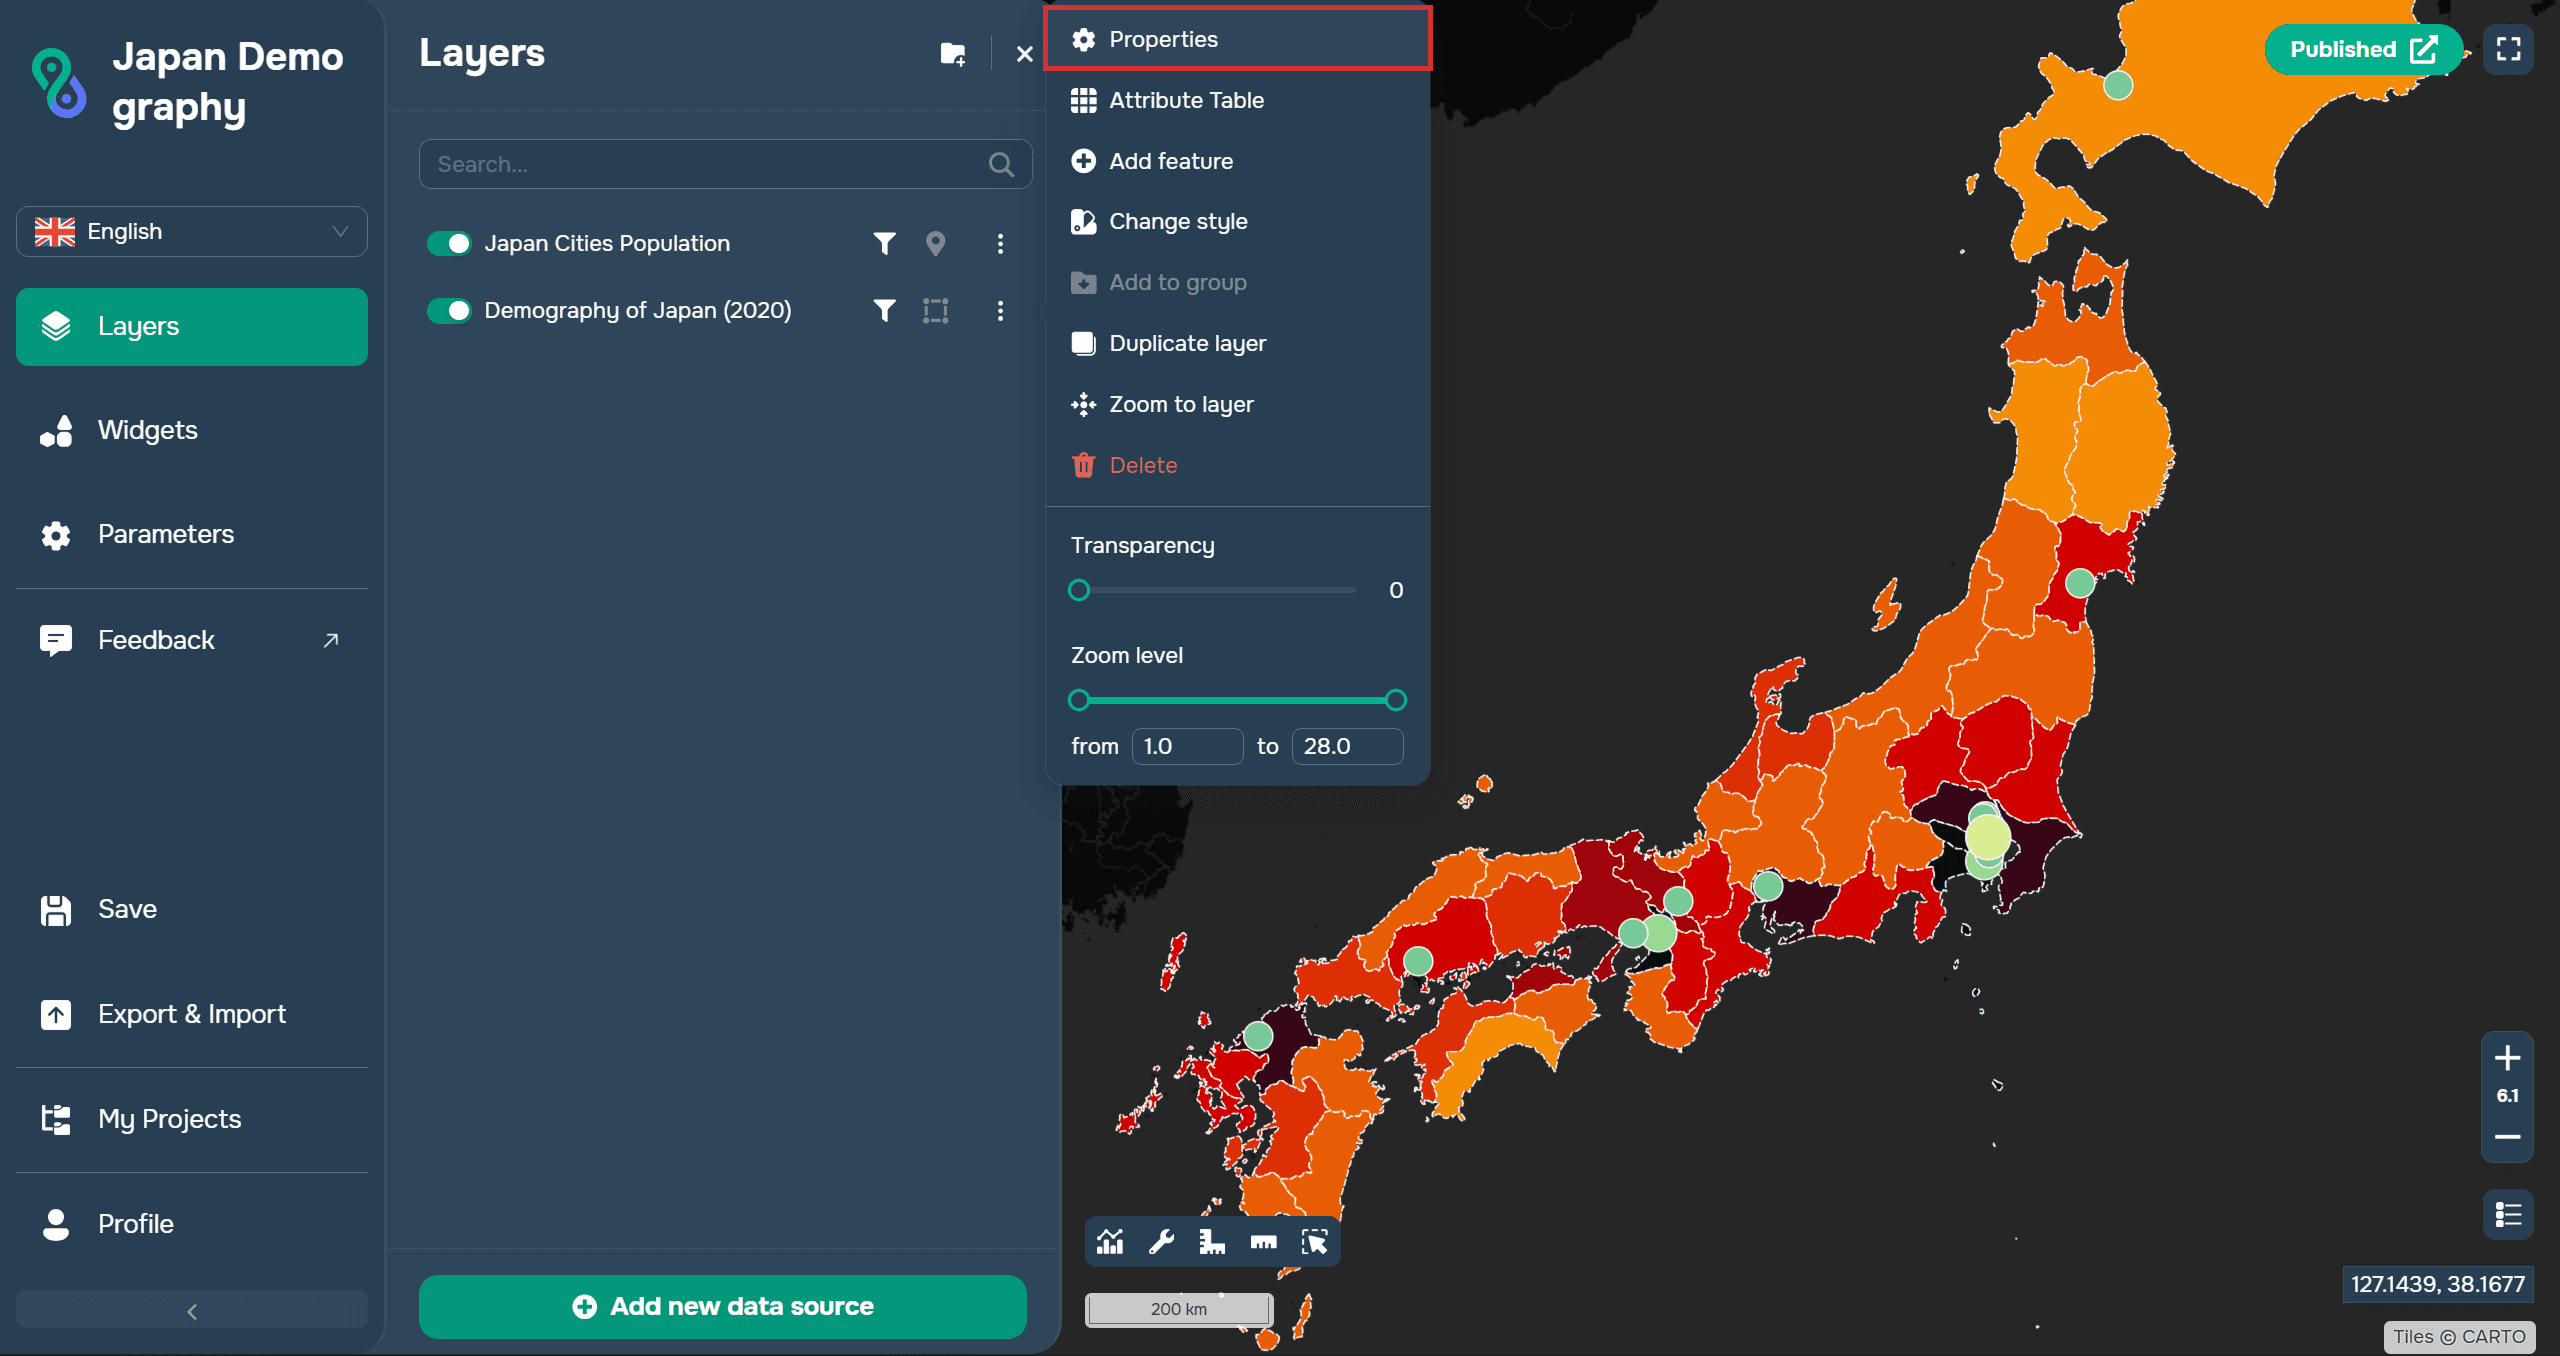
To configure layer filtering, you need to go to the layer properties.
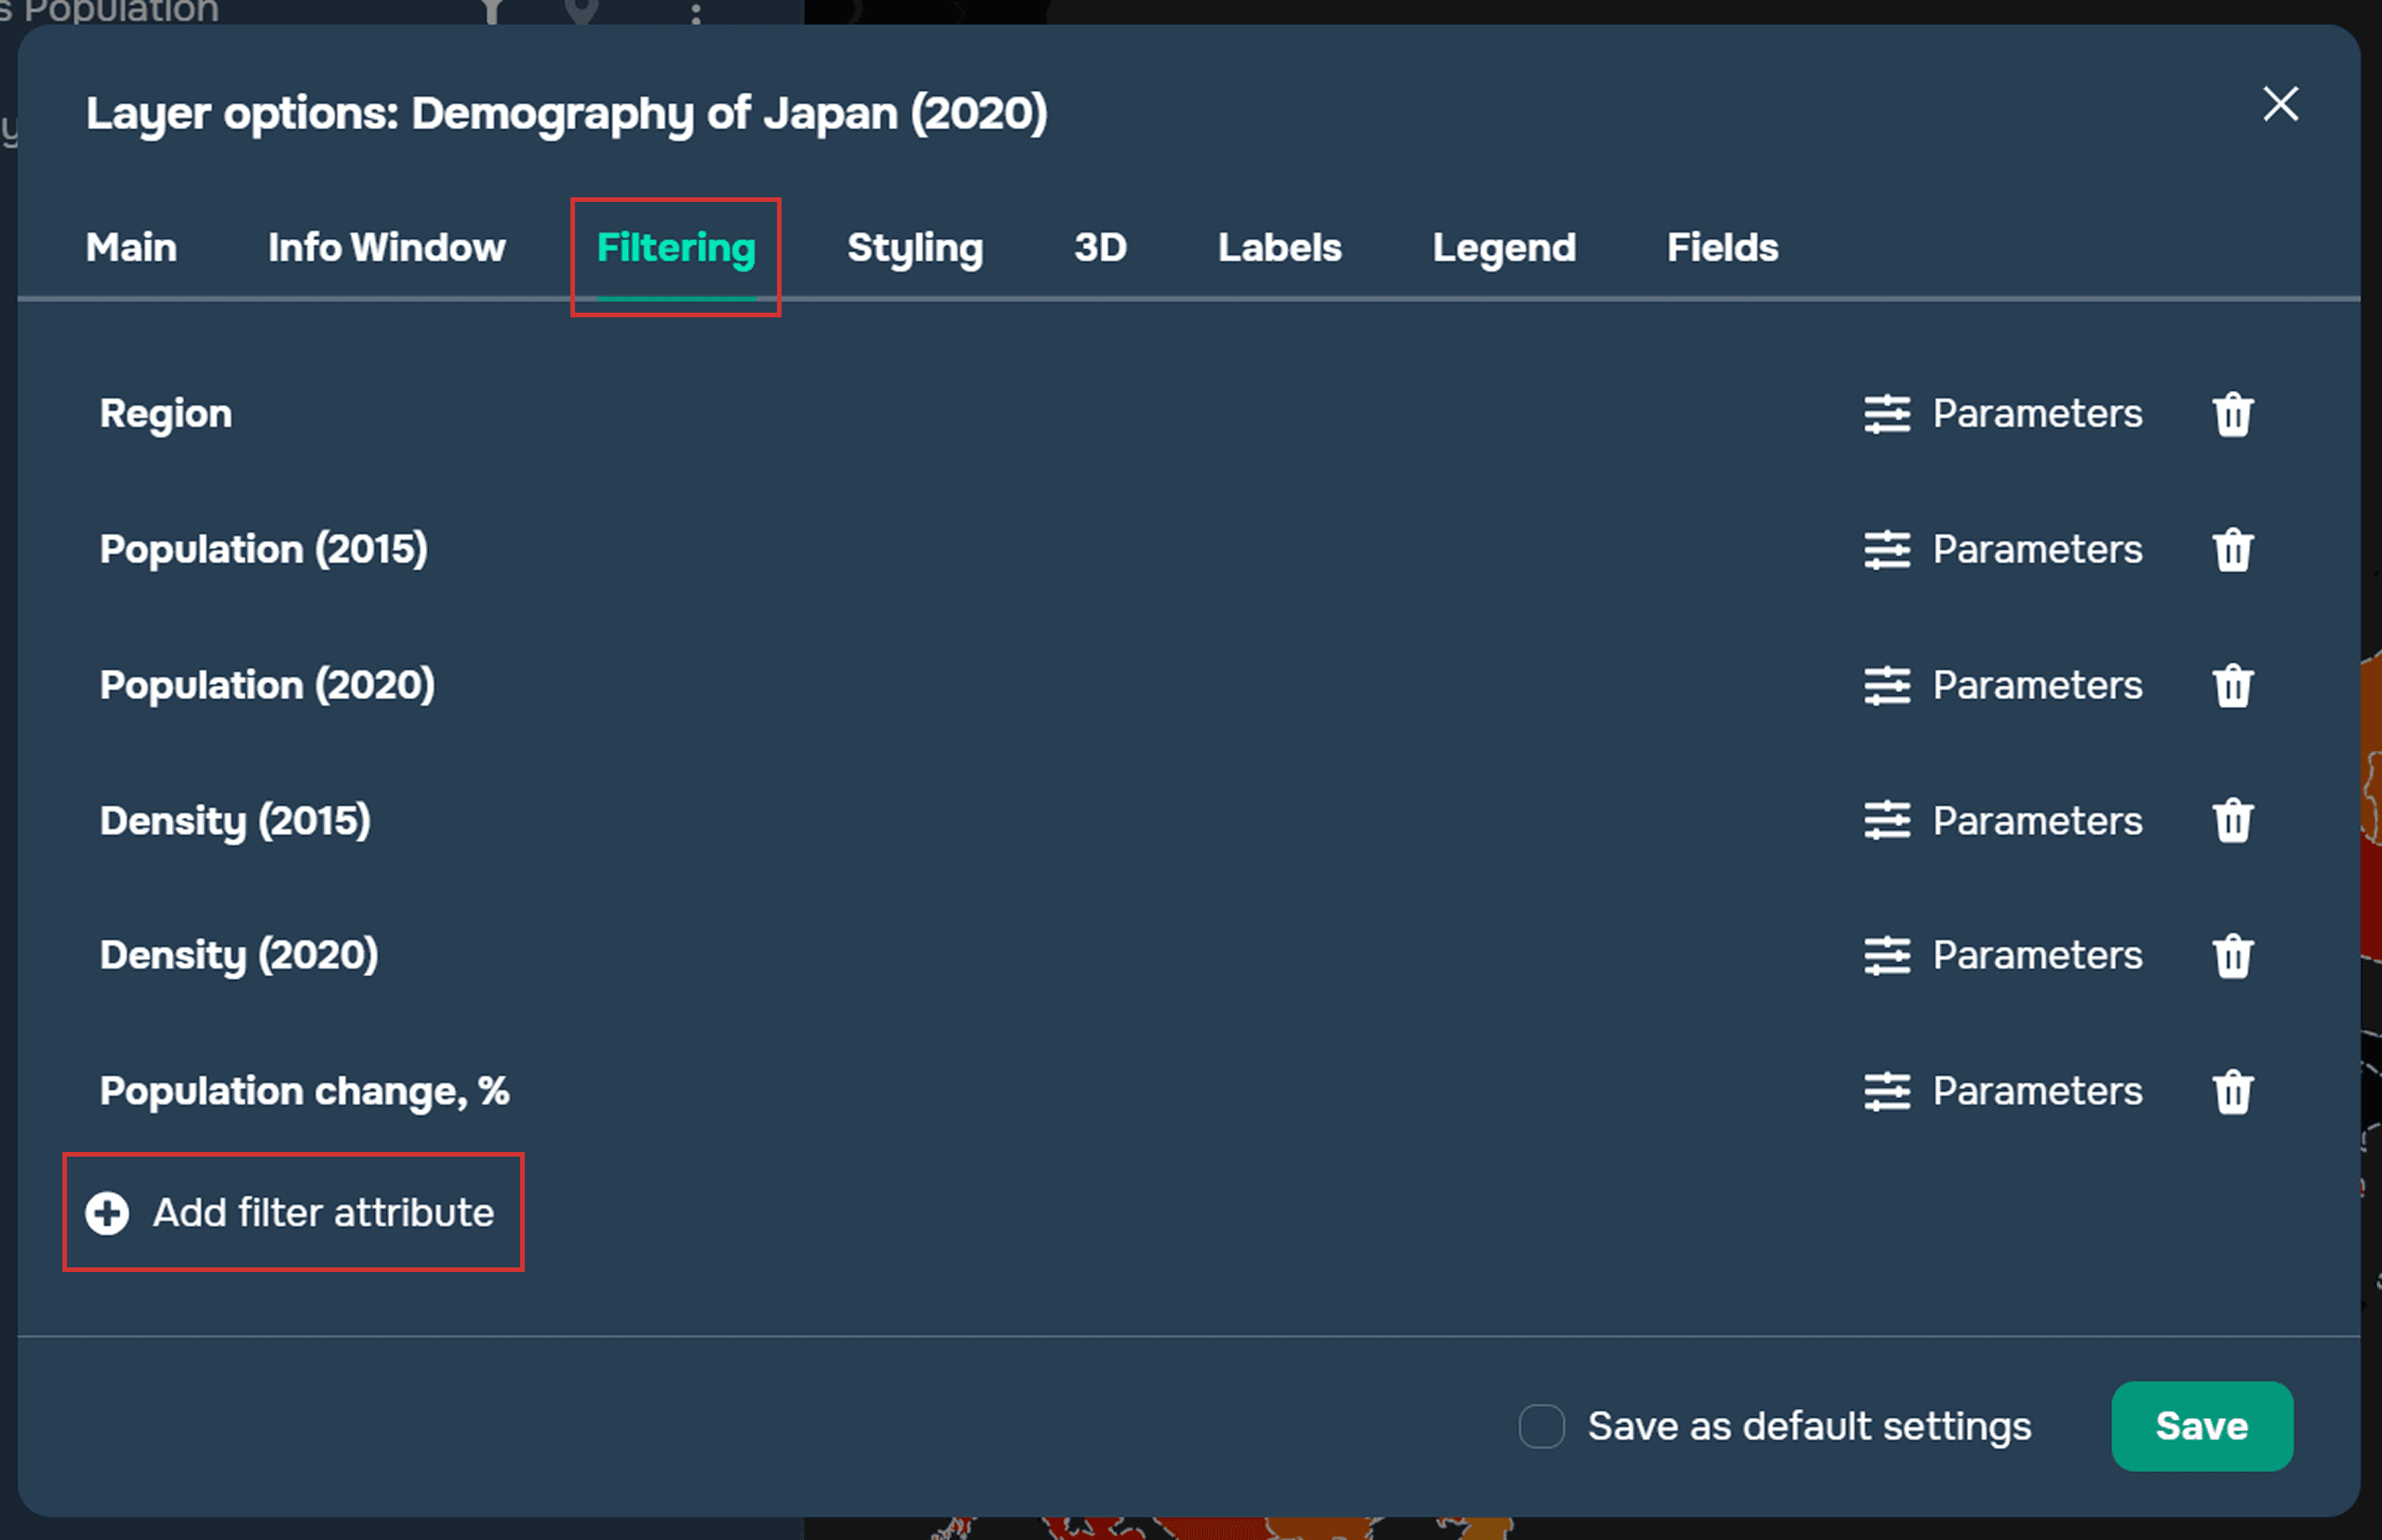
Next, go to the Filtering section and click on the plus Add filter attribute.
Then select the attribute based on which the filtering will be configured.
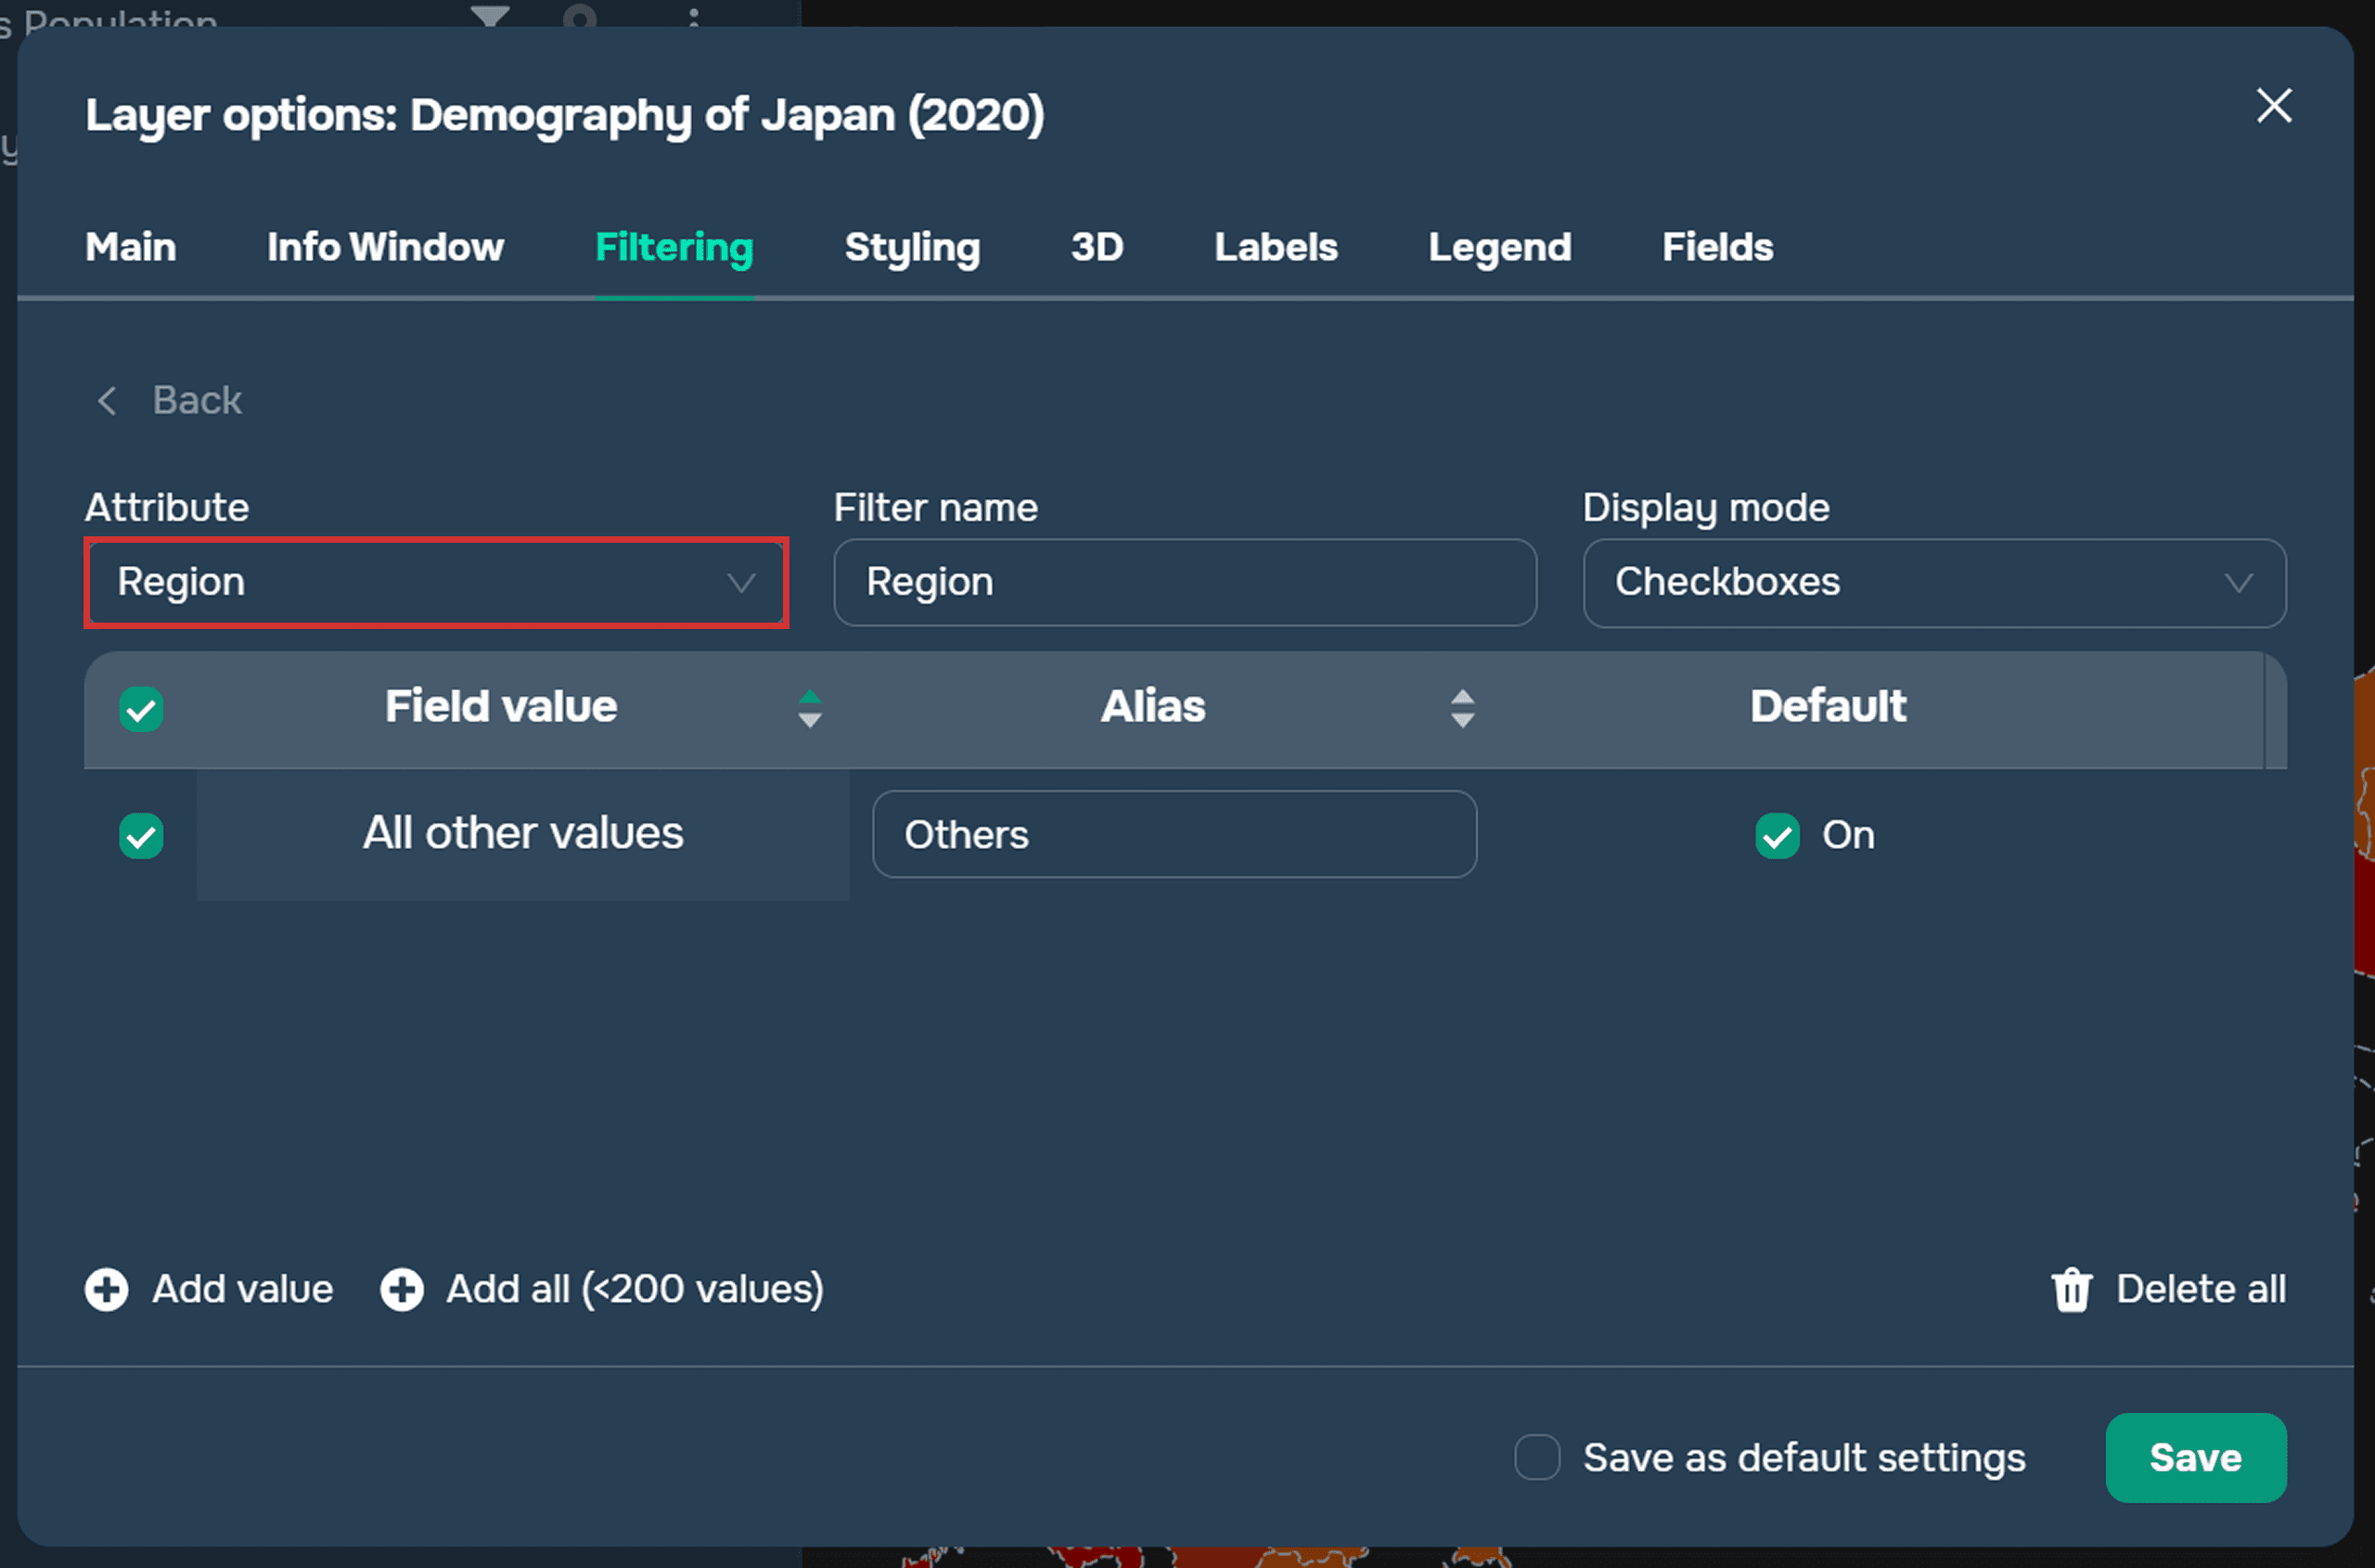
You can then rename the filter name.
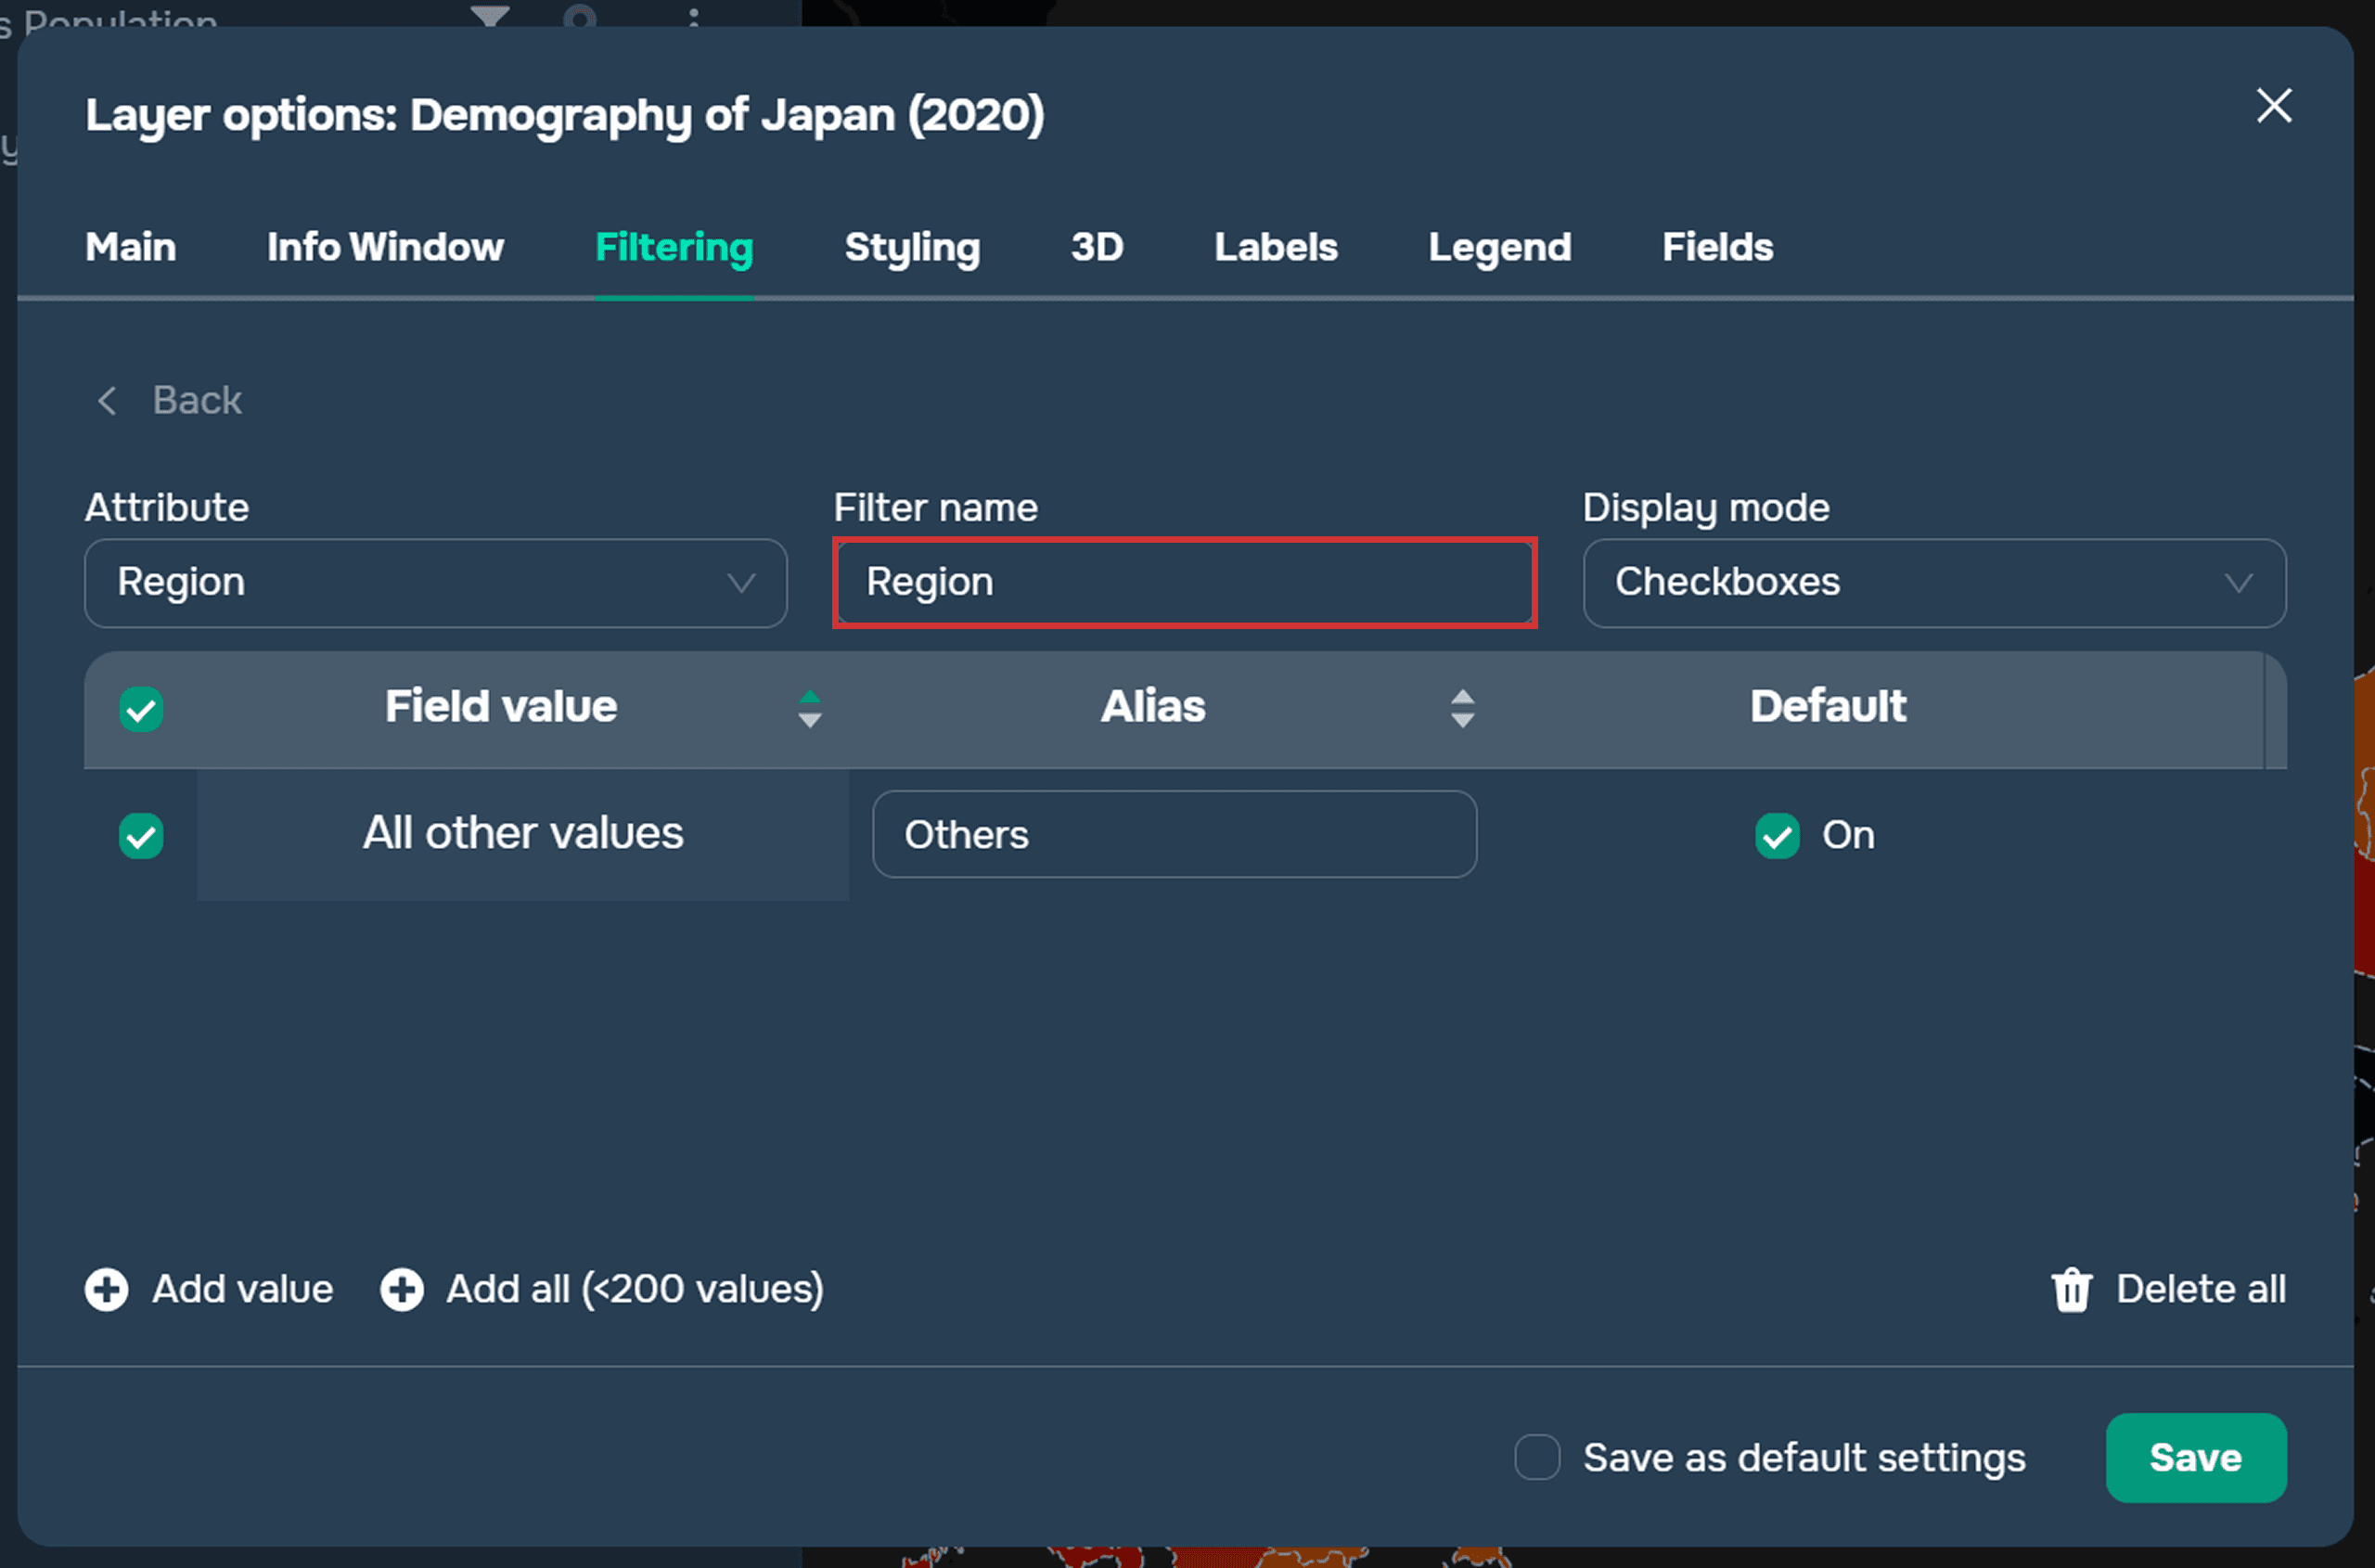
The next step is to configure the Display mode. For numeric values, the following options are available:
Radio buttons
Checkboxes
Range
For text values, only the Radio button and Checkbox.
Display mode – how the layer filter will be displayed. The following options are available:
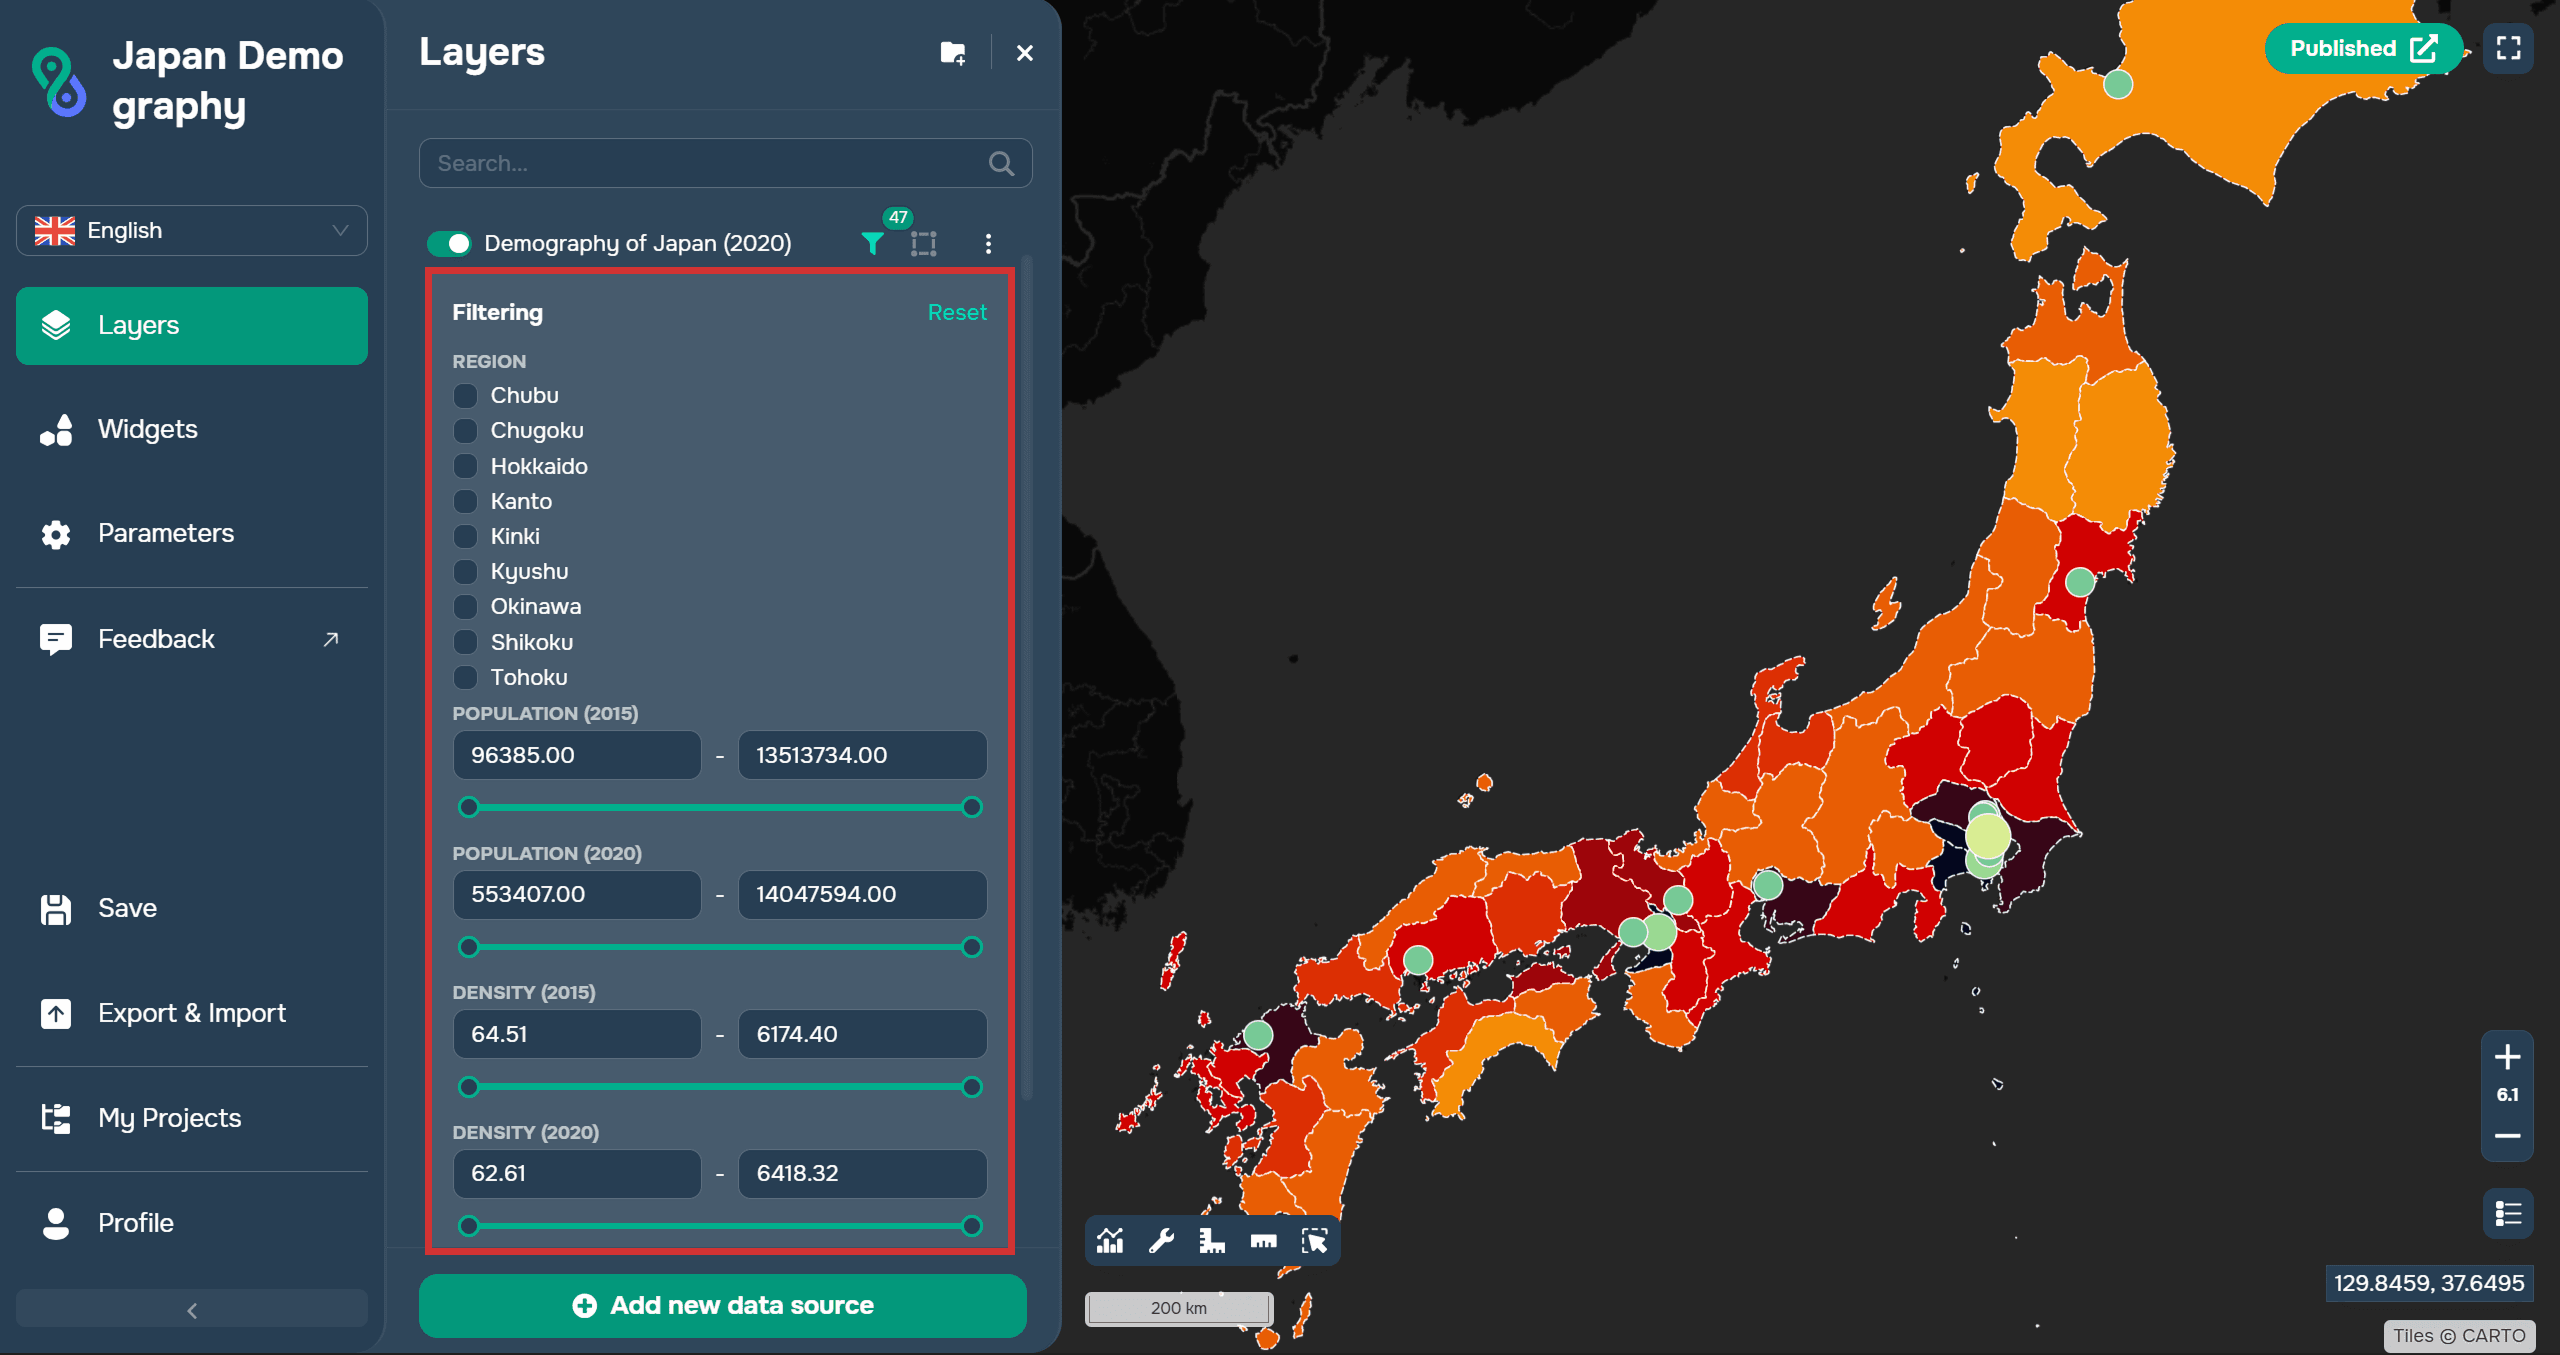
Checkboxes: Elements that allow the user to select one or more options from a list. Checkboxes are displayed as square boxes with a small check mark or tick inside.
Radio buttons: Allow the user to select only one option from a list. They are displayed as small circles, and when one of the options is selected, the circle becomes filled.
Range: An interface element that allows the user to select a value within a specific range. Typically represented as a horizontal scale with a slider that can be moved along the axis. Available only for numeric attributes.

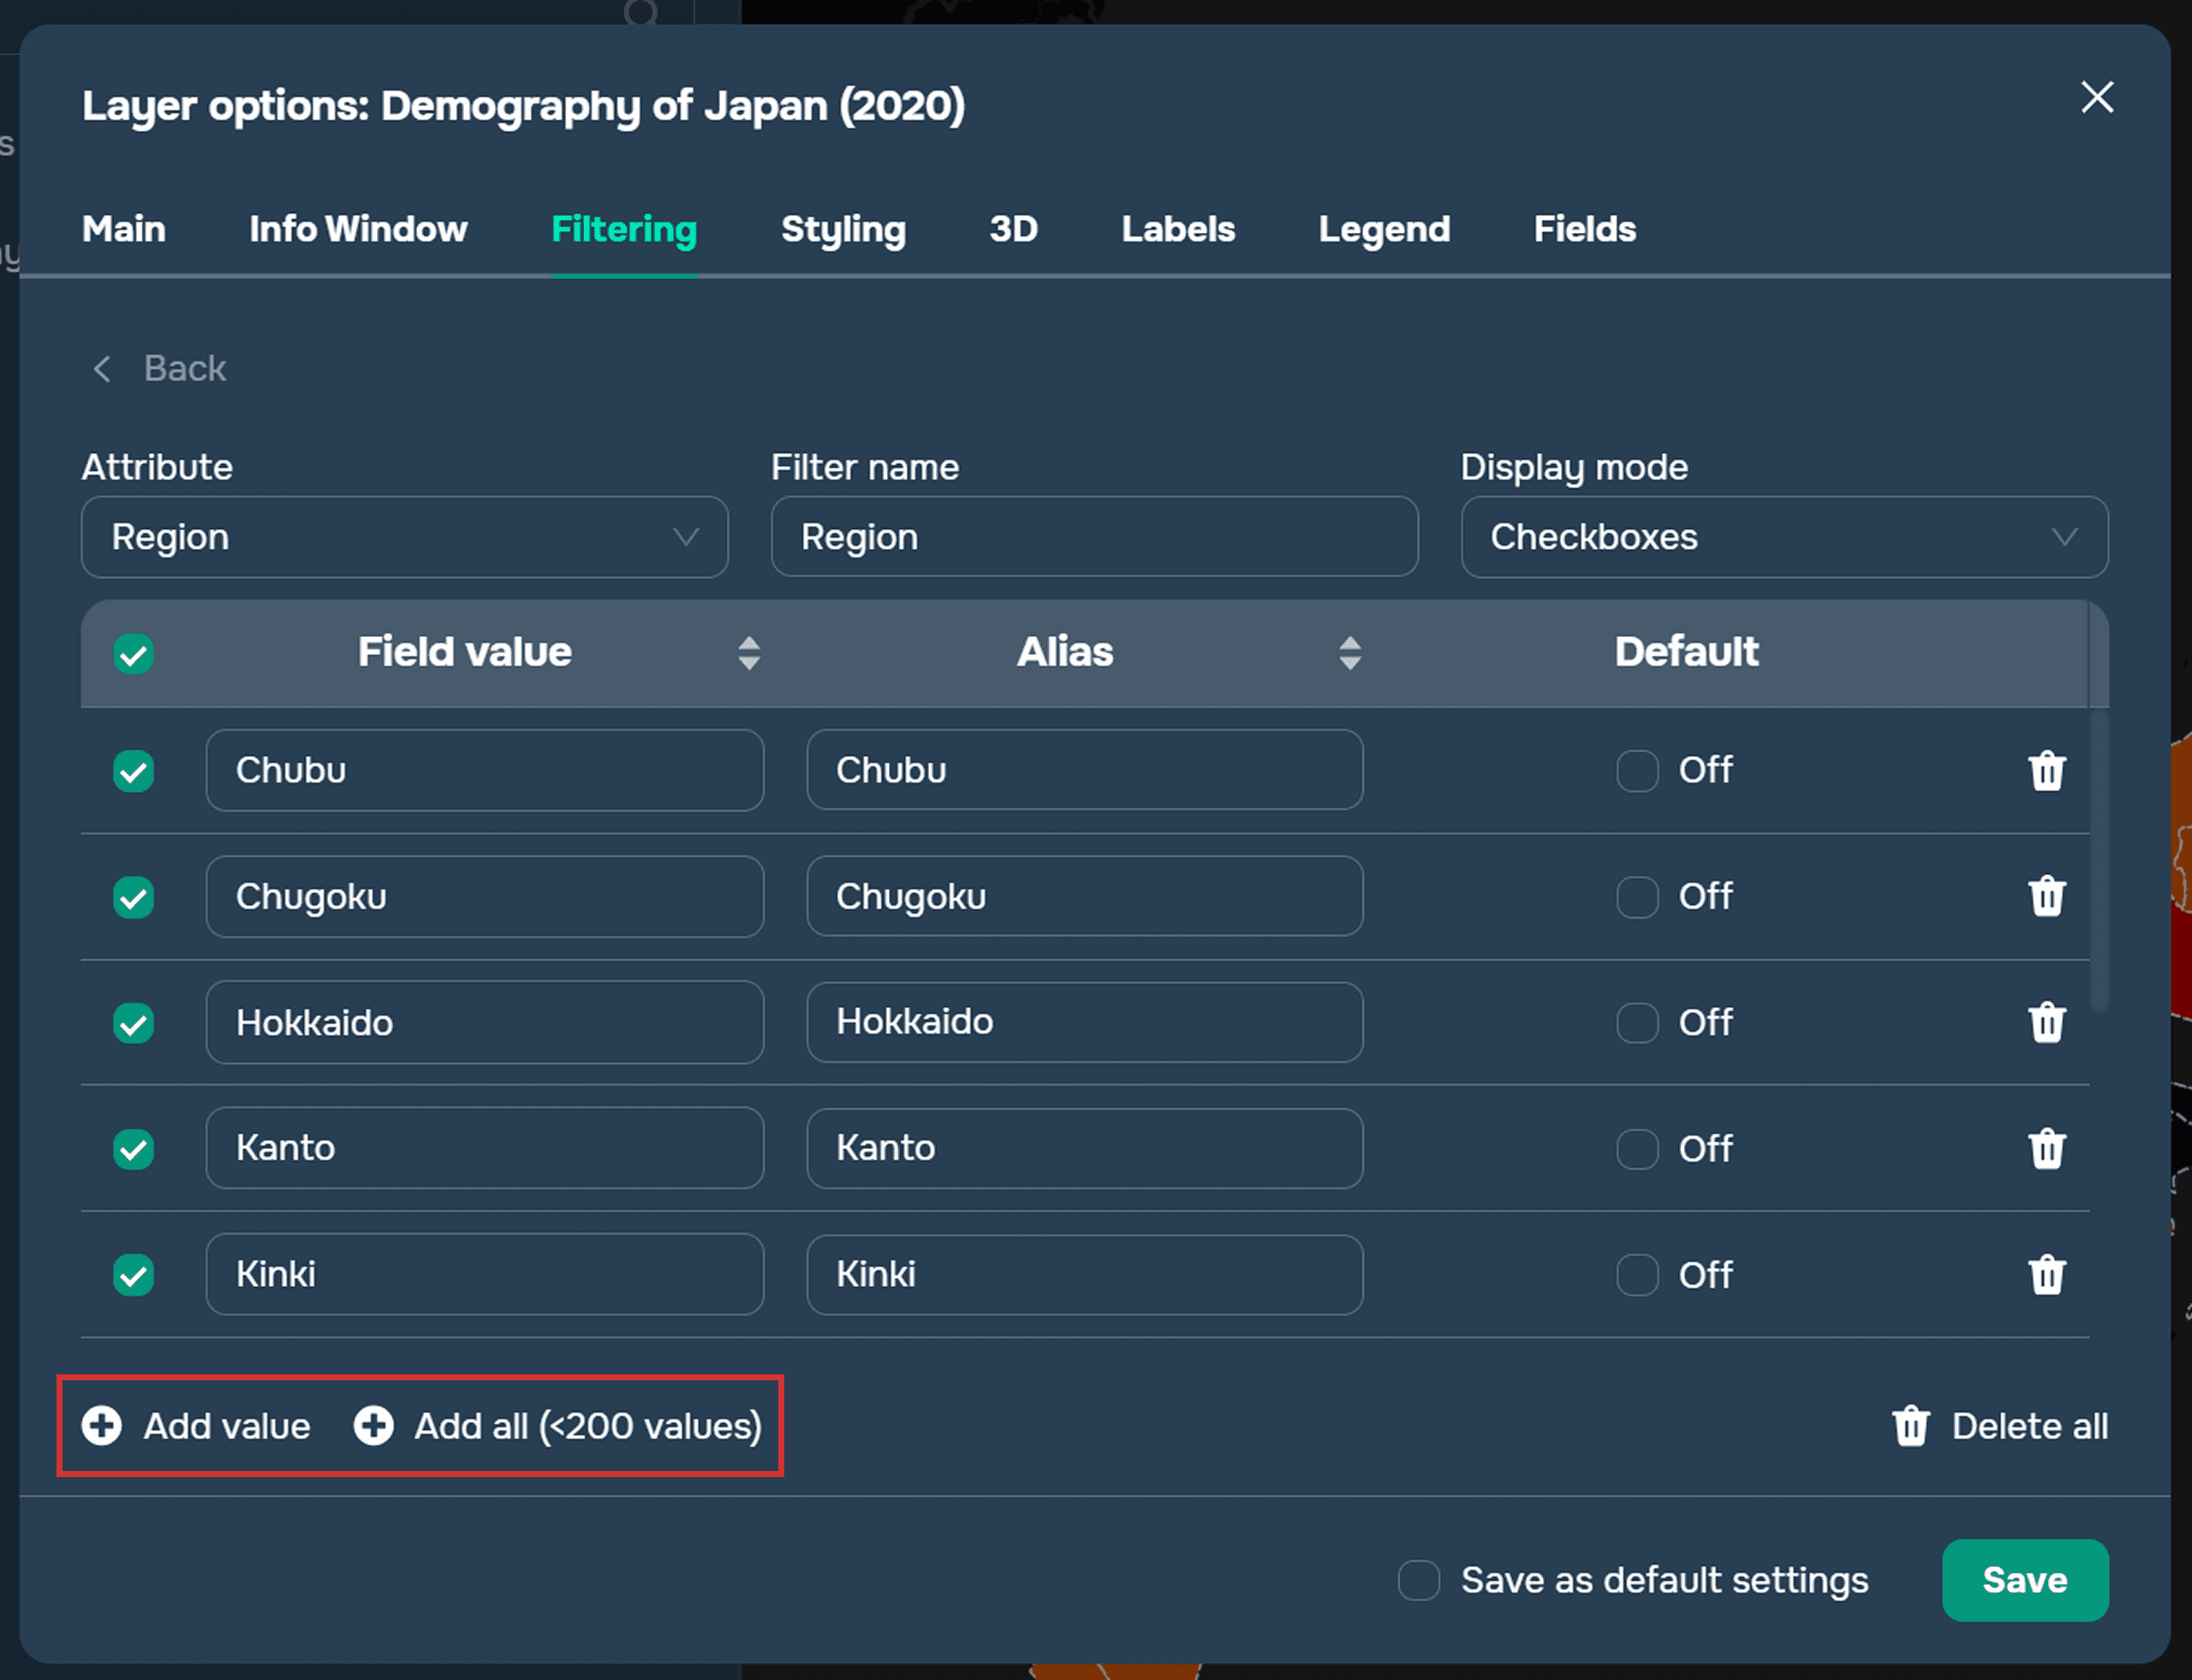
After configuring all elements, you can add values manually using the Add Value button. This method is convenient when you need to select previously defined values.
If you need all values for an attribute, click the Add All button. Please note that there is a limit of 200 values.
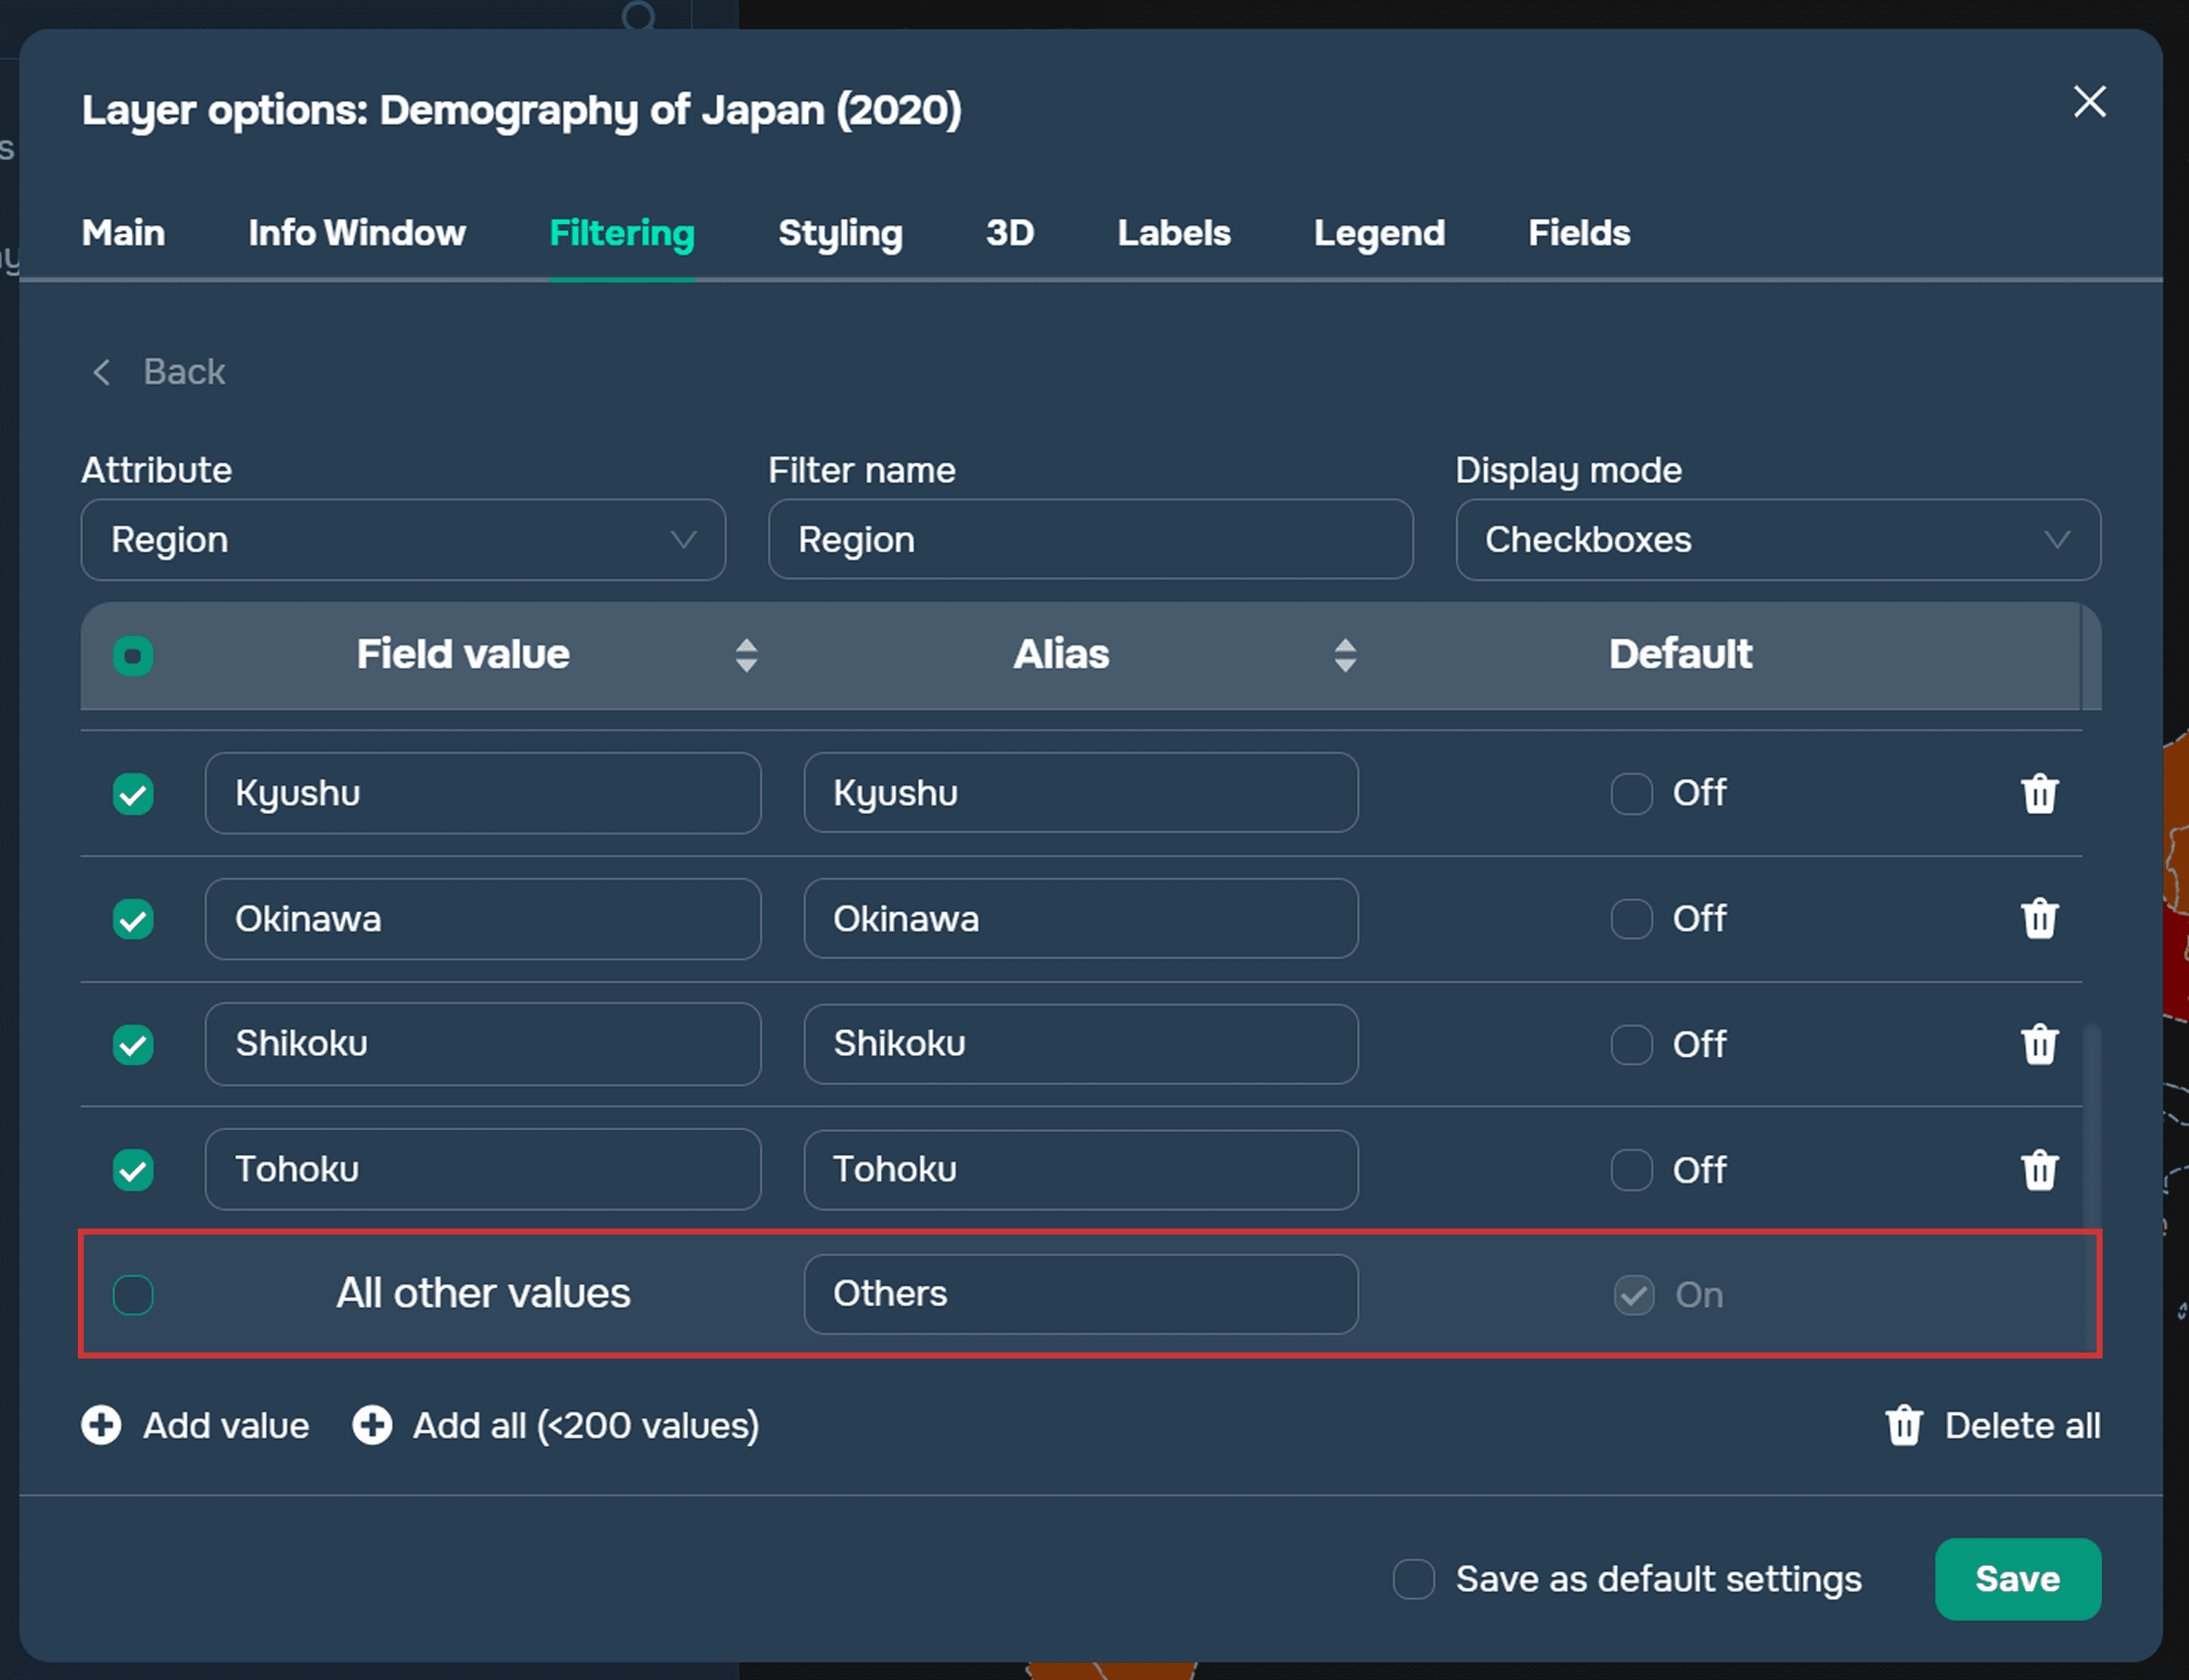
The "All other values" row is automatically added. You can disable it by unchecking the box next to its name in the left column.
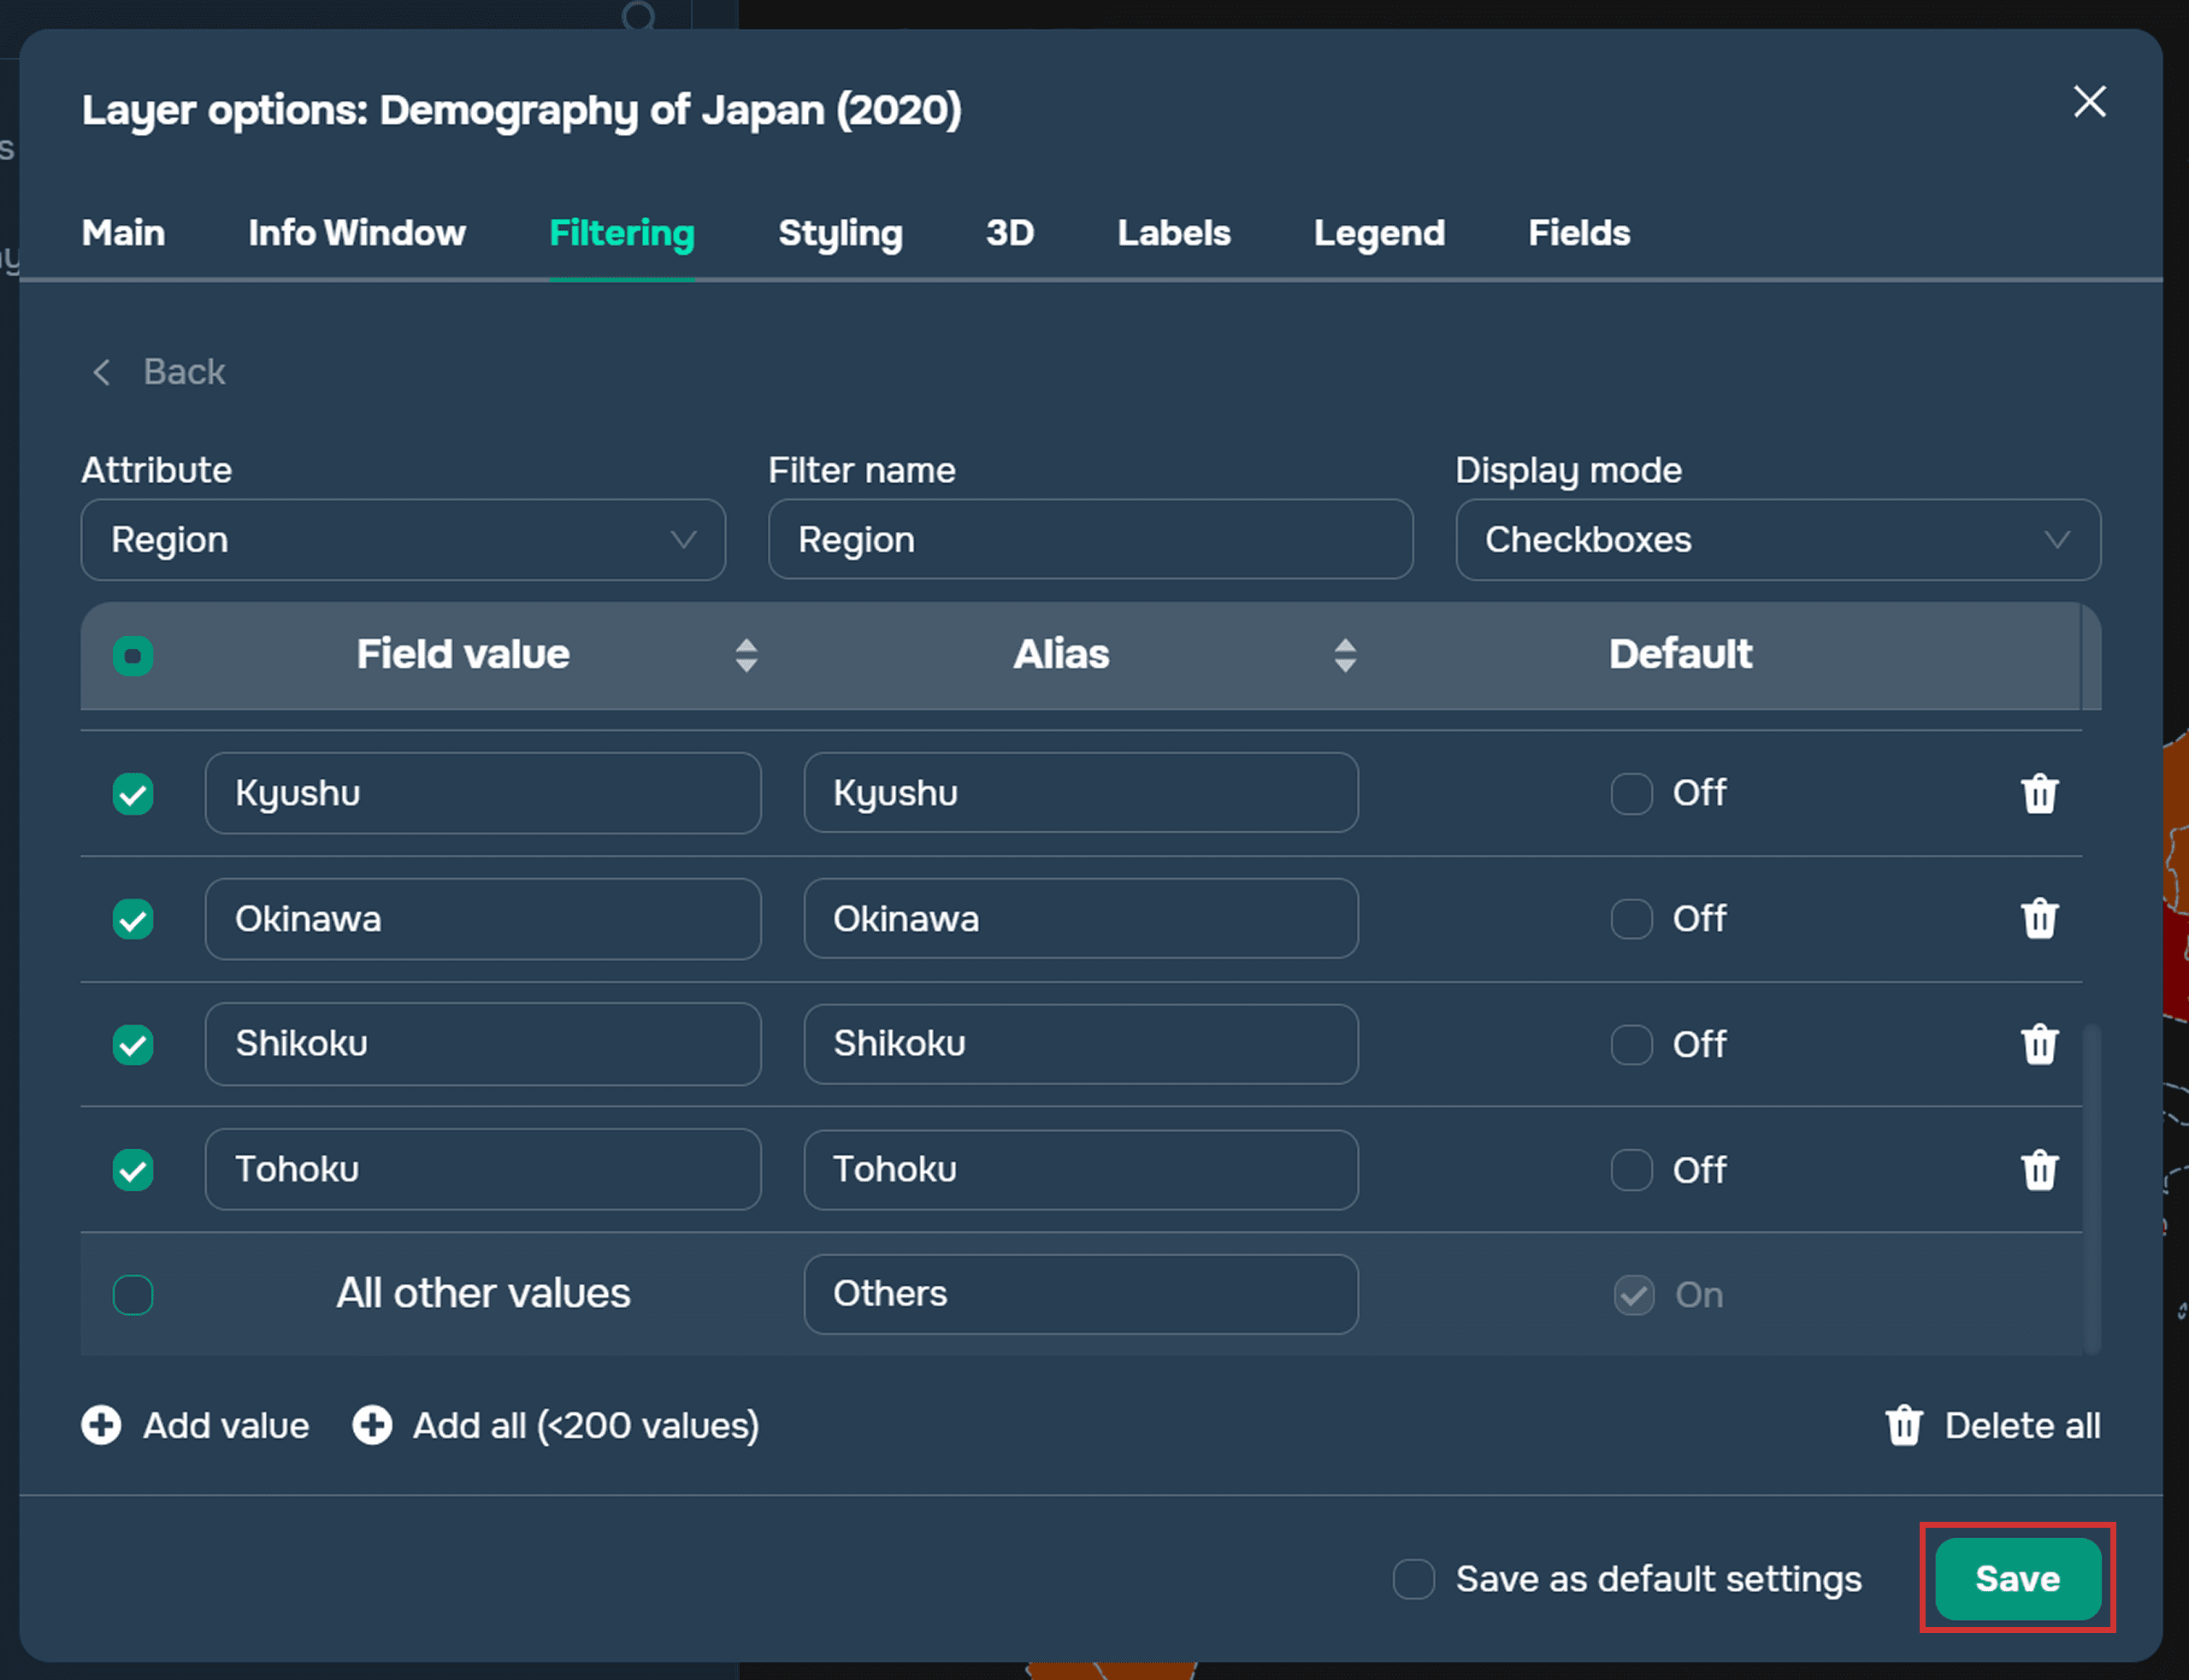
To save the layer filtering parameters, click the Save button.
After this, a funnel icon will appear next to the layer name; clicking on it will enable filtering.
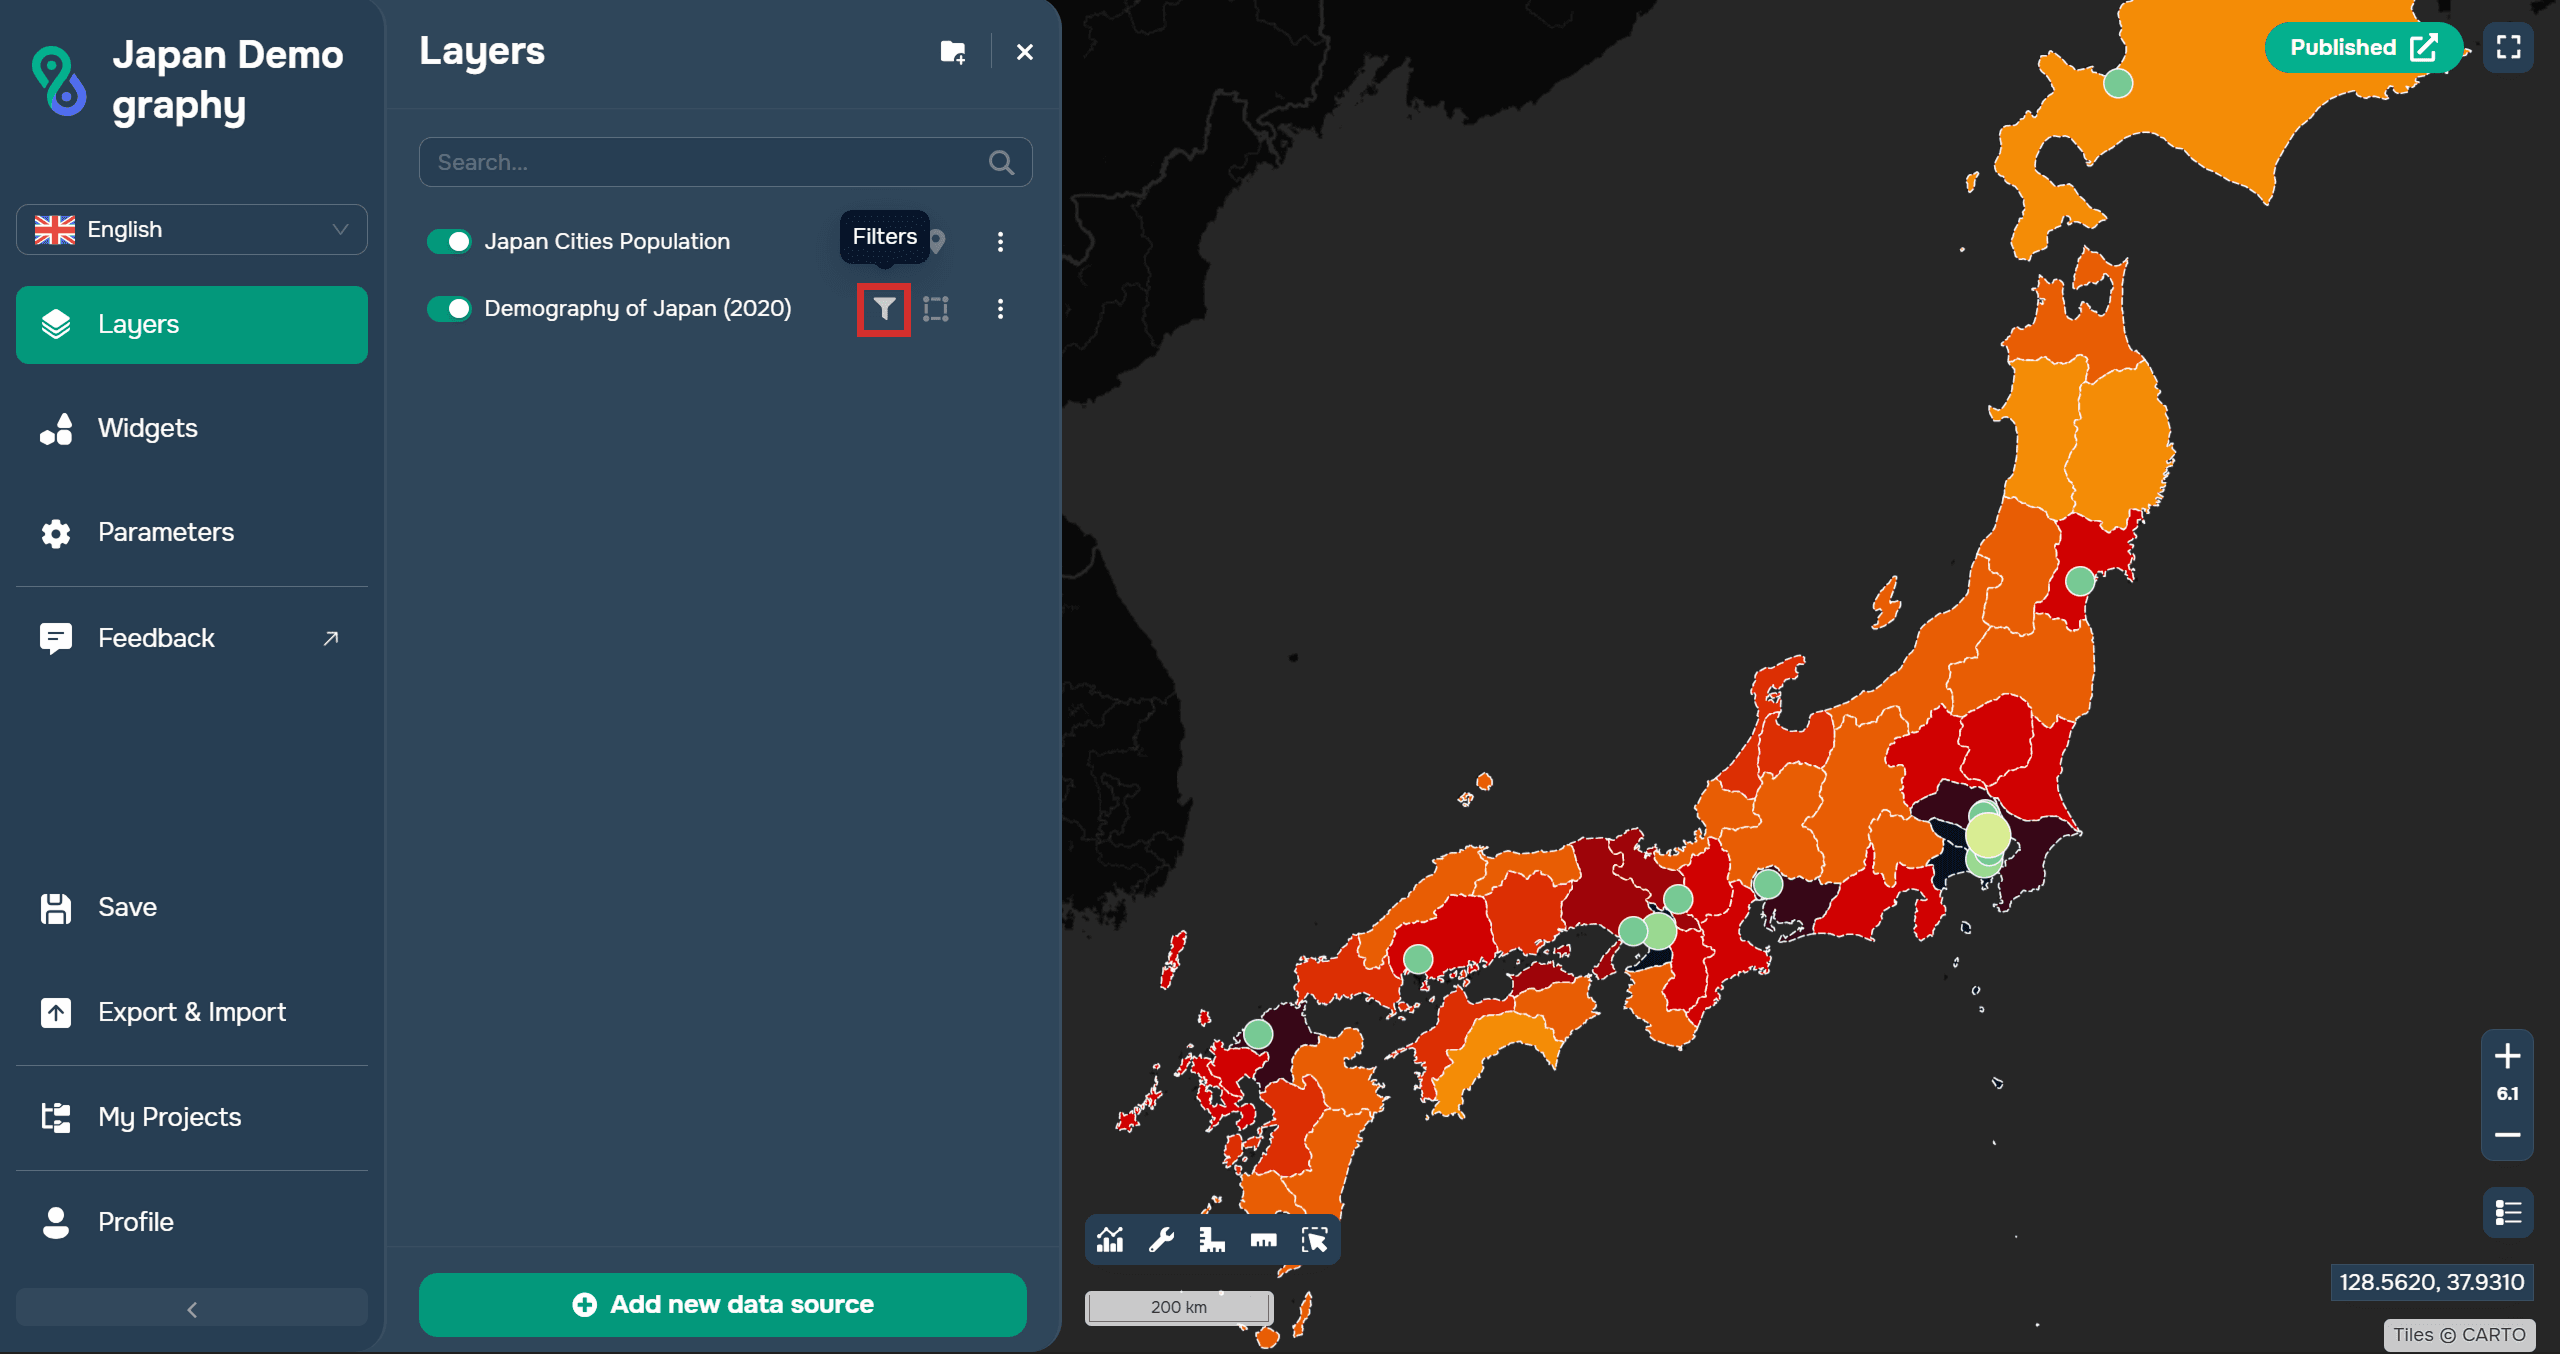
Now you can use layer filtering. It's also worth noting that you can configure multiple filters for a single layer based on different attributes.
When is filtering useful?
Filtering is especially useful when working with large datasets. It helps:
quickly find the desired objects;
analyze individual data categories;
reduce the amount of information on the map;
prepare thematic maps and reports;
simplify project navigation.
For example, if a layer contains information about all utility networks in a city, you can use a filter to filter only the water supply networks or utilities in a specific area.
FAQ
Does filtering change the original data?
No, filters only affect the display of features on the map.
Can I use multiple conditions simultaneously?
Yes, you can combine multiple filter conditions in GISCARTA.
For which layers is filtering available?
Filtering applies to vector layers and their attribute data.
Key Takeaways
Filtering allows you to quickly find the features you need on the map.
In GISCARTA, you can create simple and complex filter conditions.
A filter hides unnecessary features without changing the original data.