Elevation data is one of the fundamental layers in geographic information systems. Surface elevation influences how water flows, where roads and buildings are built, and how the environment is structured. Without taking elevation into account, many types of analysis can be inaccurate. Therefore, digital elevation models are used in almost every GIS project.
What is a DEM
A DEM (Digital Elevation Model) is a digital elevation model represented as a raster grid. Each cell in this raster contains an elevation value, measured in meters above sea level.
A DEM describes a surface as a continuous field of values, making it convenient for analyzing natural processes. Unlike vector data, it does not contain individual objects—only the entire surface and its characteristics.
Types of Elevation Models
Although the term DEM is often used generically, in practice there are several types of models that are important to distinguish.
DEM (Digital Elevation Model): a general concept that can include different types of elevation data.
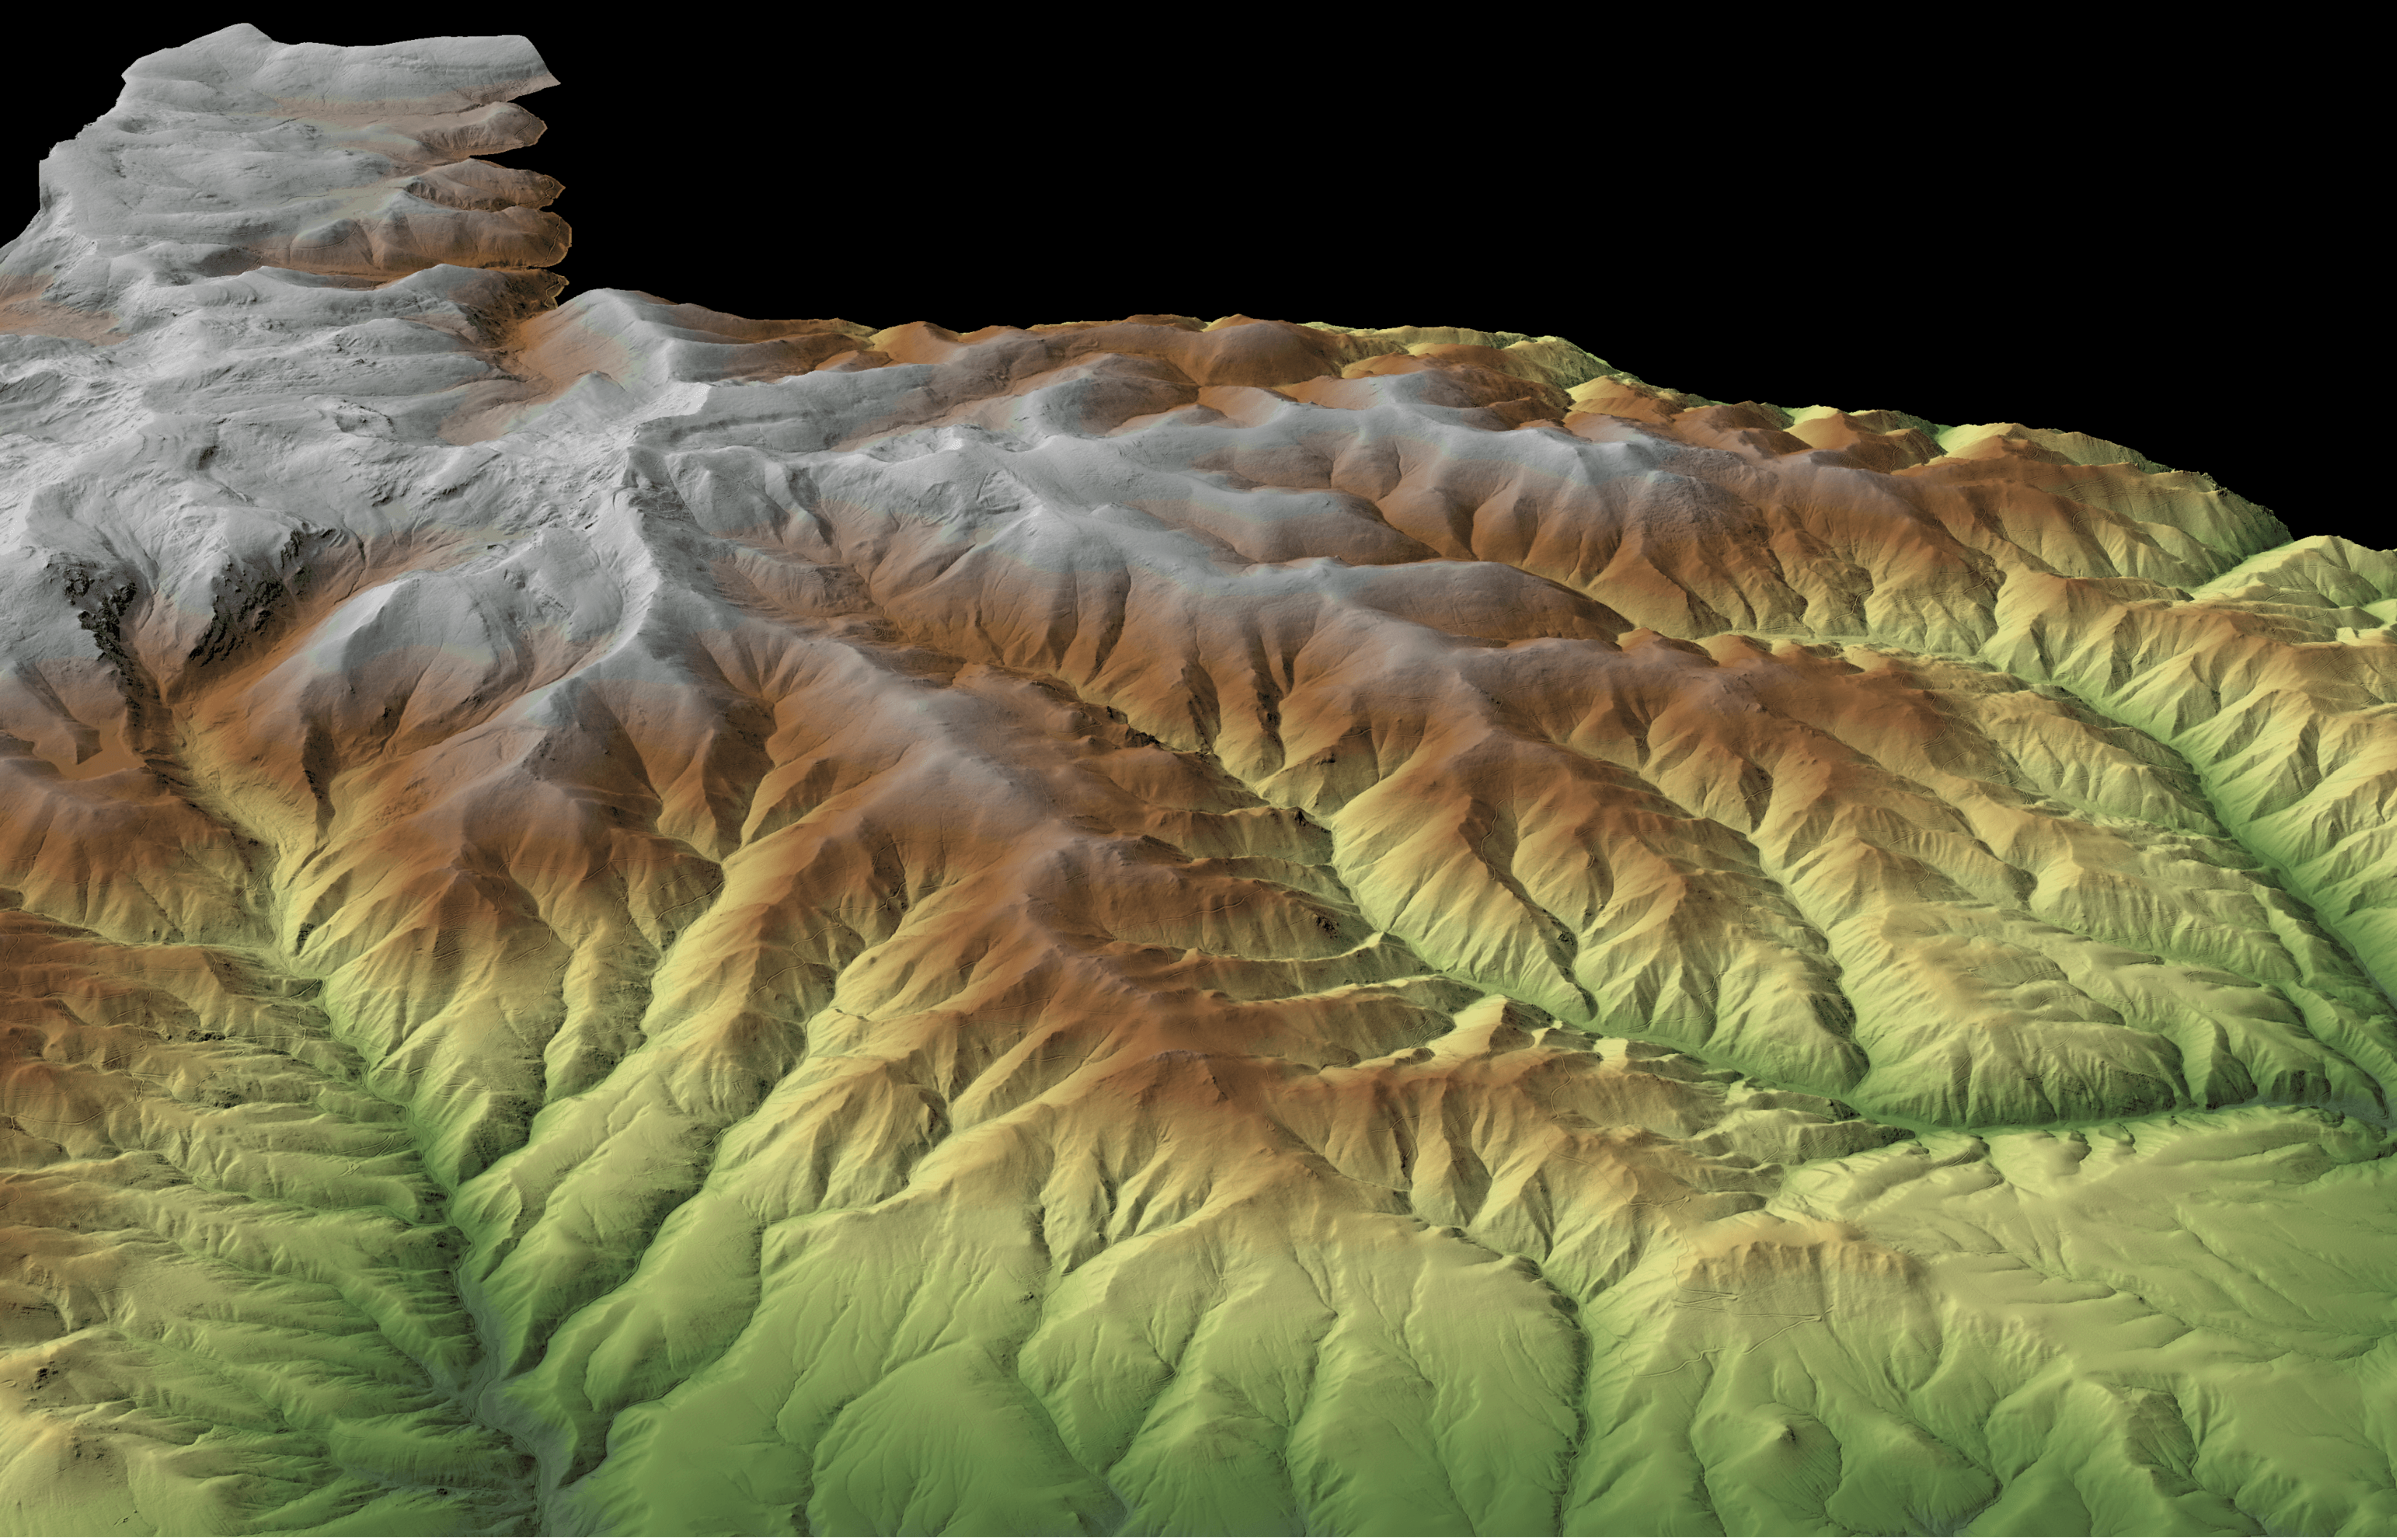
A Digital Elevation Model (DEM) of a section of Bitterroot National Forest. Source:
USGS
DSM (Digital Surface Model): a surface model that takes into account everything on the ground, such as buildings, trees, and infrastructure. This type of data is used, for example, in analyzing urban environments or radio signals.
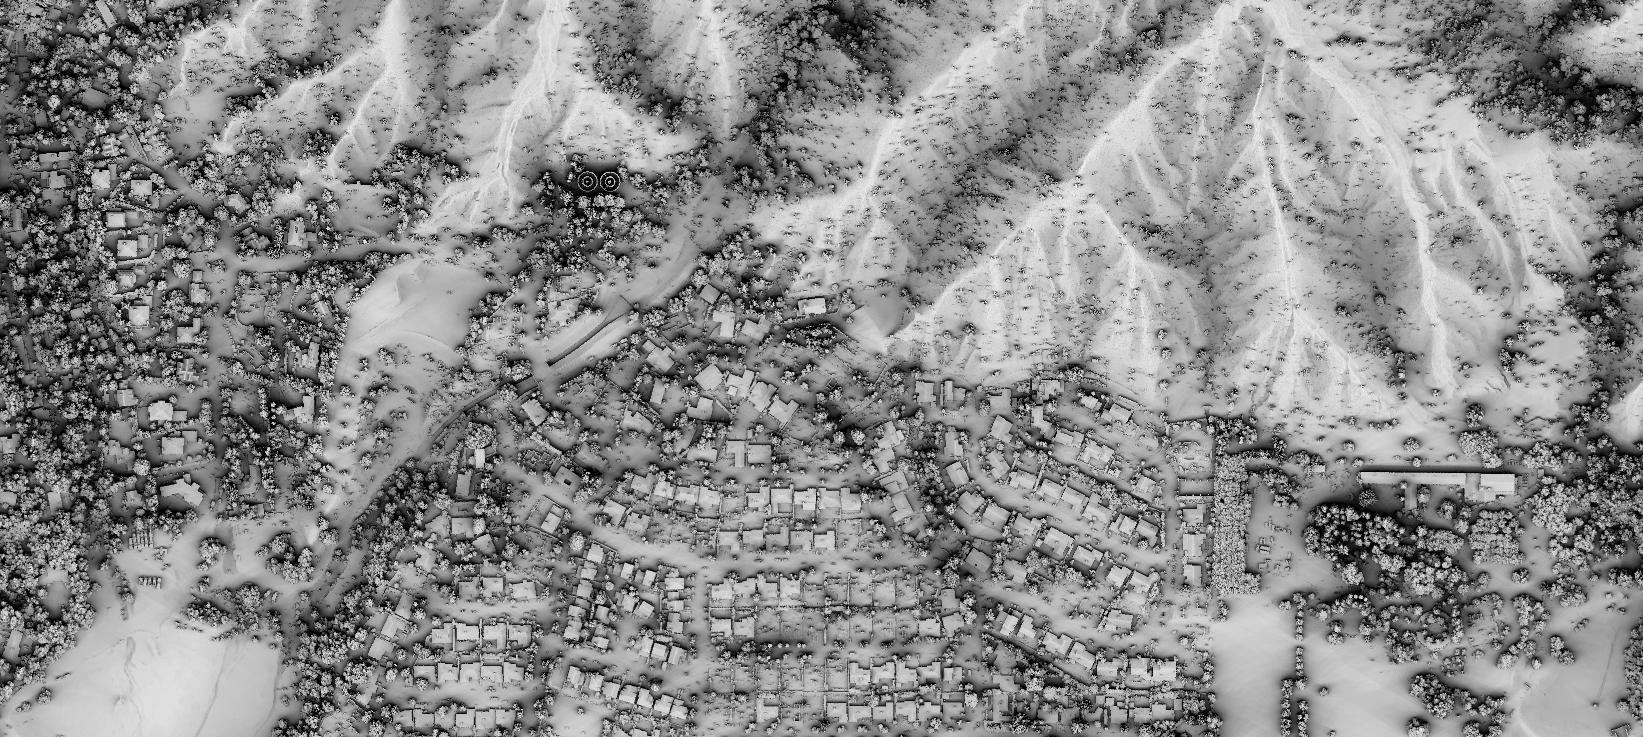
A modified hillshade rendering from lidar-derived DSM data over par of the Eaton Fire. Source:
USGS
DTM (Digital Terrain Model): a "cleaned" terrain model that retains only the ground surface without any objects. It is most often used in hydrology and engineering.
Understanding the difference between these models is important, as the choice affects the analysis results.
Data Sources
There are several popular open-source DEMs used in GIS.
SRTM
One of the most common datasets, with a resolution of approximately 30 meters. Suitable for most basic tasks.
Copernicus DEM
A more modern and accurate dataset, available for global coverage.
ASTER GDEM
An alternative DEM source that can be used depending on the region.
ALOS
A digital surface model with a pixel size of 30 meters in the free version and 5 meters in the paid version (which became the basis for the less accurate free version).
FABDEM
A global digital elevation model (DTM) with a 30-meter pixel size. Available for areas between 60° south and 80° north latitude. Currently, it's the only free global DTM.
NASA EarthData
A portal providing access to various datasets, including elevation models.
REMA
A digital surface model for Antarctica only, but with a pixel size of up to 2 m, and the vertical error of some pixels may be less than 1 m.
Arctic DEM
A digital surface model is available for the Arctic region only, with a pixel resolution of up to 2 meters.
The choice of source depends on the required accuracy and scale of analysis. More detailed information about the relief data can be found here.
Resolution and Accuracy
One of the key parameters of a DEM is spatial resolution. It determines the raster cell size.
For example:
30 m: high detail
1 km: generalized model
The higher the resolution, the more accurate the model, but the larger the data volume and the more complex the processing. For local projects, it is important to use the most detailed data, while for global analyses, a coarser resolution is sufficient.
How DEMs are Used
Digital elevation models are used in a variety of applications.
In terrain analysis, a DEM allows for the calculation of slope and aspect, which are important for assessing terrain conditions. In hydrology, DEM is used to model water runoff, identify catchment areas, and analyze flood risk.
In urban studies, elevation data helps account for terrain features during construction and infrastructure planning.
In ecology, DEM is used to analyze habitats and the distribution of natural processes.
Analysis Methods
DEMs are used to perform many operations. One of the most common is hillshading – a lighting-based relief visualization that makes the map more visually appealing.
Also frequently used are:
contouring
slope calculation
raster surface analysis
These methods transform raw data into understandable and useful results.
Application Examples
DEMs are widely used in real-world applications. For example, in flood modeling, they help identify areas susceptible to flooding. In mountainous regions, they are used to assess landslide risk. In road design, DEMs allow for the consideration of elevation changes and the selection of optimal routes.
Trends
Technological advances are leading to the development of more accurate elevation models. LiDAR data, which enables the production of DEMs with very high resolution, is playing an increasingly important role. Real-time data processing and integration with other sources are also developing.
FAQ
What is the difference between a DEM and a DSM?
A DSM includes surface features, while a DEM/DTM describes only the terrain.
Where can I get DEM data?
There are many open sources, such as SRTM and Copernicus.
Which resolution should I choose?
This depends on the scale of the project and the required accuracy.
Key Takeaways
A DEM is the basis for analyzing terrain and natural processes.
Resolution directly impacts the accuracy and detail of the analysis.
The choice of model type (DEM, DSM, or DTM) is critical for accurate results.