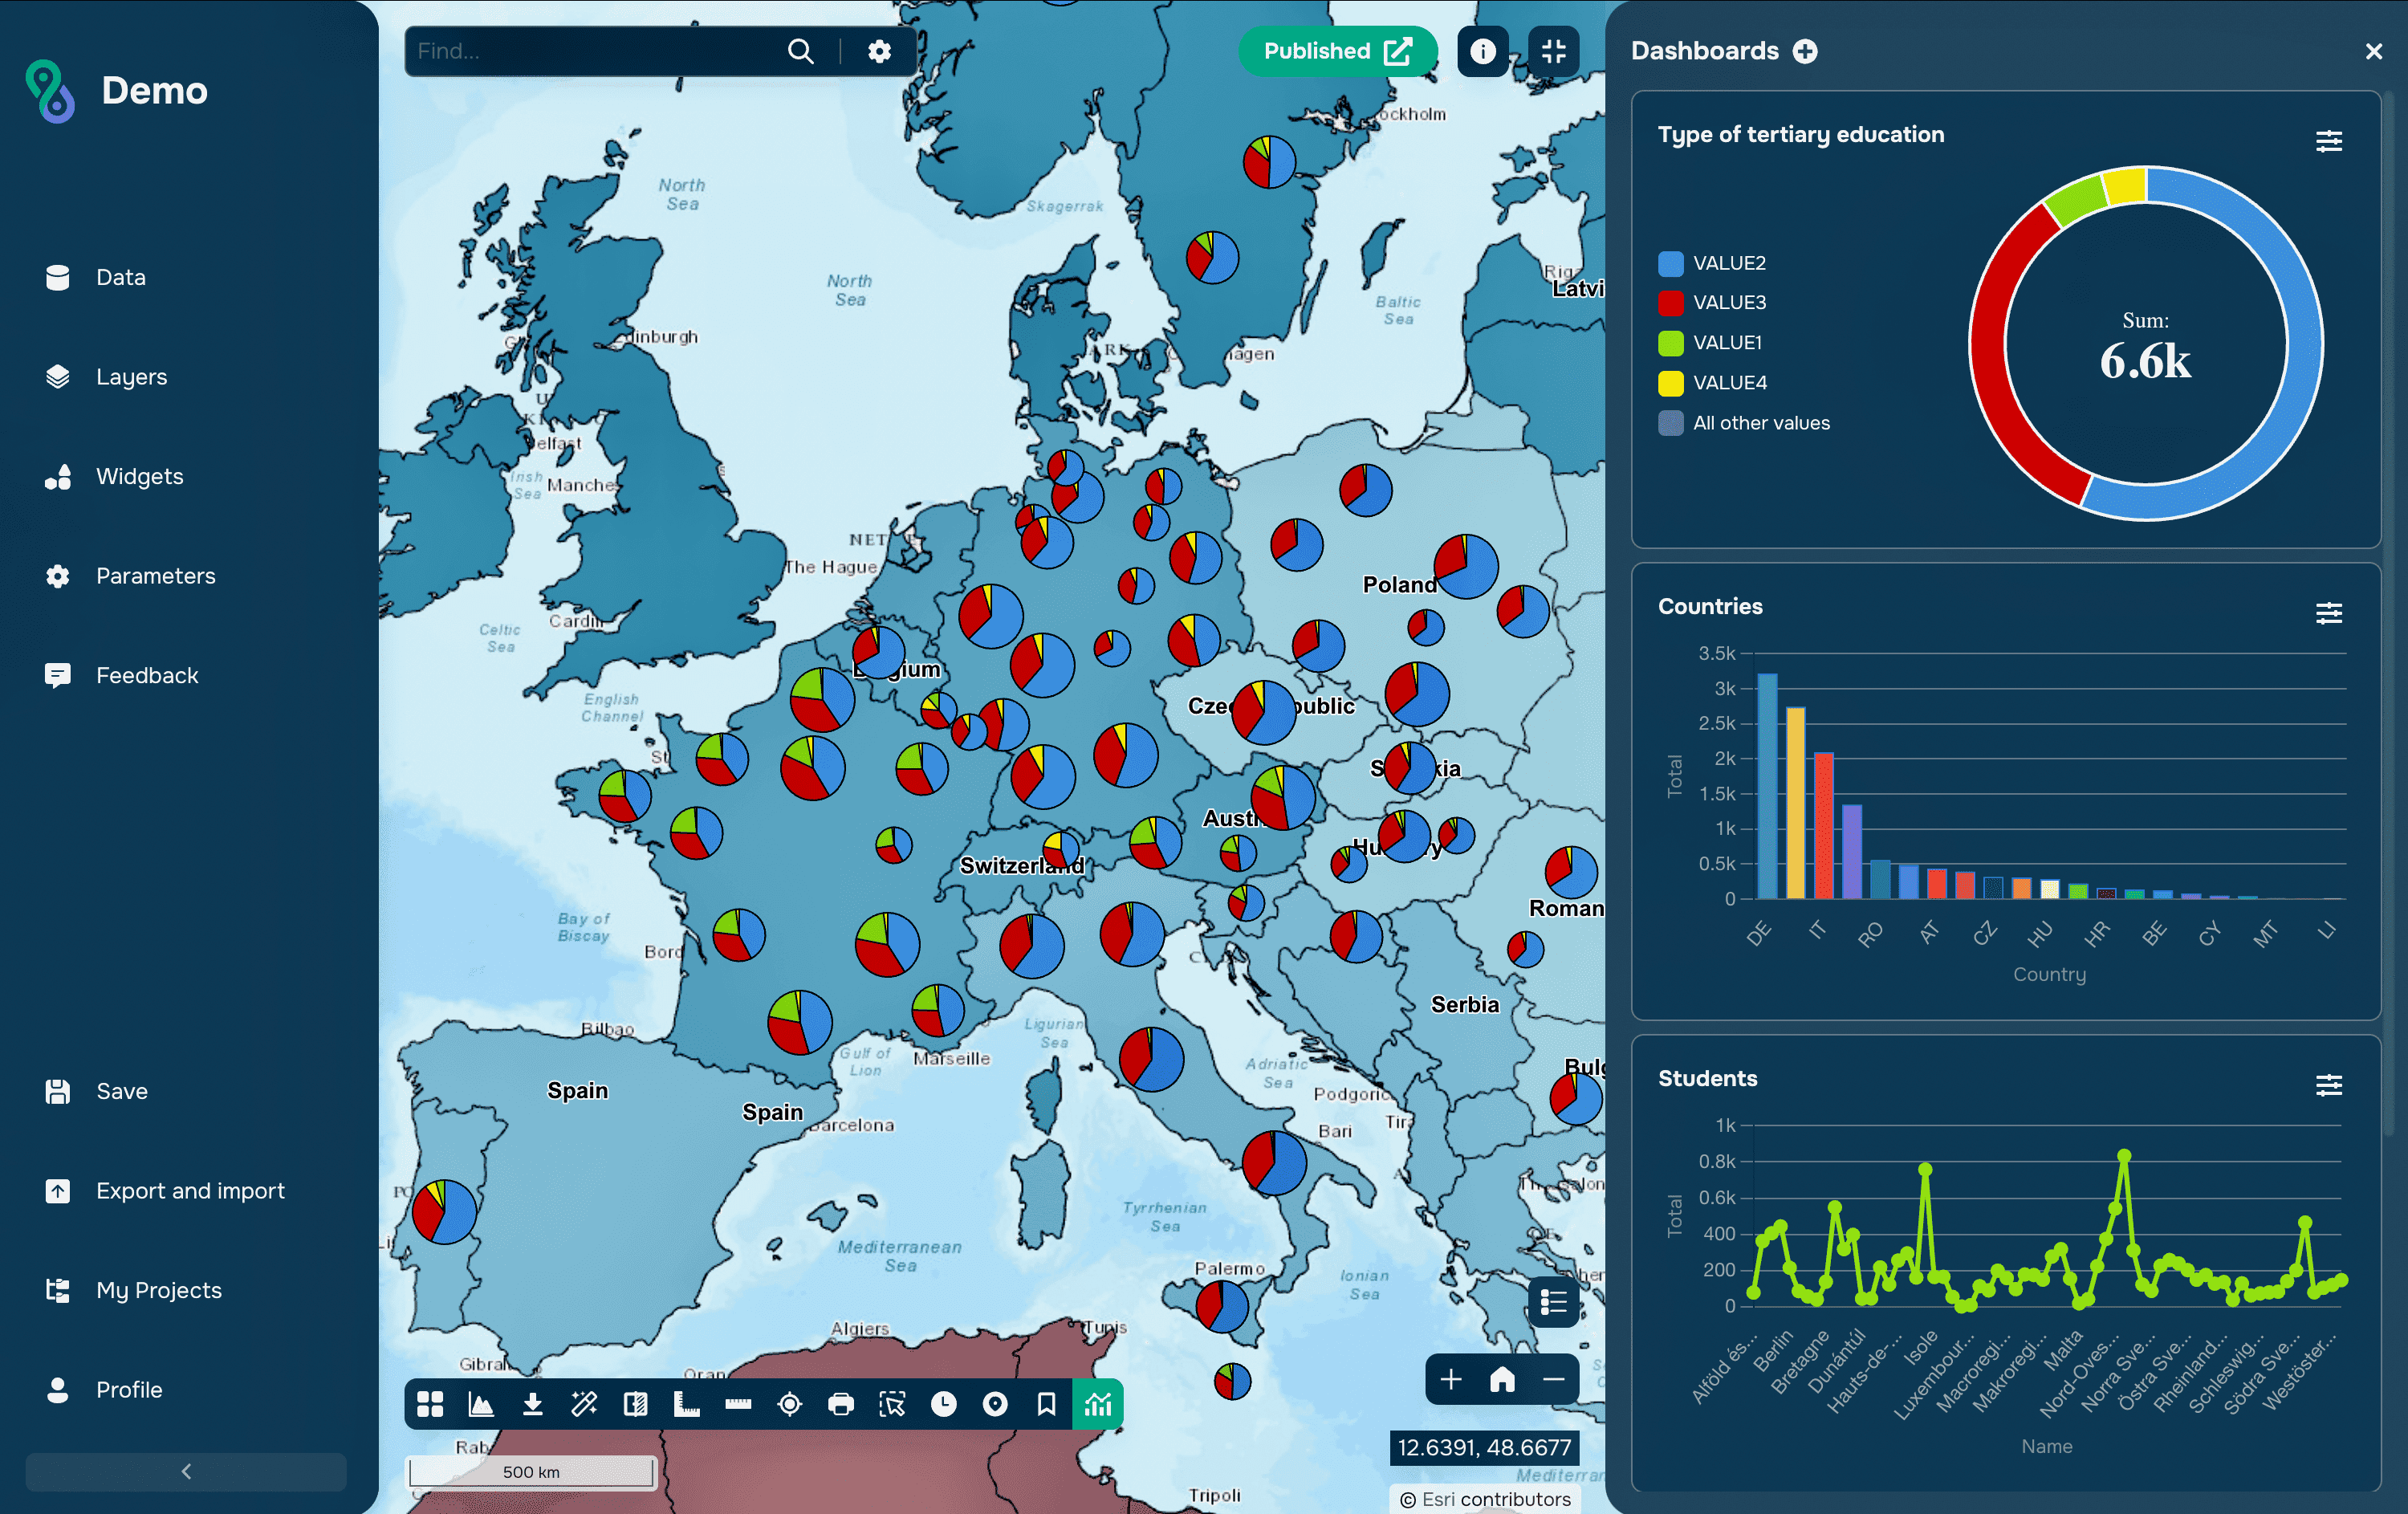
Map labels are text or graphic elements that provide additional information about objects, places, geographic features, or phenomena depicted on the map. They are used to clarify, describe, or highlight specific objects and their characteristics. Labels can include names of geographic features, settlements, rivers, mountains, streets, and other important data.
Why use labels?
Identifying objects
Labels are primarily needed to understand what is depicted on the map. Without them, the map would be just a collection of lines, dots, and colors without clear meaning.
Populated areas: Labels help distinguish cities, villages, towns, and other populated areas.
Rivers, lakes, mountains: Geographic features such as rivers, lakes, and mountain ranges also require labels for proper identification.
Roads, paths, and highways: Road labels help map users navigate the transportation network more quickly. Even on detailed road maps, it's important to indicate key transportation hubs and major routes.
Convenience and Accessibility
Accessibility: Maps with labels can be adapted for people with low vision or other disabilities.
Ease of Use: Map labels significantly facilitate finding the information you need, allowing users to quickly navigate the map.
How do I set up labels in GISCARTA?
To set up labels, go to the Labels section of the layer settings.
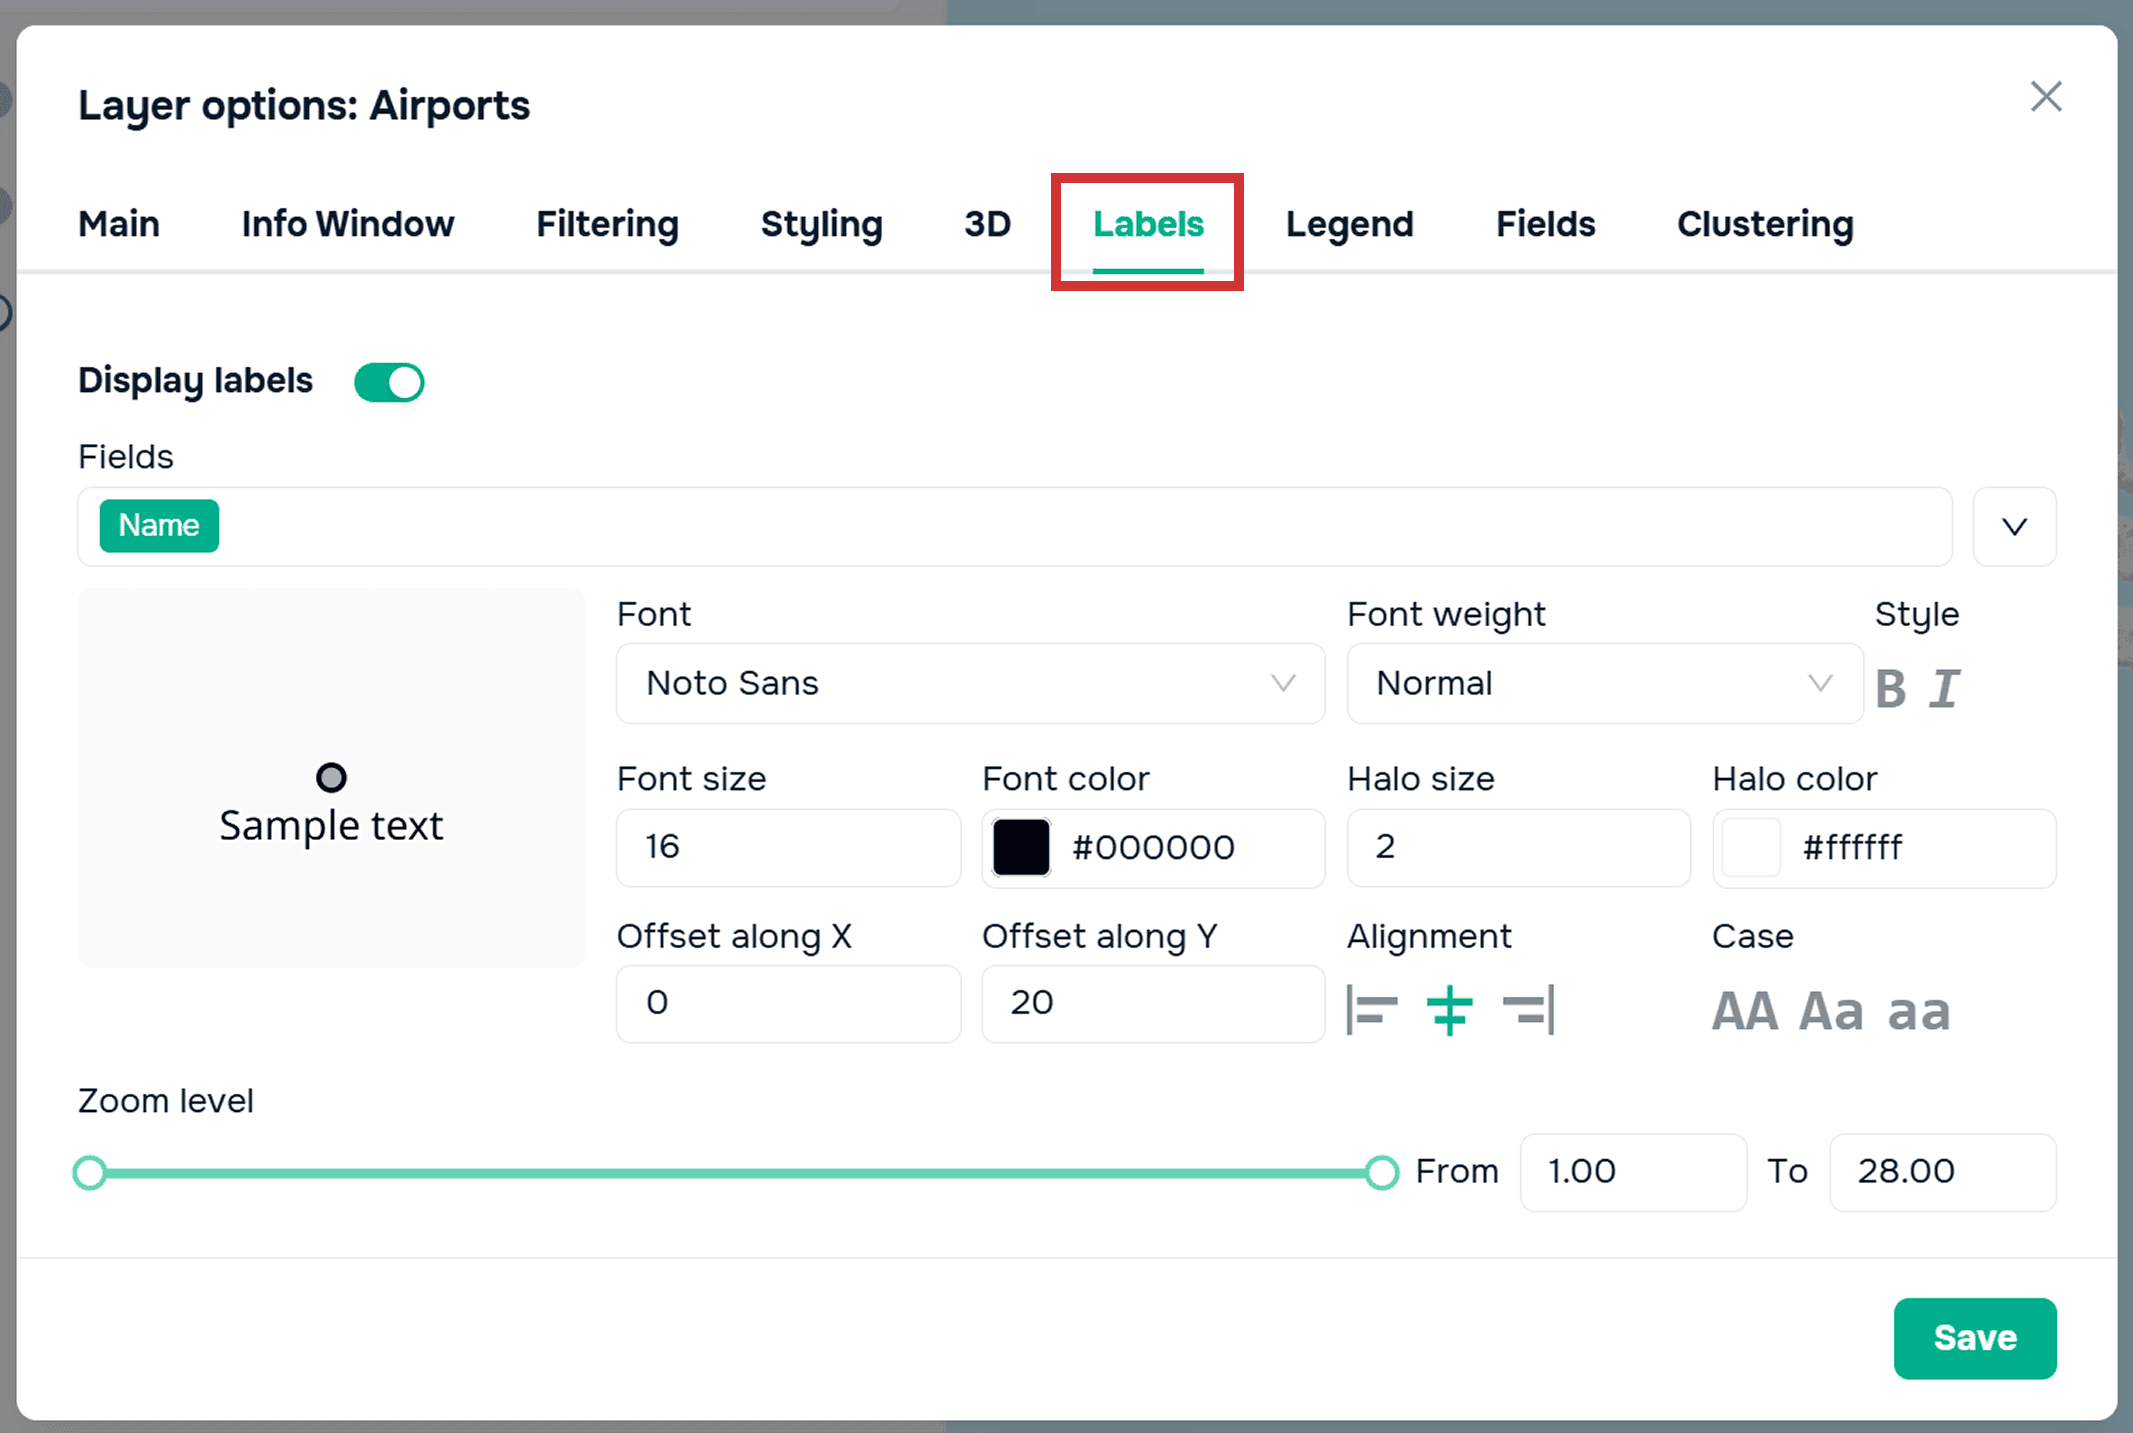
Now let's move on to setting up the labels themselves.
Attributes
First, we need to select the field by which we'll label the geographic features.

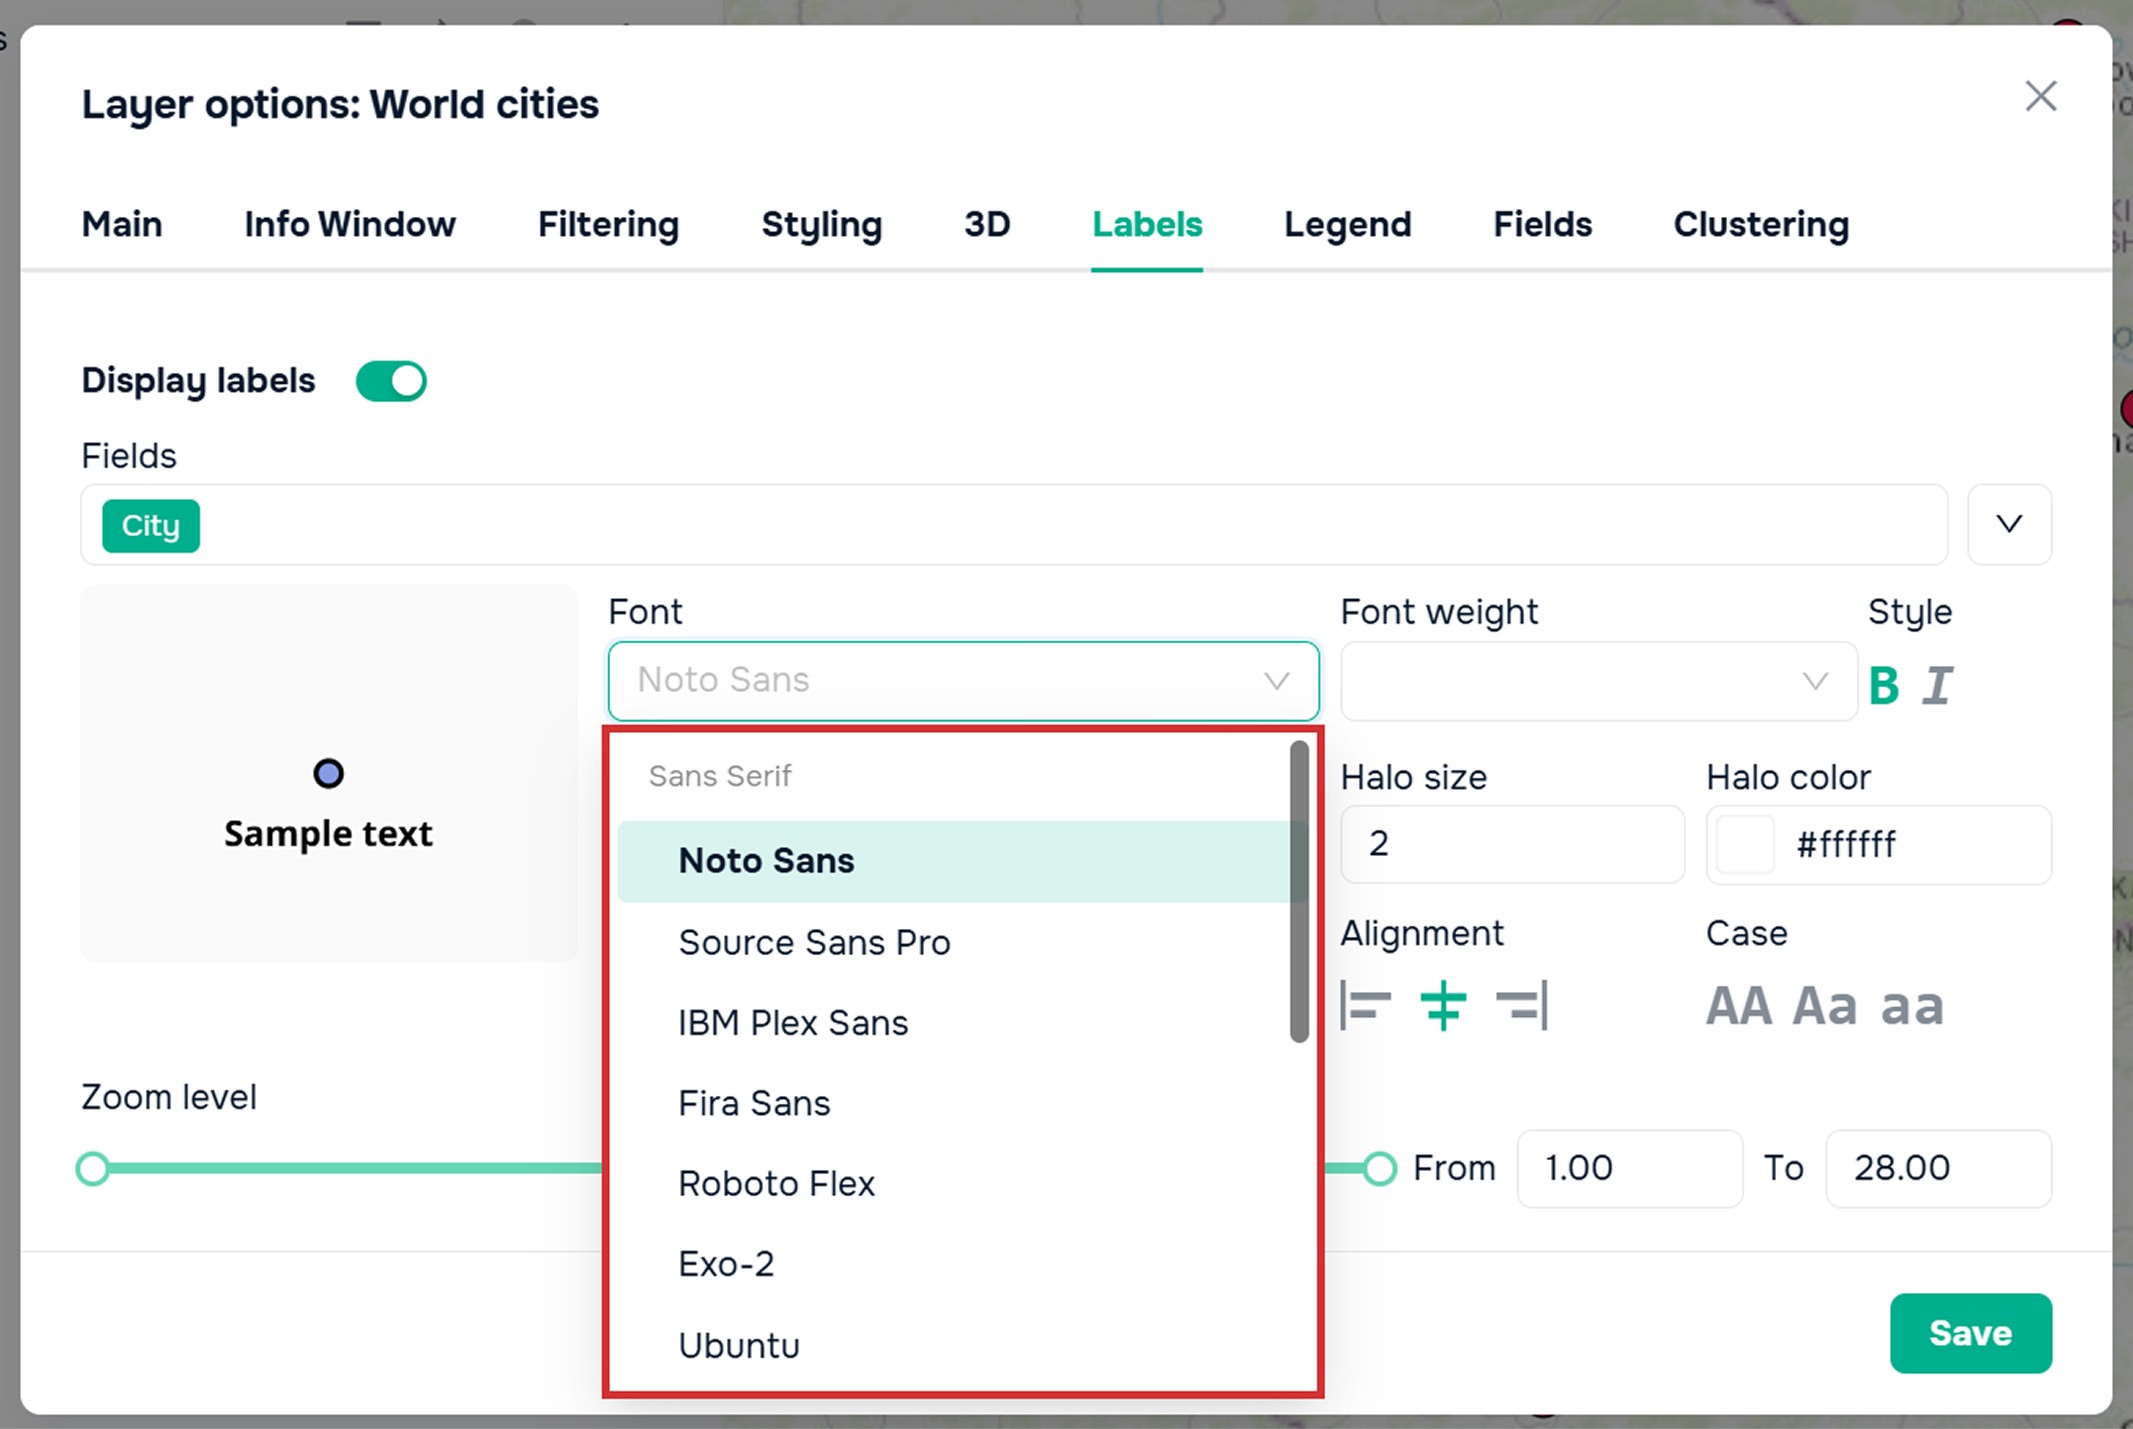
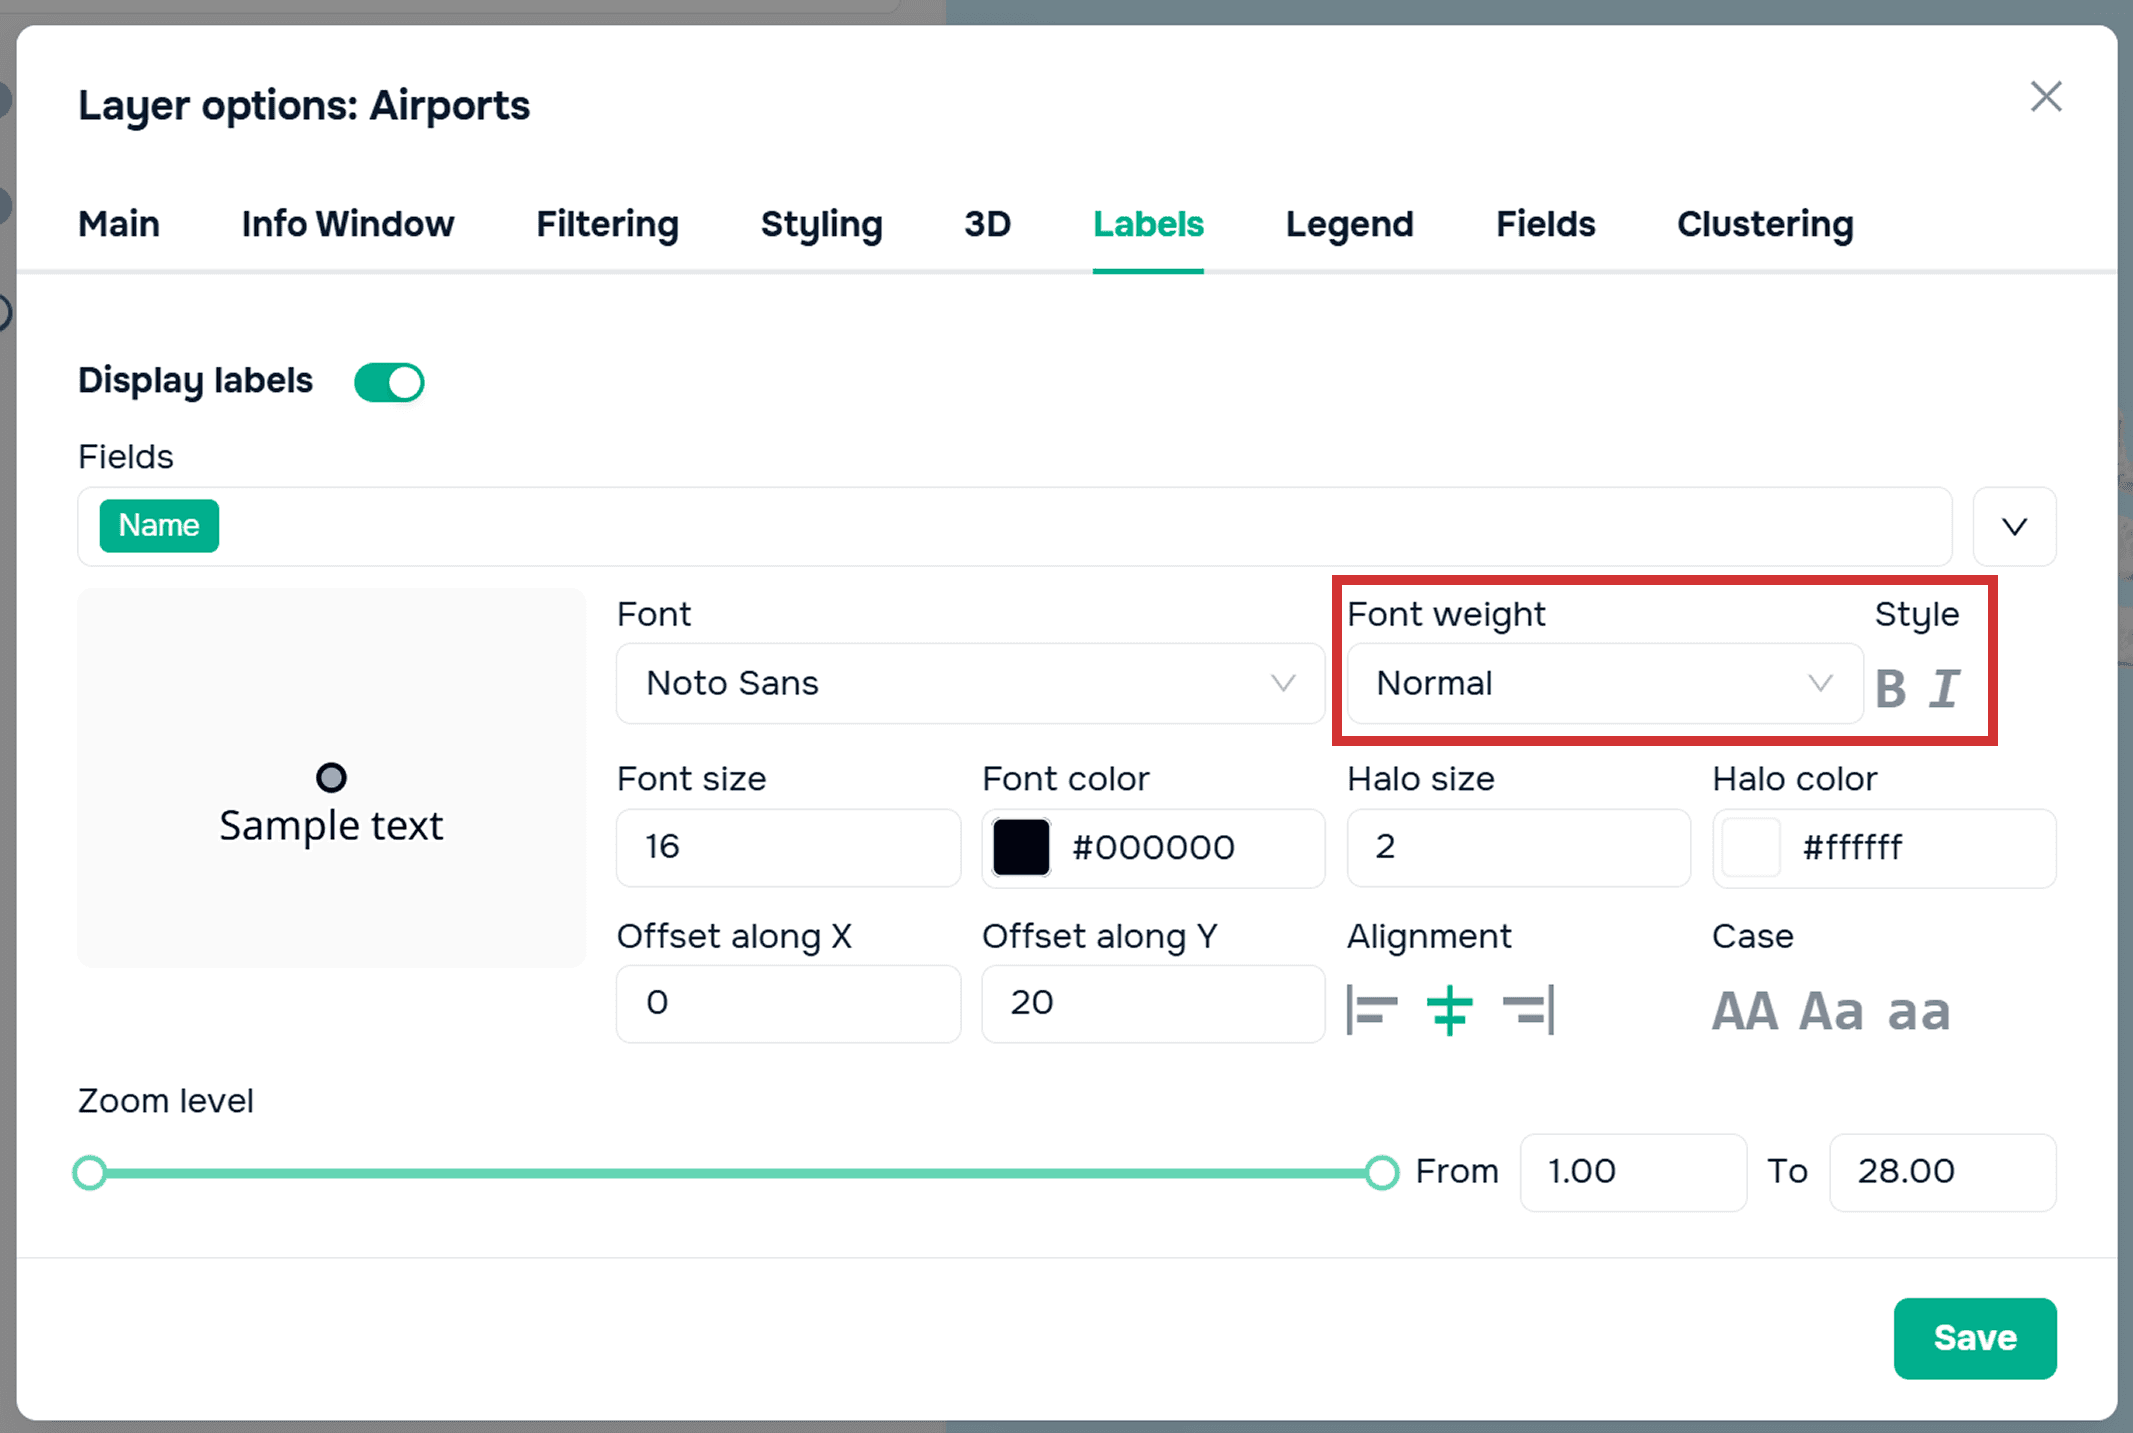
Font
You can also customize the font of the captions: its type, thickness, and italic.
Position
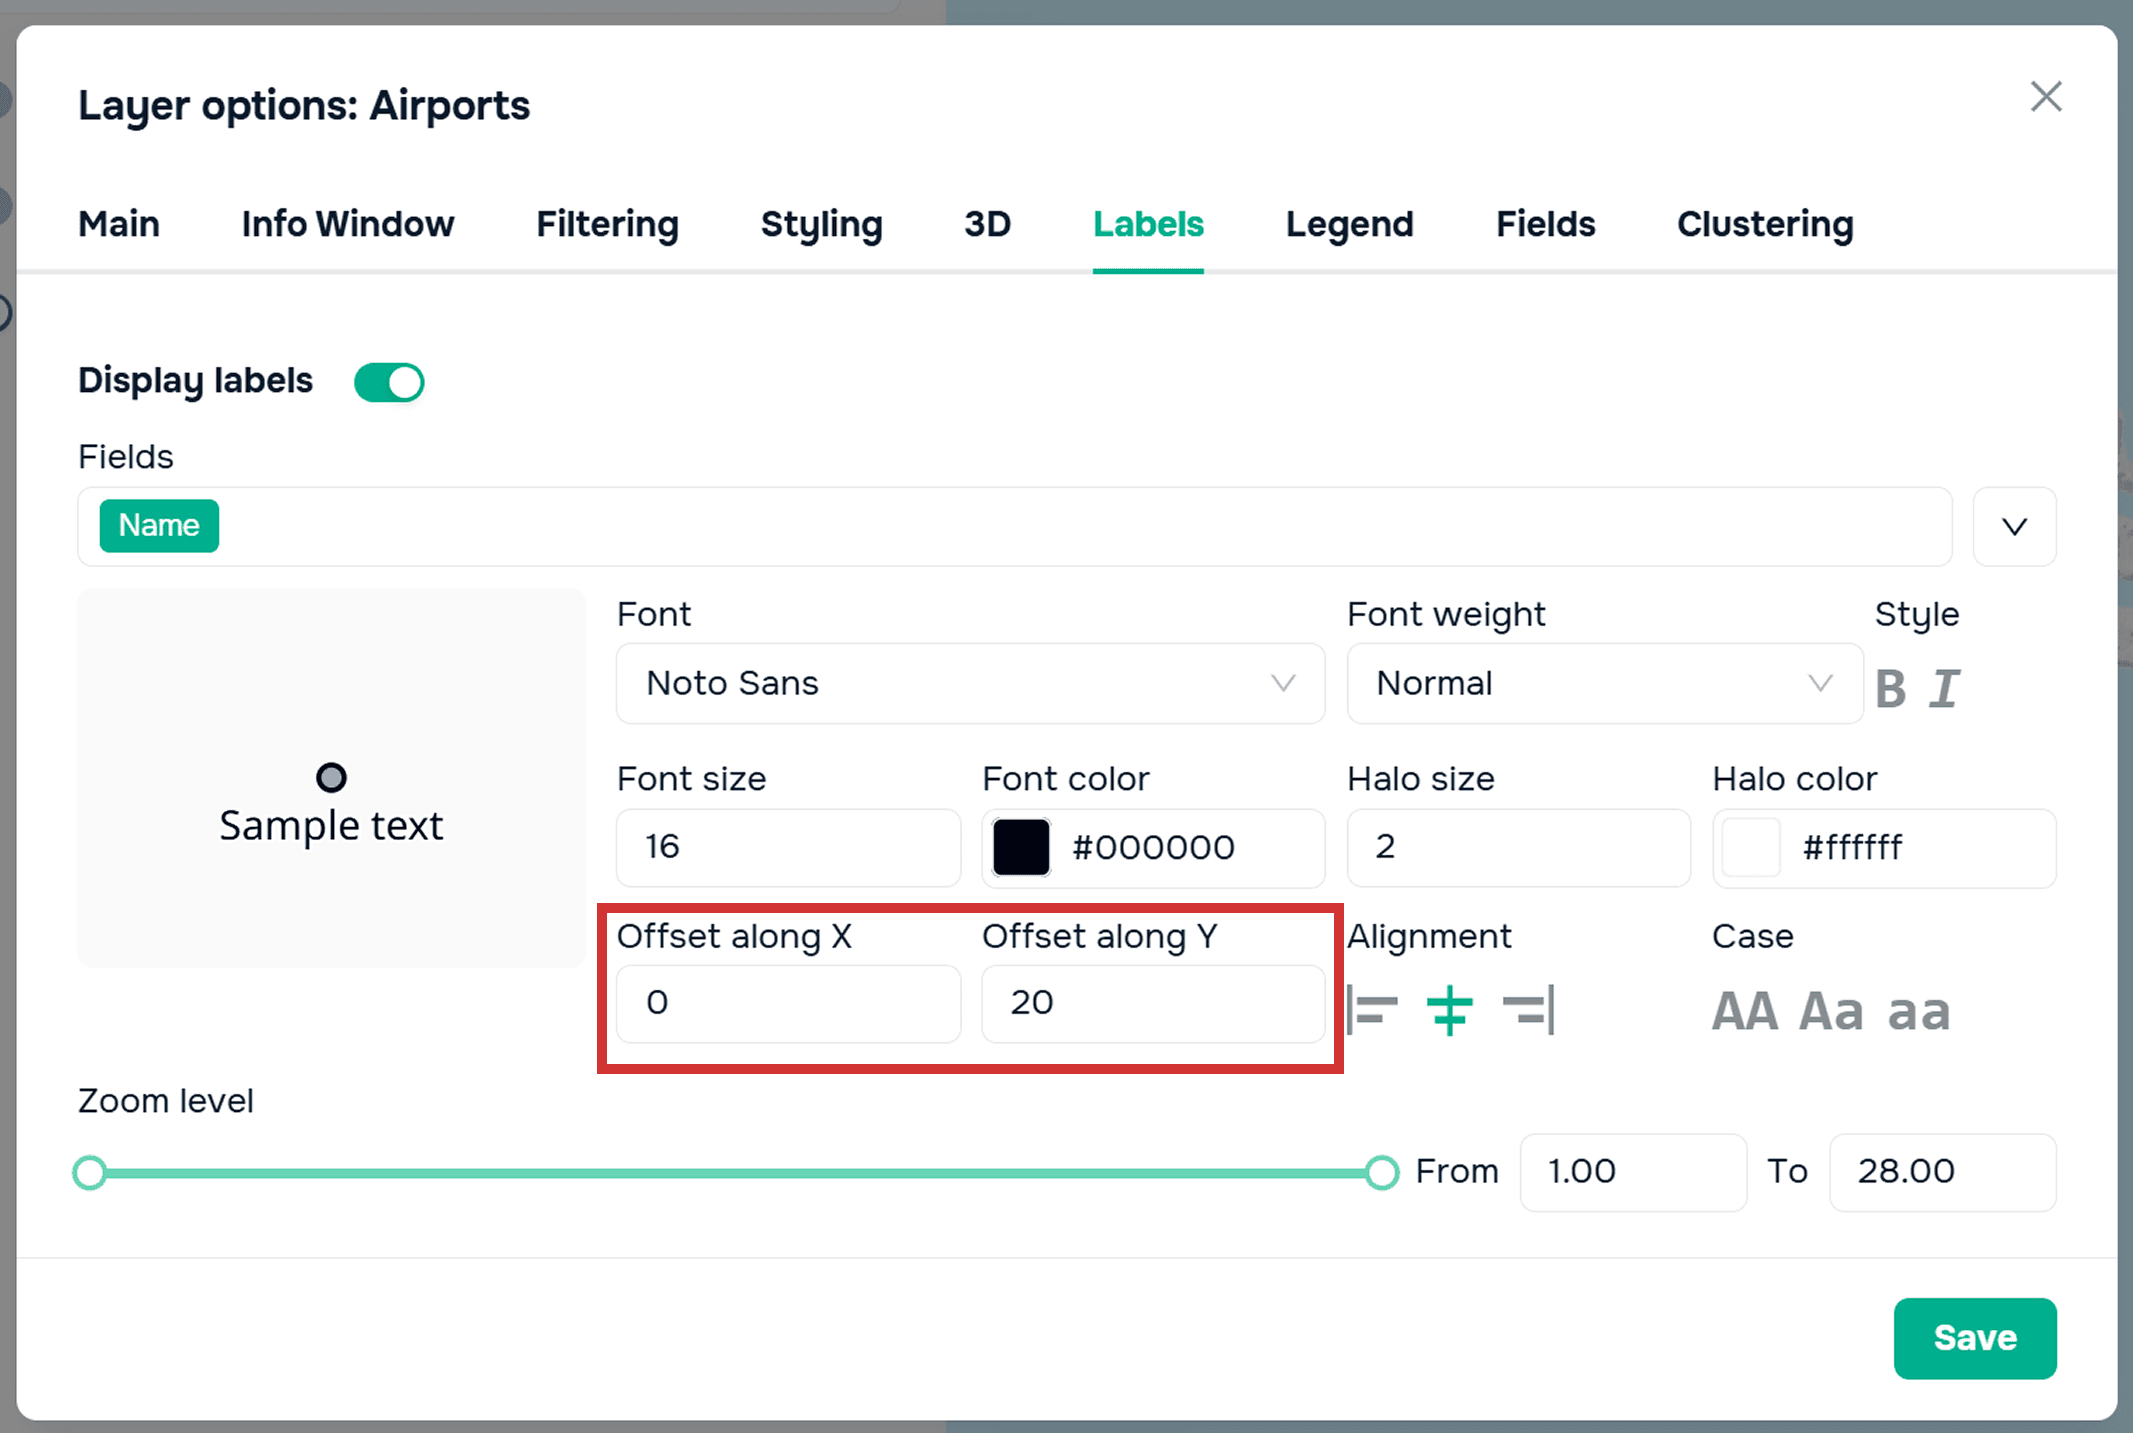
Next, you need to ensure that the signature itself doesn't overlap the object—you need to move it along the x and y axes.
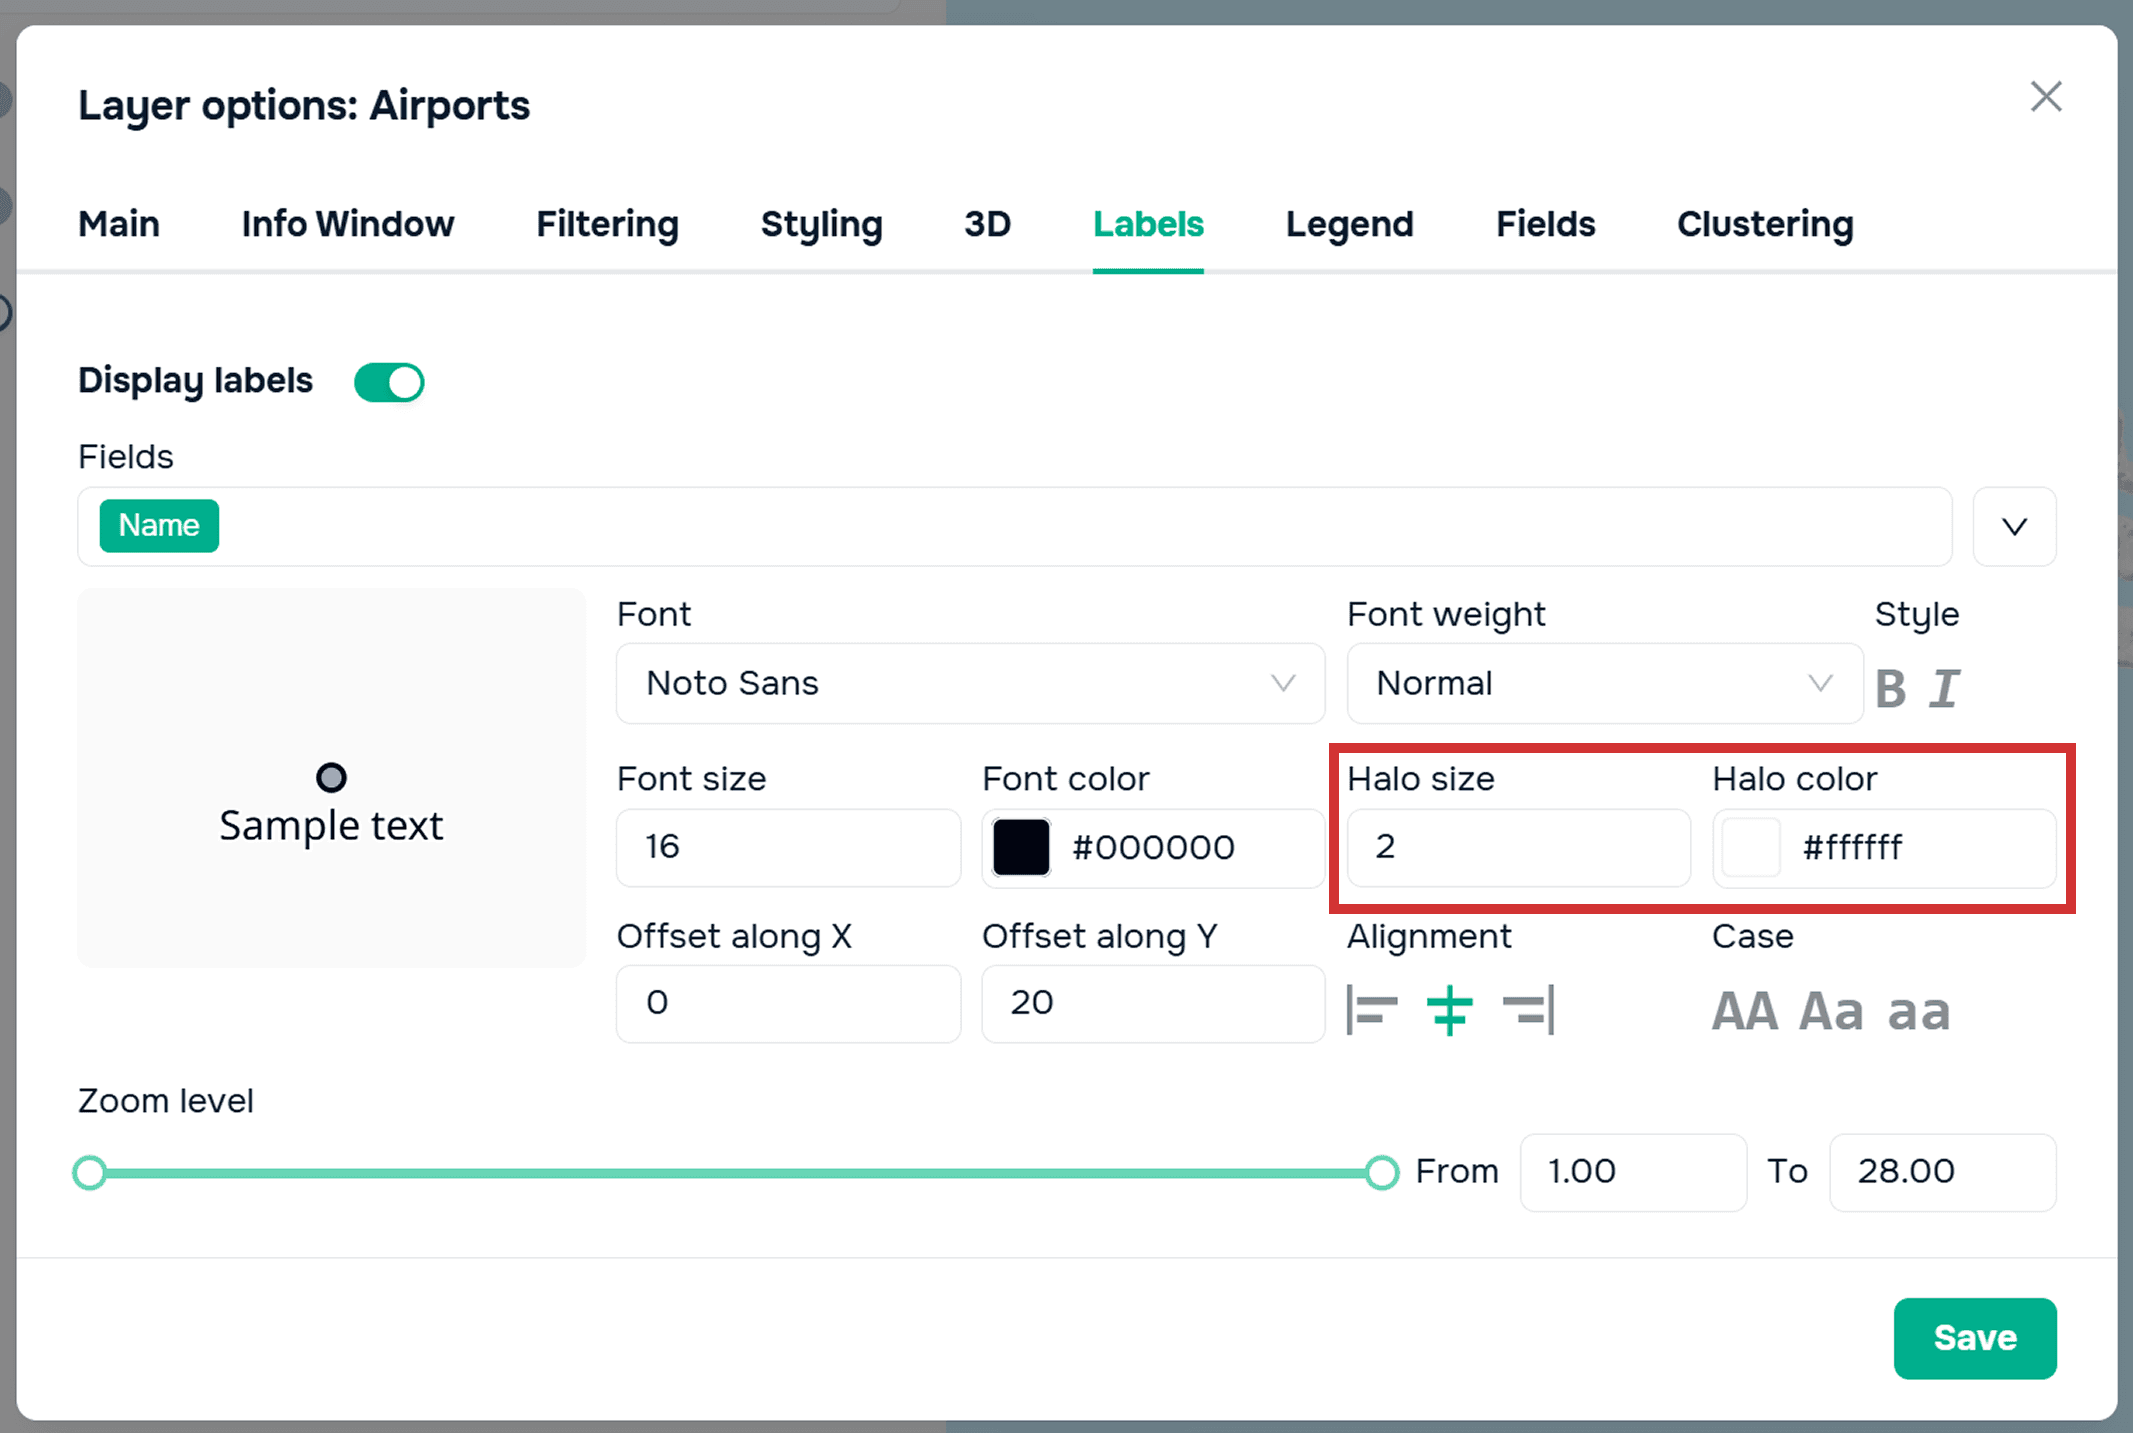
Halo
To prevent your signatures from blending into the background, you can add a halo around the outline of the letters.
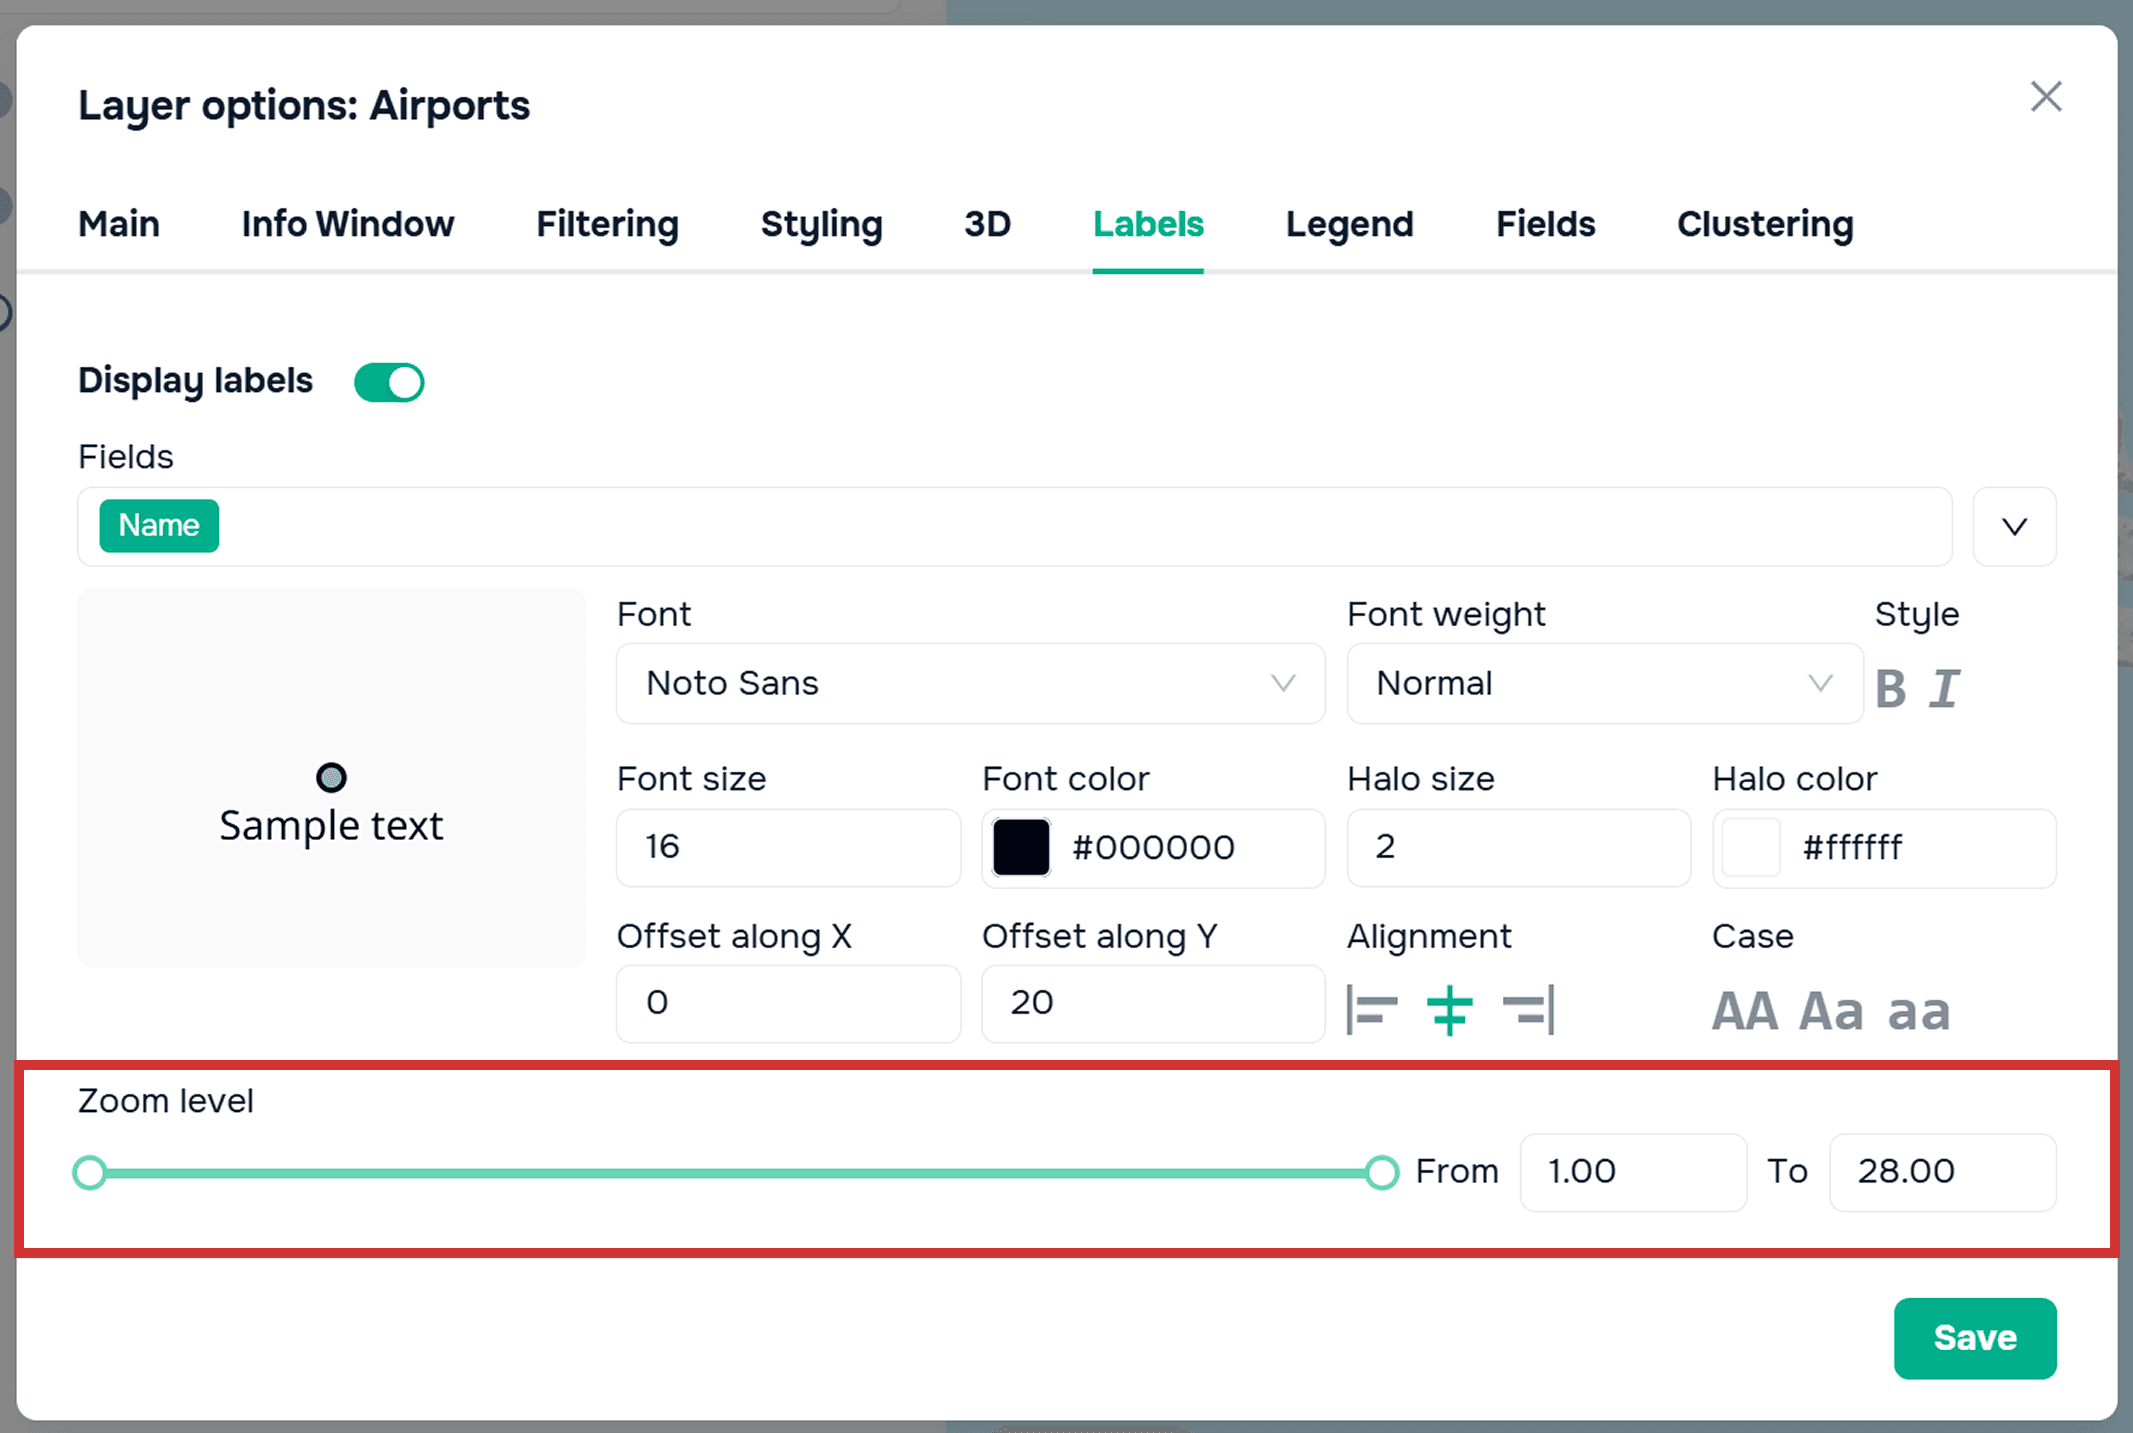
Display
Labels aren't always required at all zoom levels. Therefore, the platform allows you to configure their display within a specific zoom range.
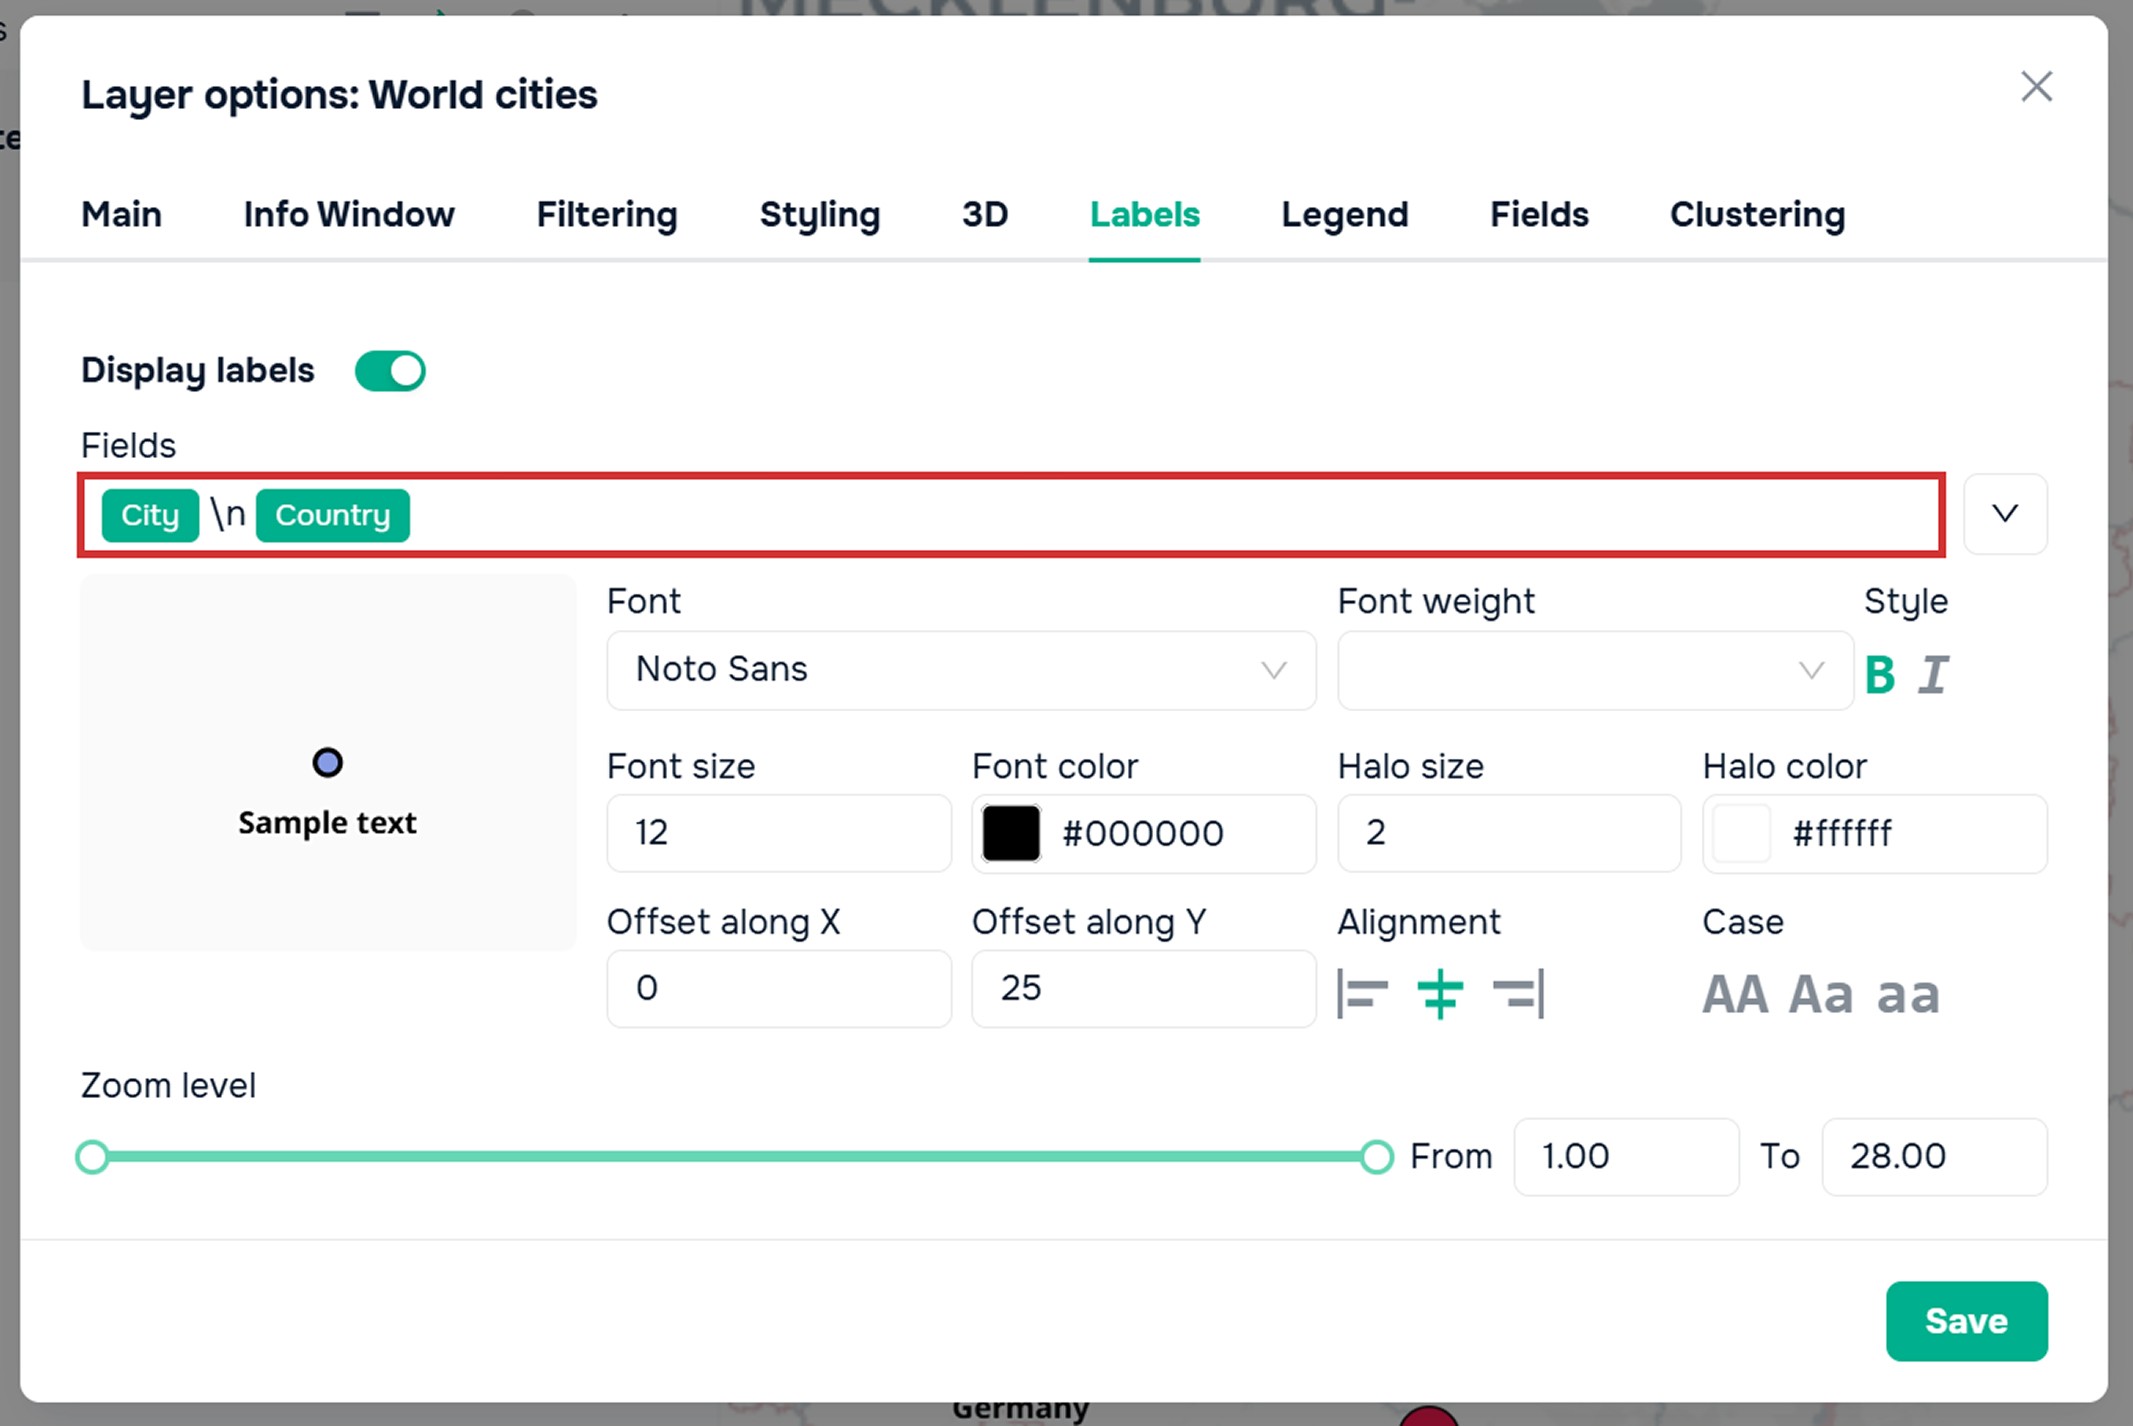
You can also enter the \n character to create a line break in a label.
For linear objects, you can also adjust the text position relative to the line:
top
bottom
at the intersection
at the beginning
at the end
in the center

The platform also allows you to add labels as a separate graphic layer, making them a standalone object on the map, not linked to other spatial layers. You can also choose their location yourself.
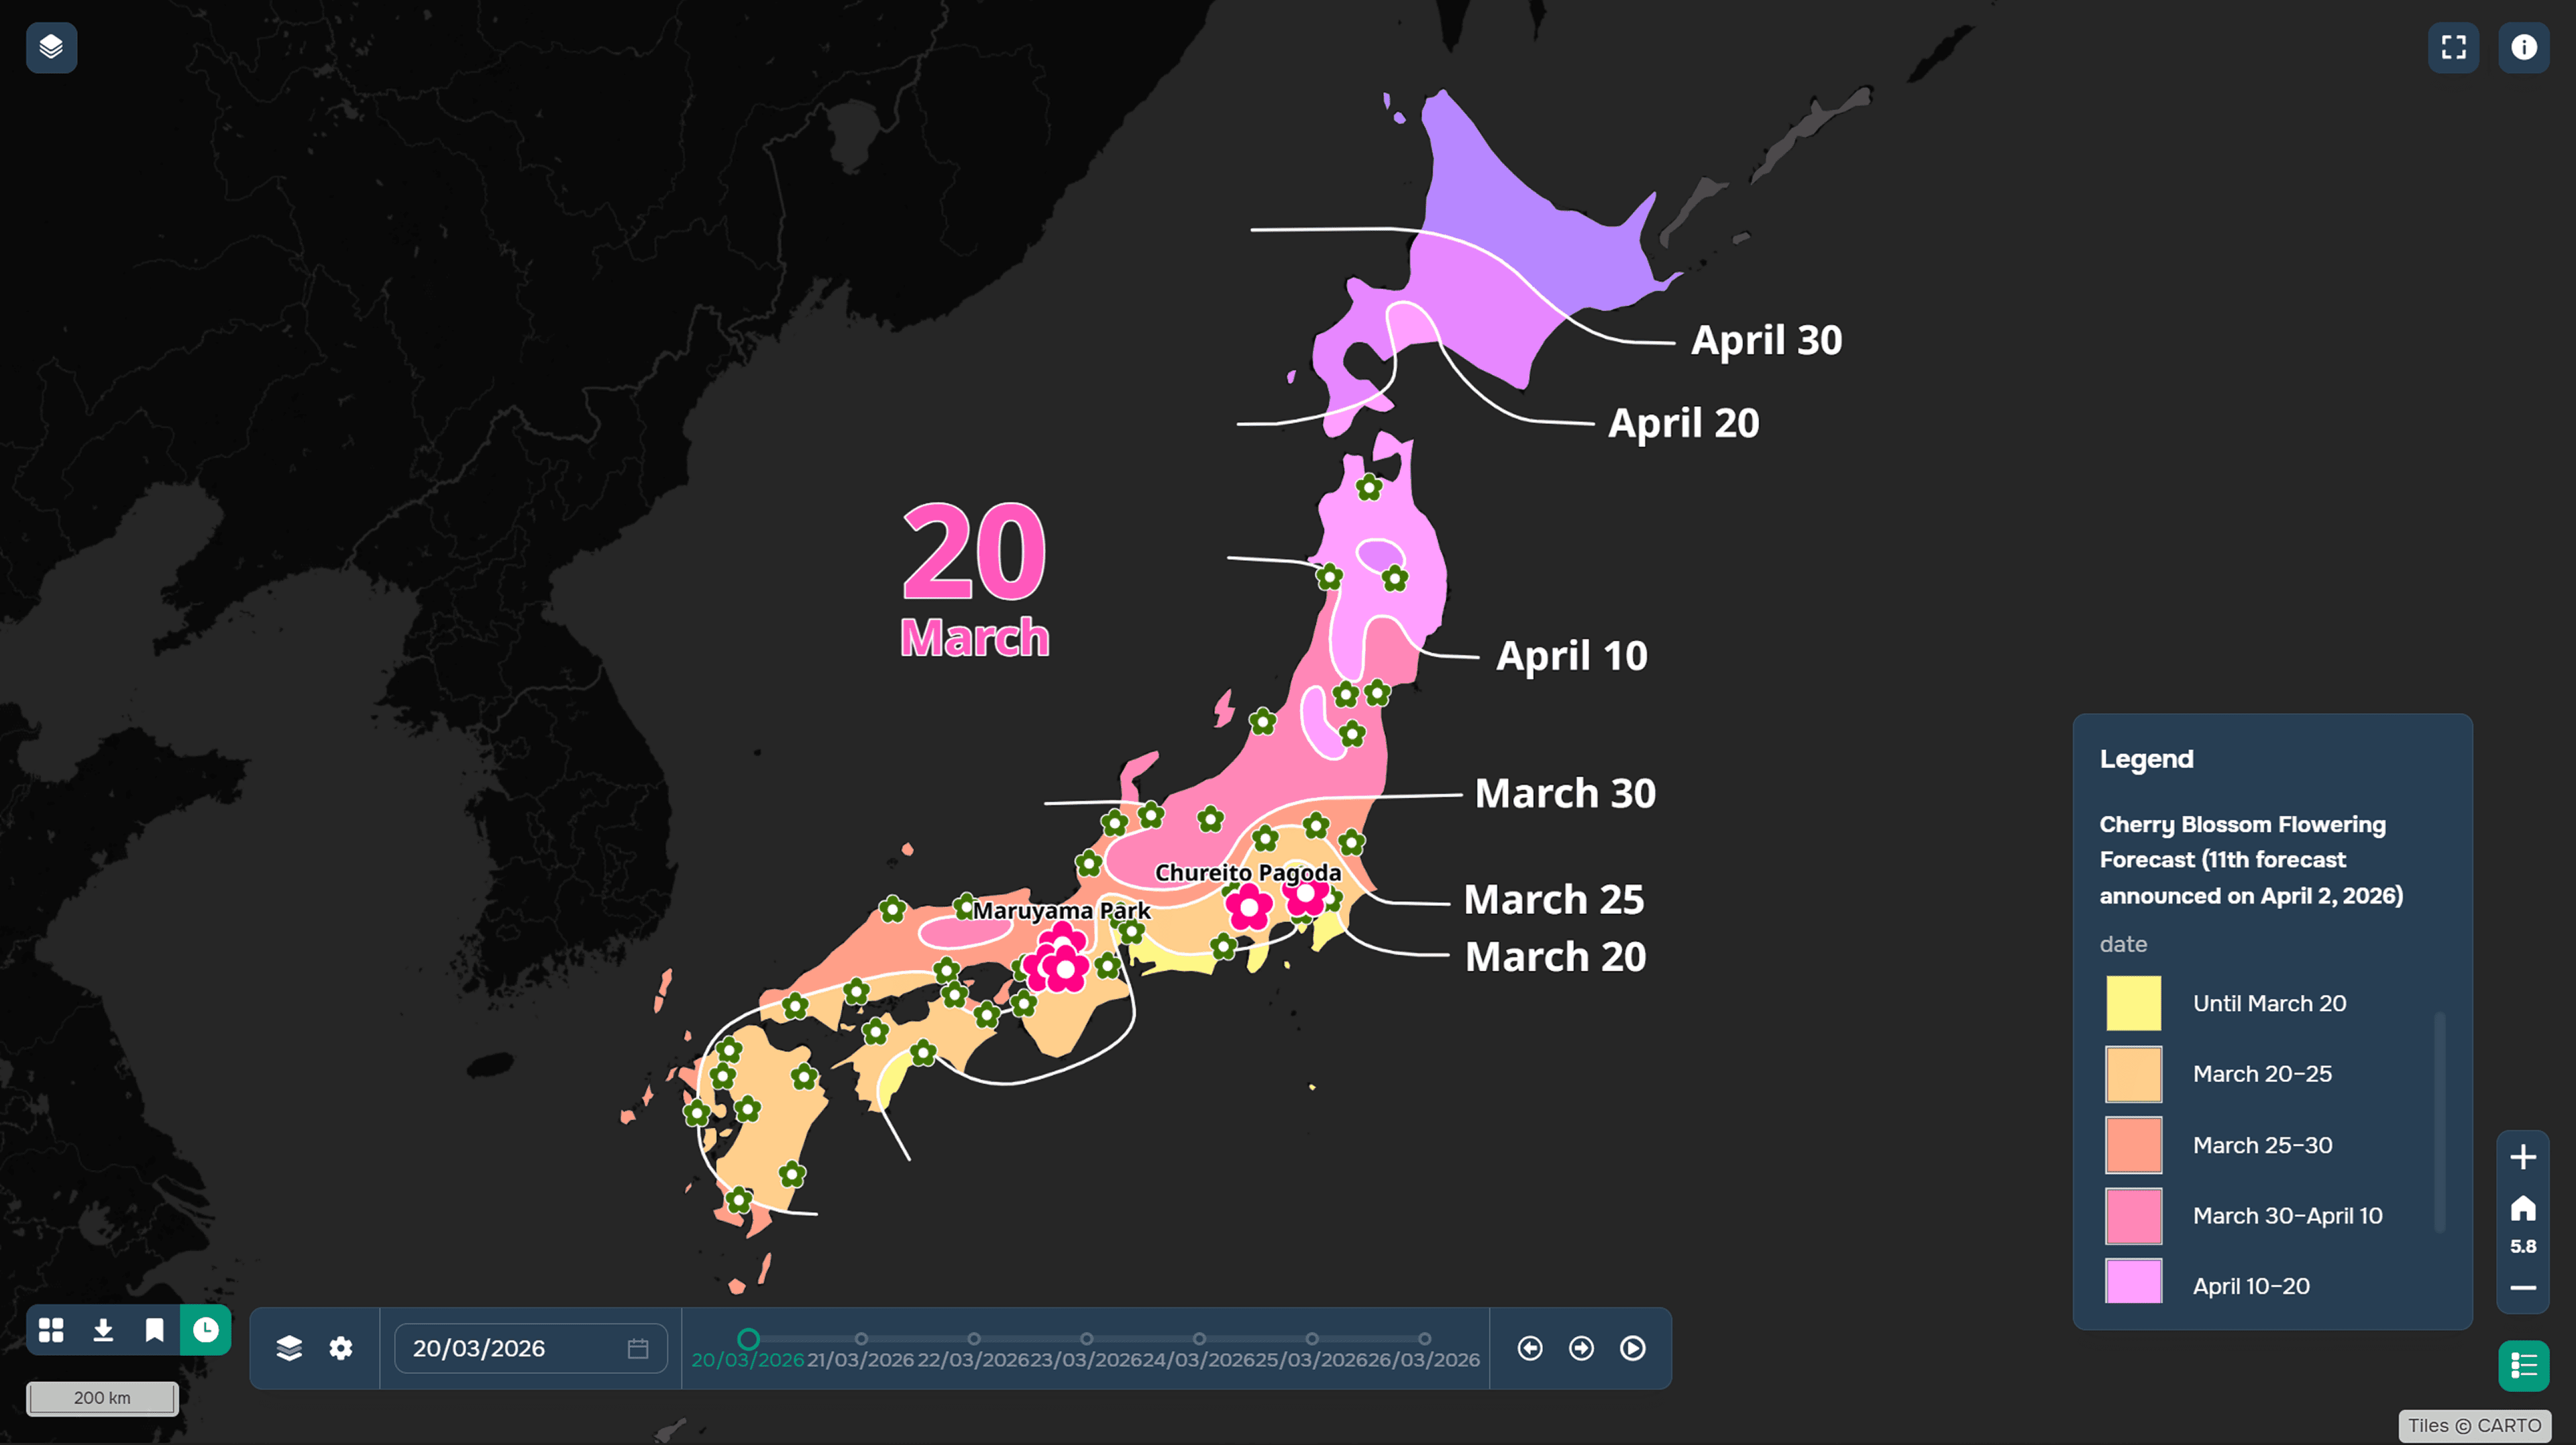
An example of linear feature labels as a separate graphic layer
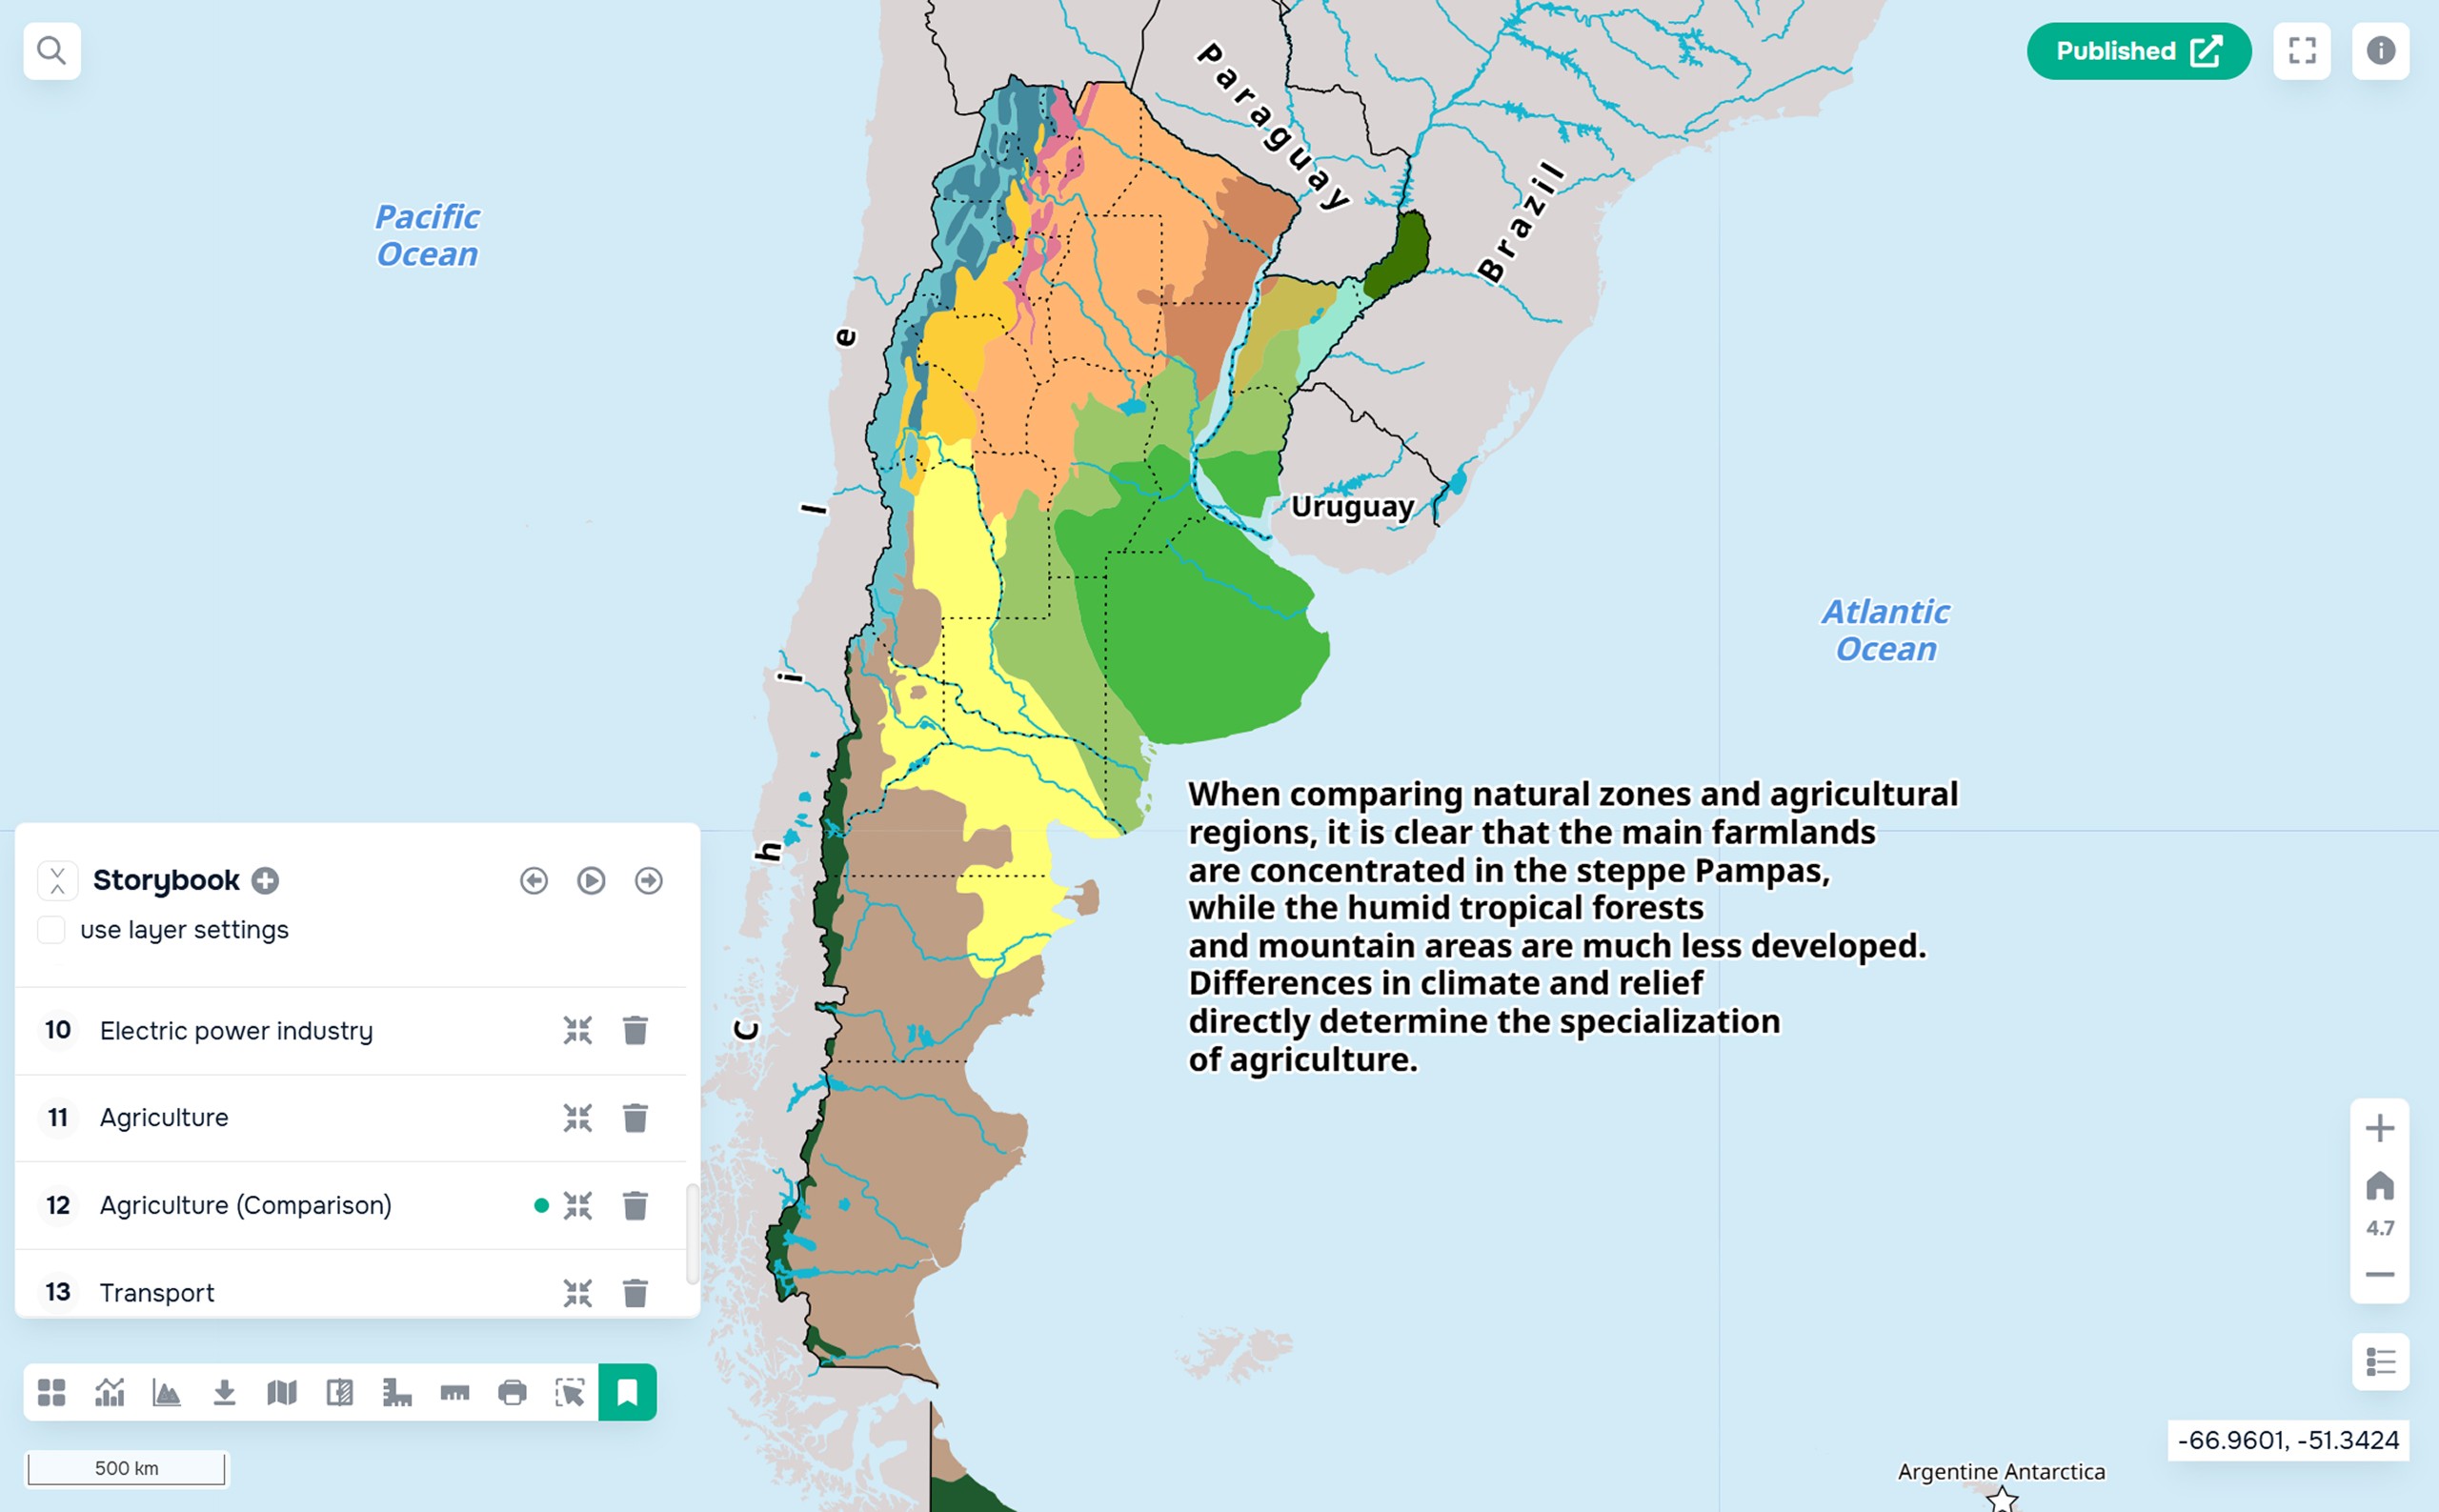
An example of country and ocean labels using a graphic layer
Using a graphic layer, you can label objects with just text and text inside a polygon (that is, on a background).
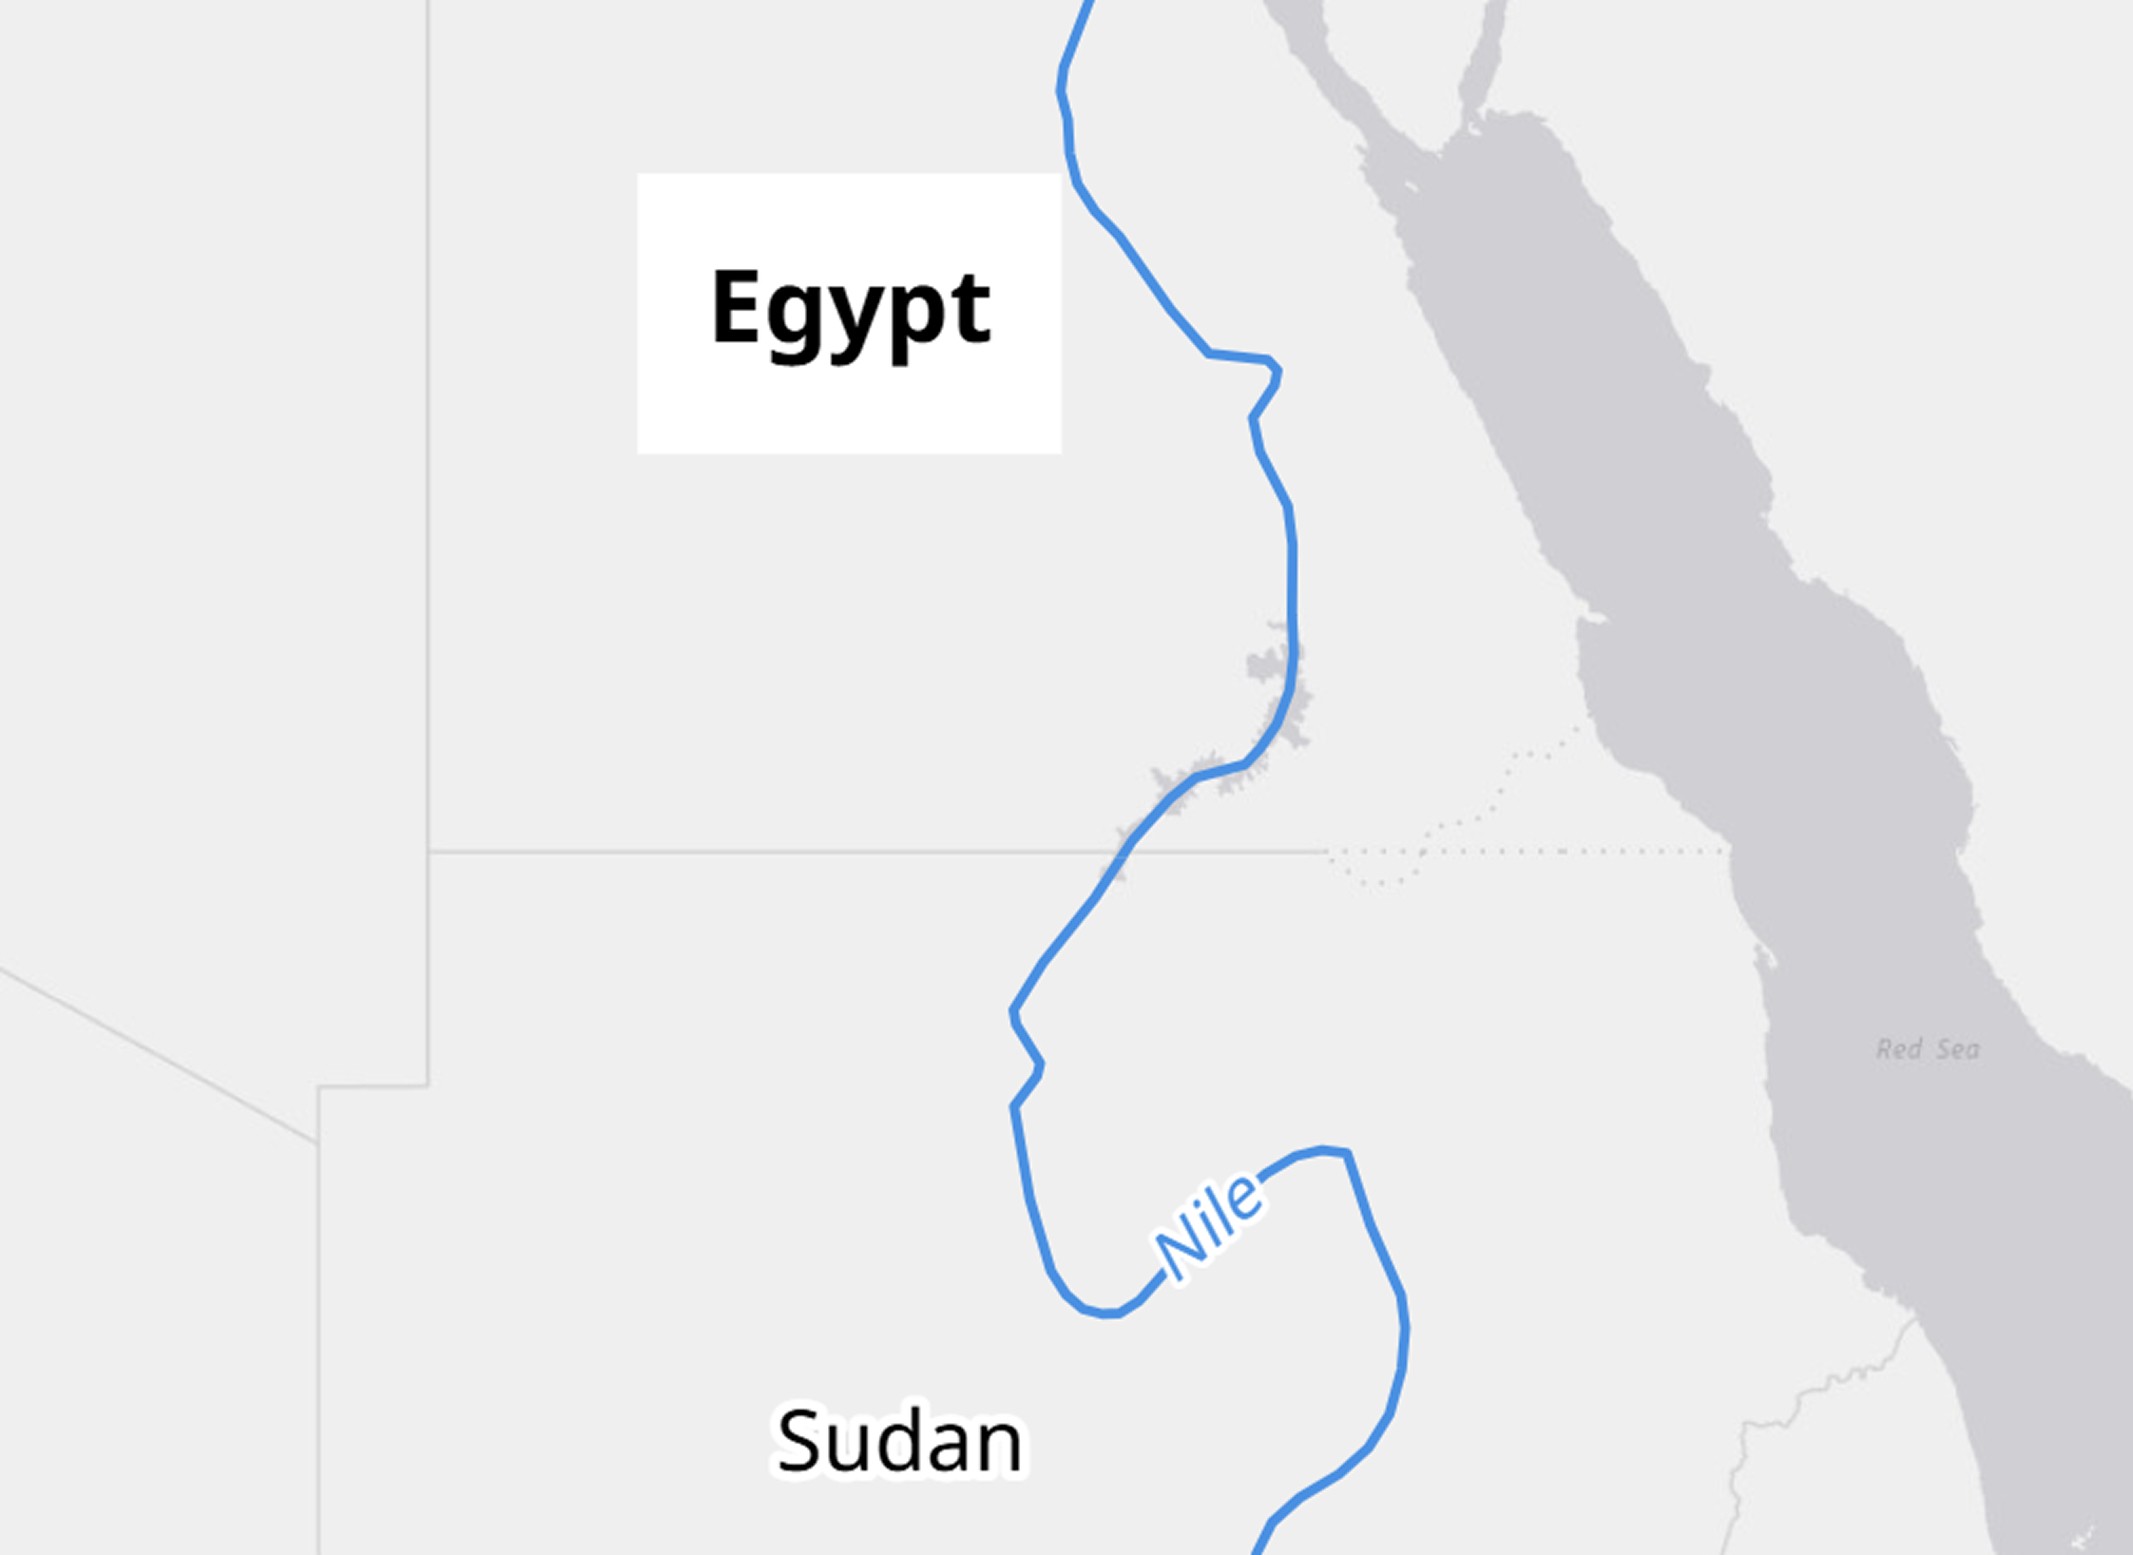
An example of country labels using a graphic layer: just text and text on a background
If your project requires manually labeling linear features, you can also use a graphic layer. Create a line, write text along it, and then remove its thickness.
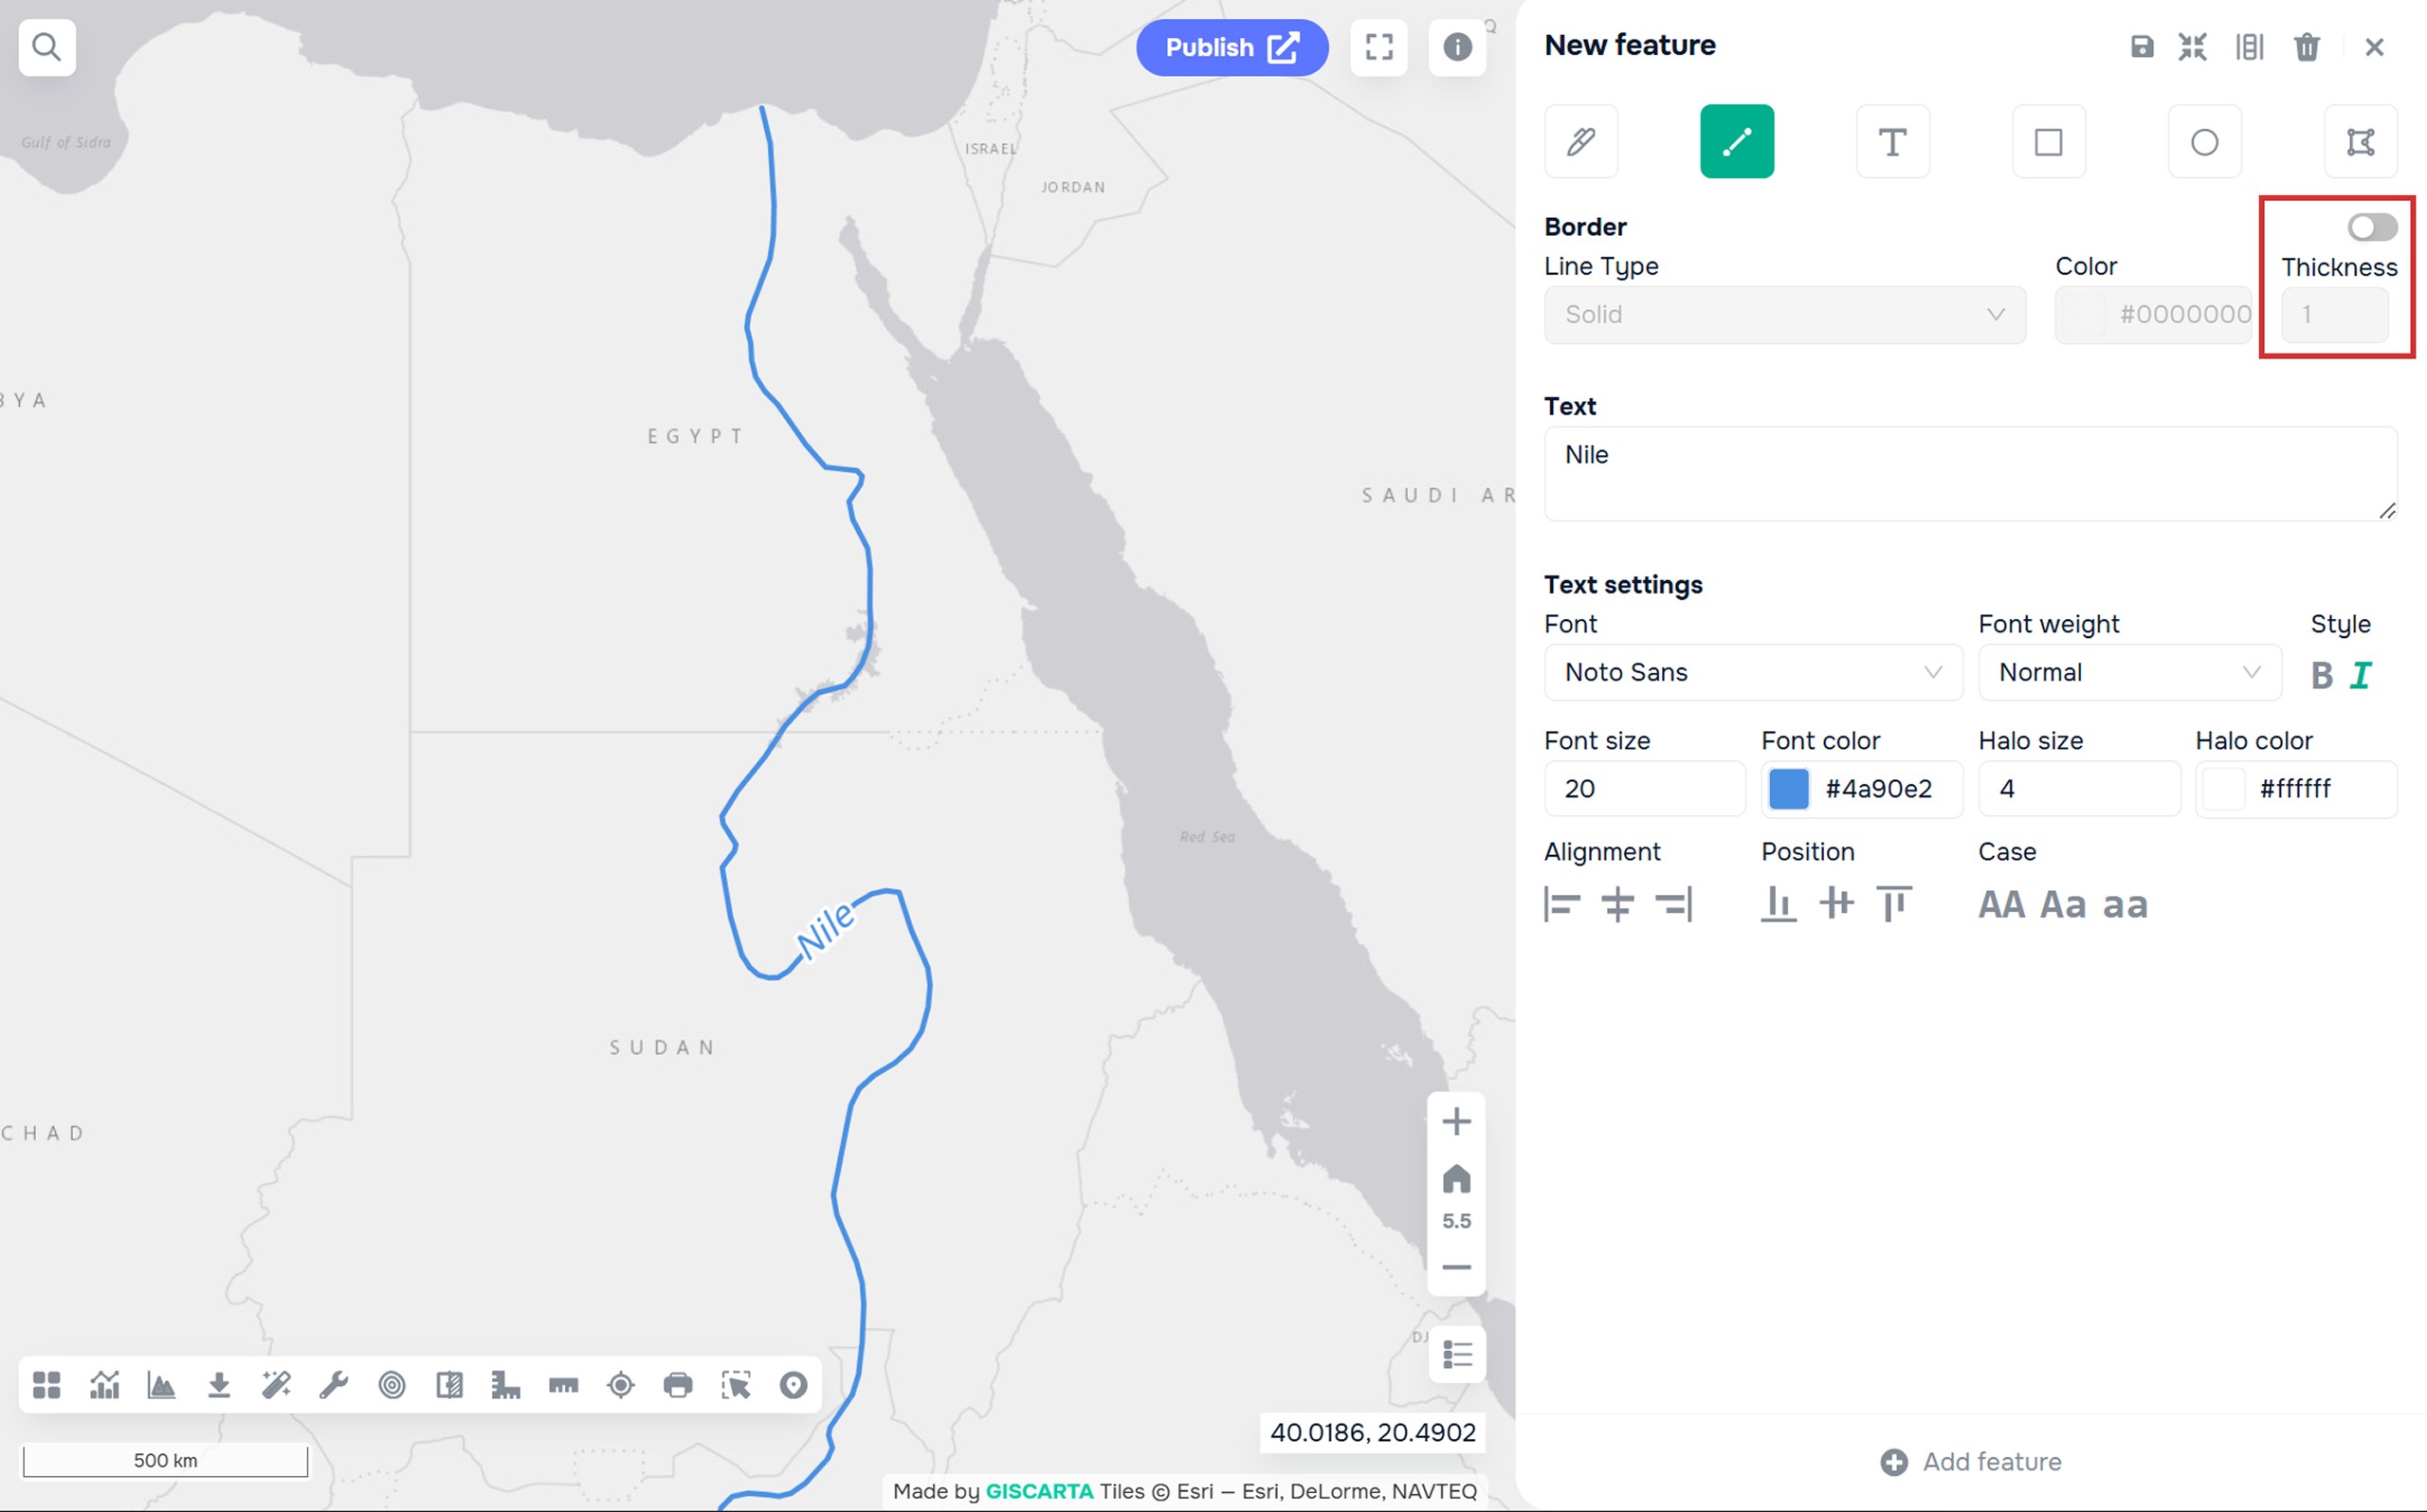
An example of a river label using a graphic layer
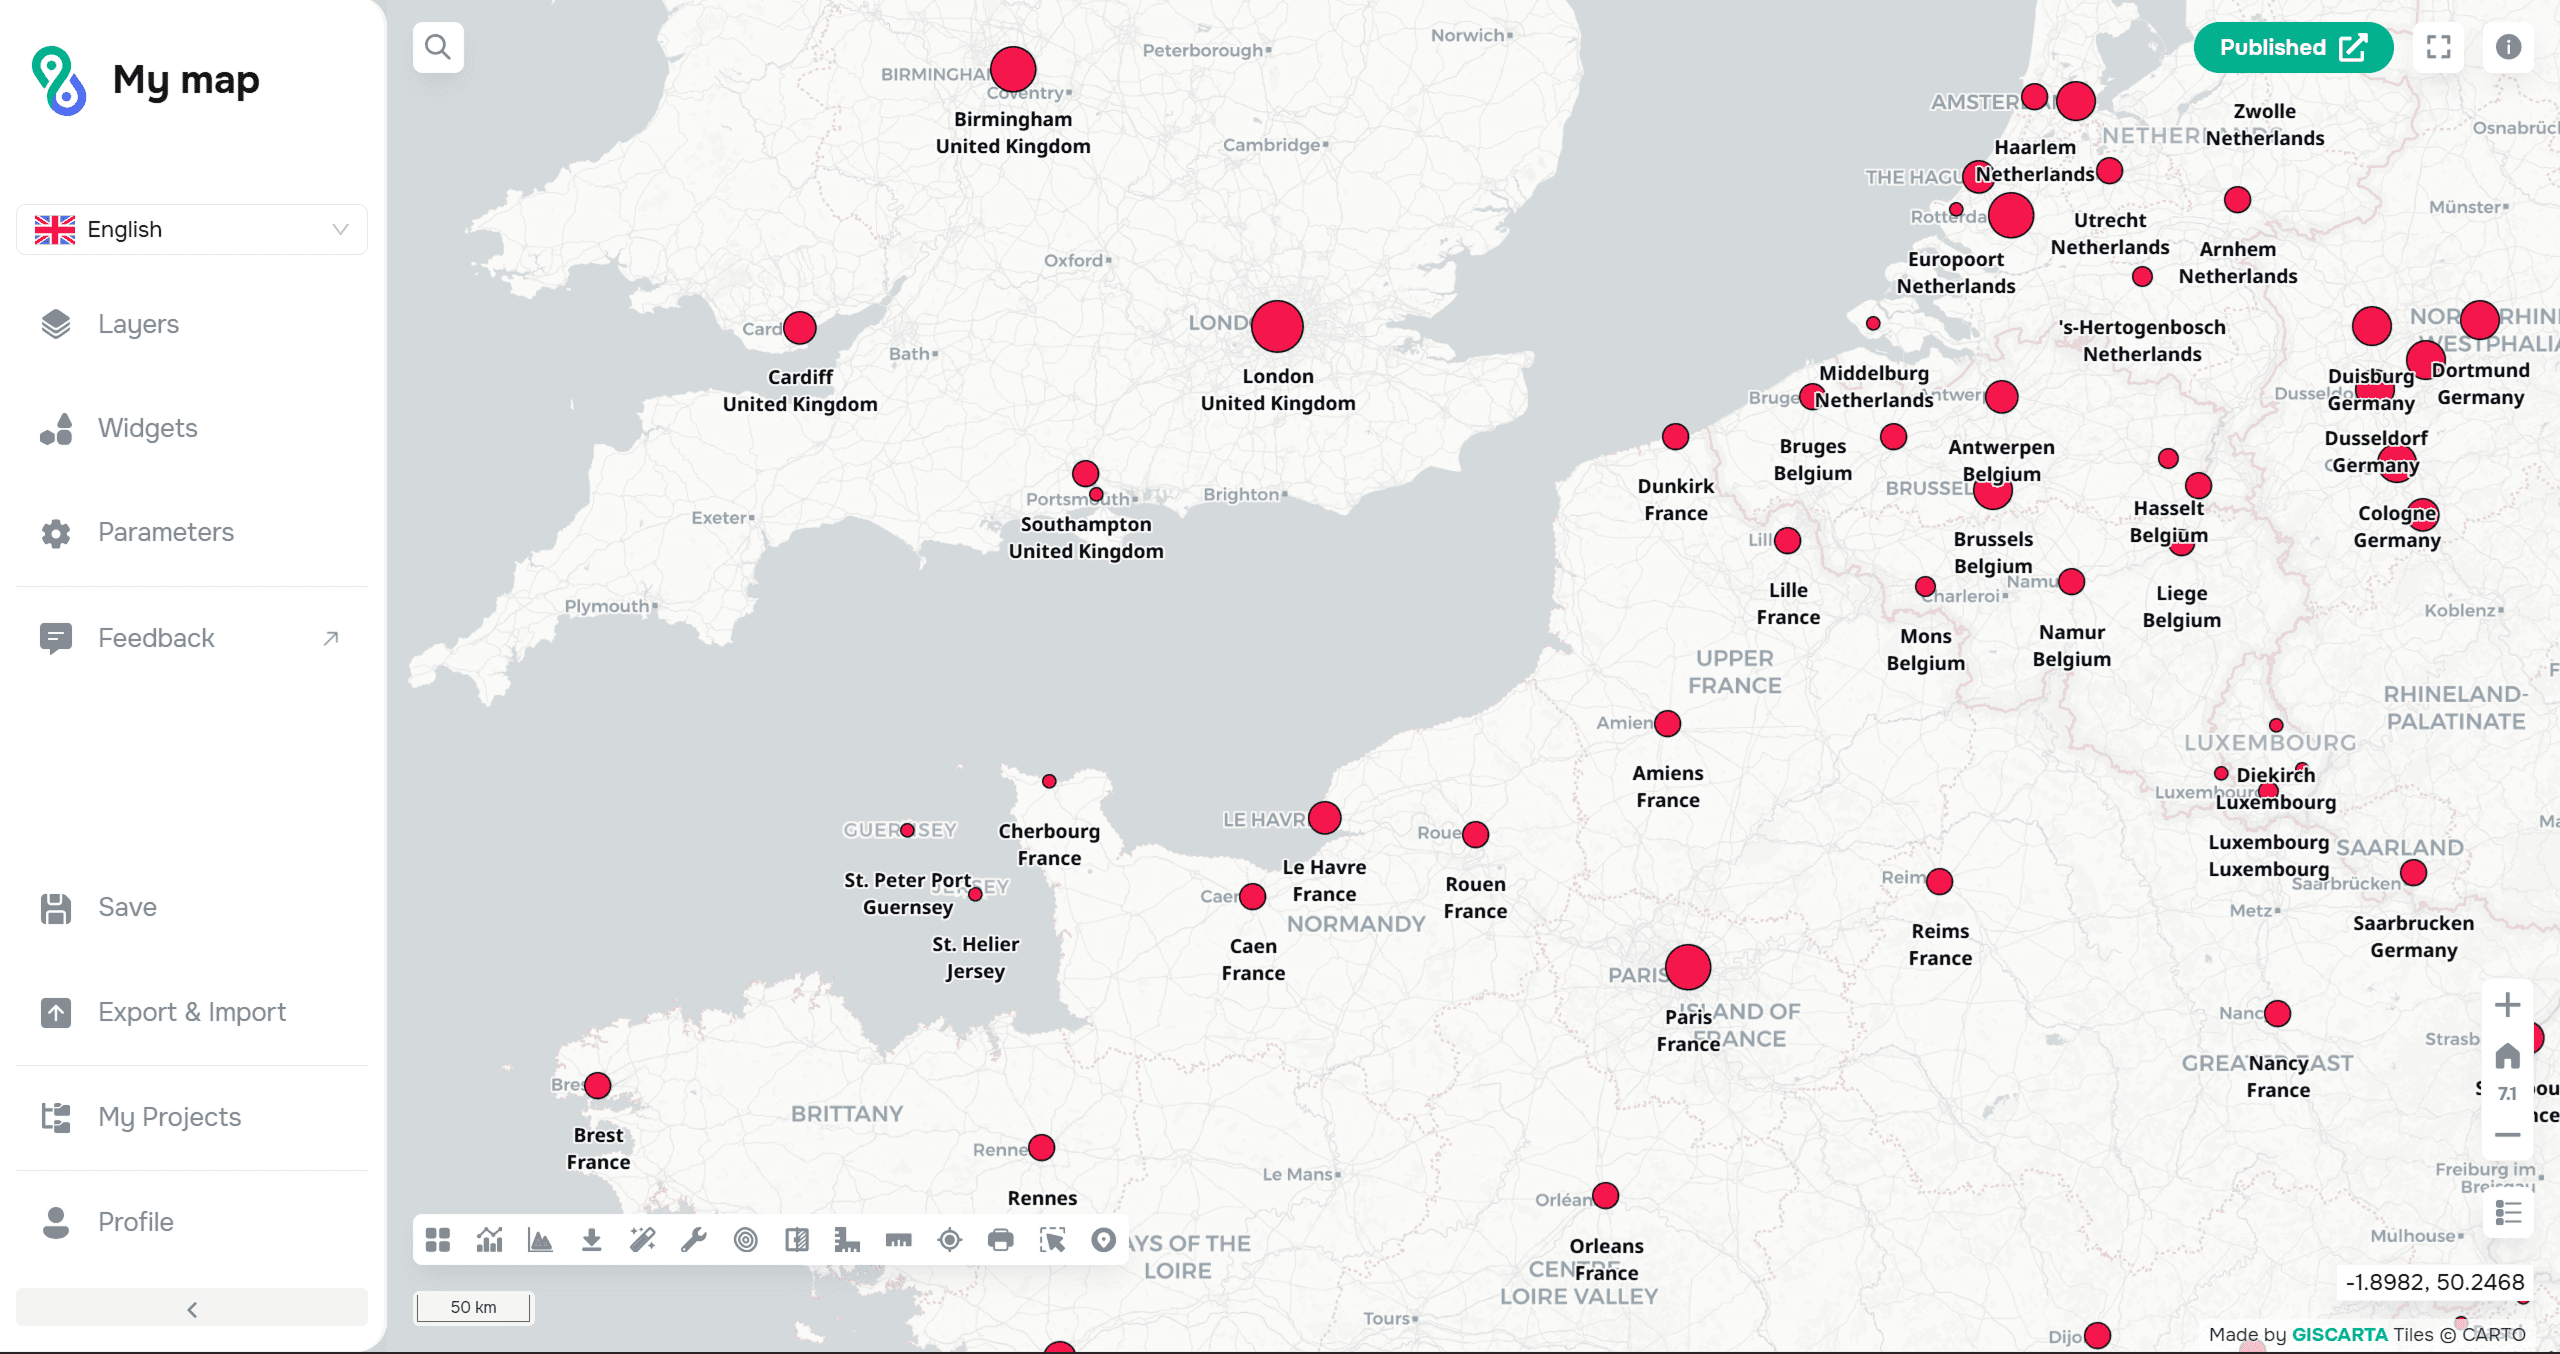
Examples of displaying captions on GISCARTA

Comparison of the display of labels with and without a halo on GISCARTA
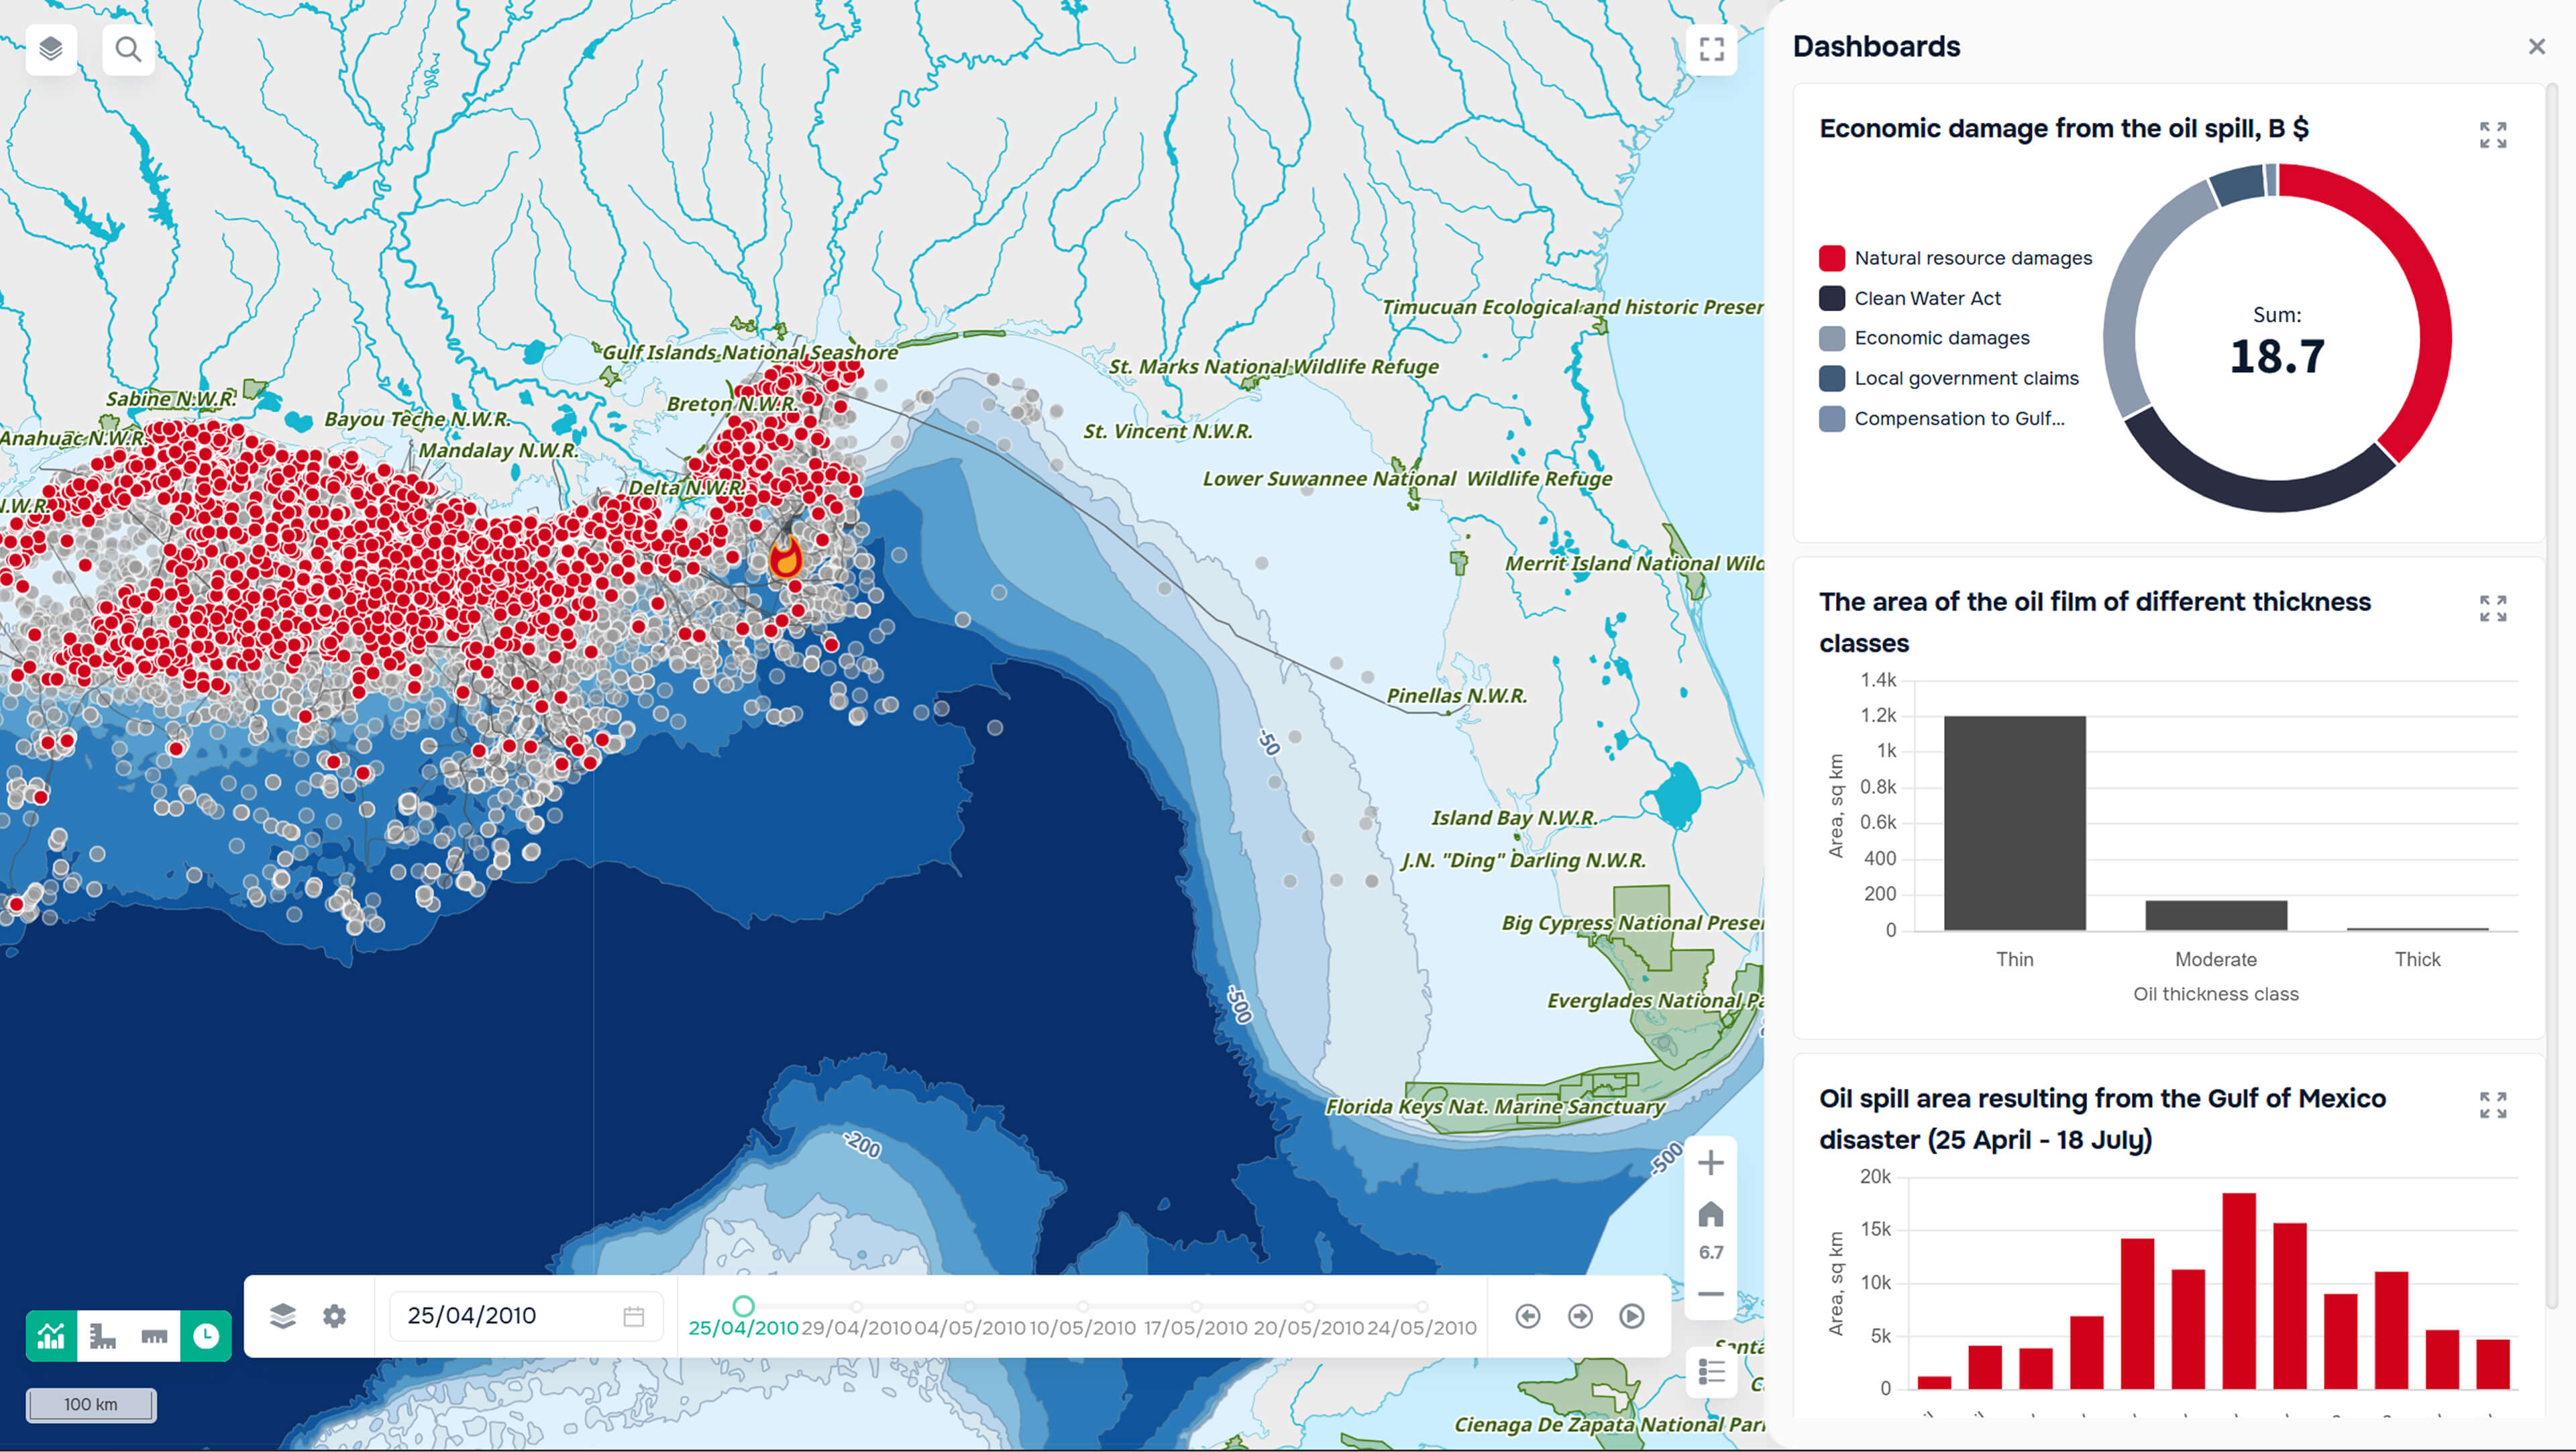
An example of displaying labels with a halo on linear objects on GISCARTA

An example of displaying labels without a halo for area objects on GISCARTA