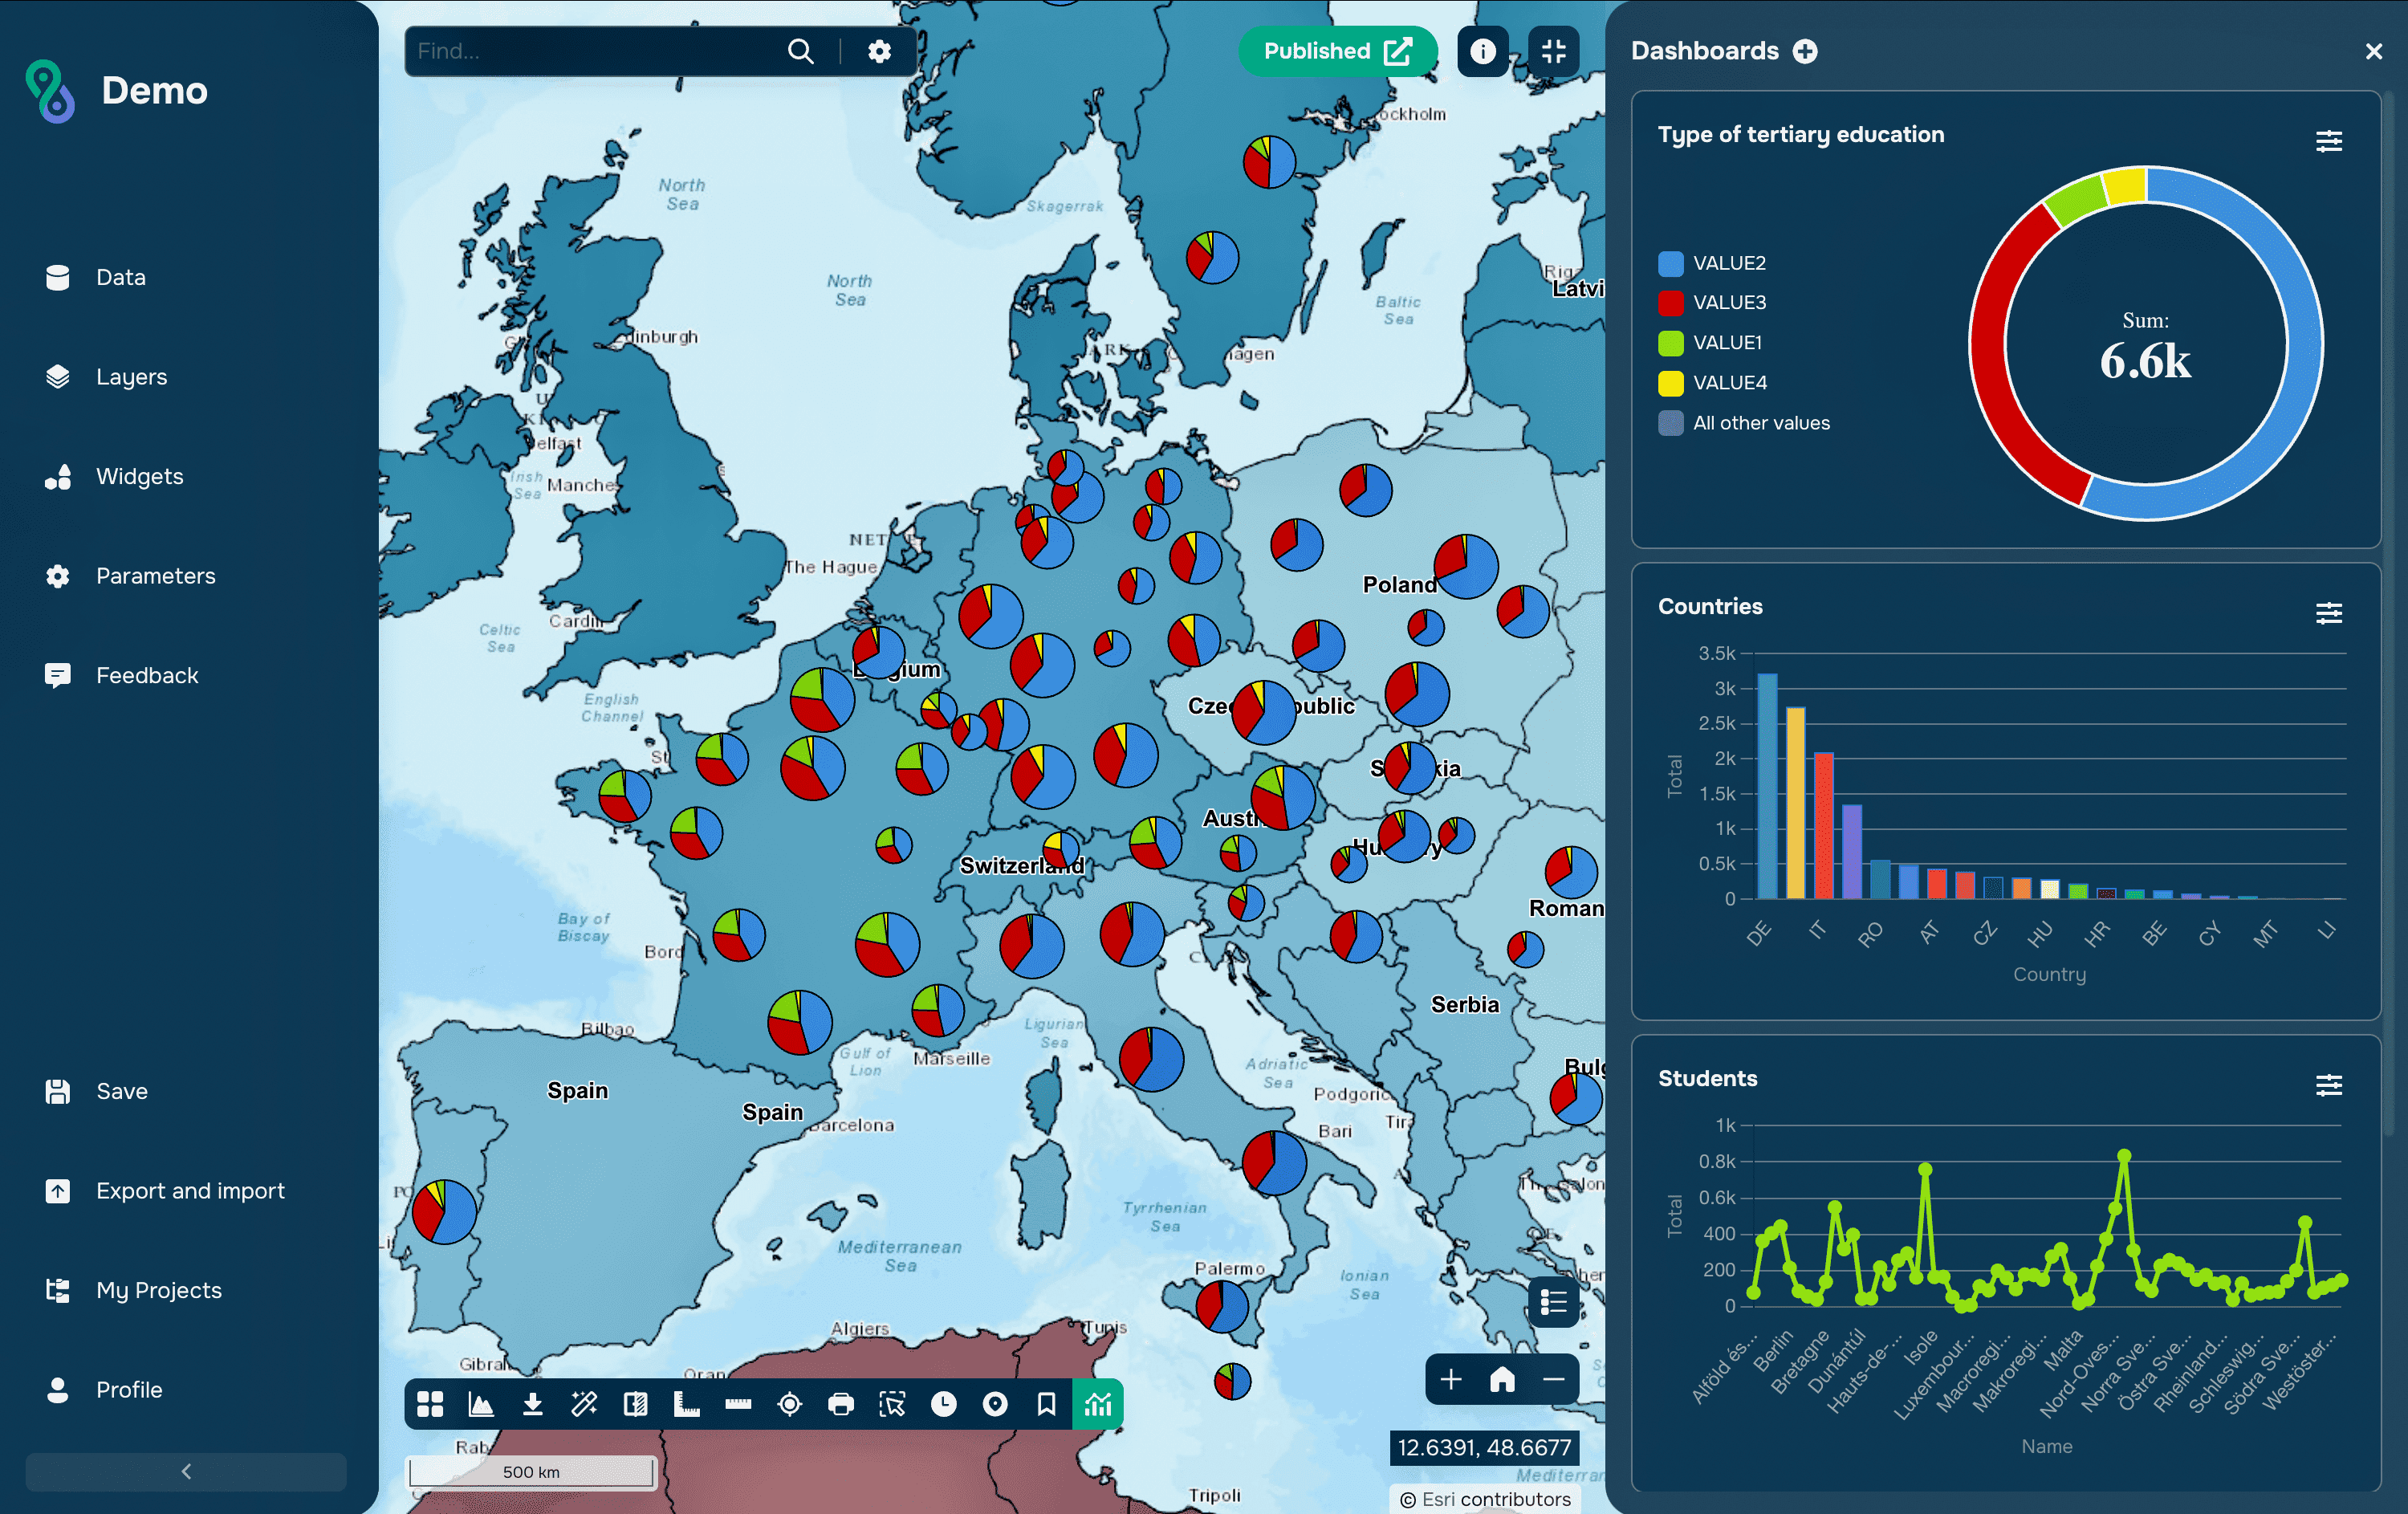
Network analysis is a set of spatial analysis methods that allows one to study the movement of objects across a network. A network can include roads, railways, pedestrian routes, utility lines, or any other interconnected objects.
Unlike measuring distance in a straight line, network analysis takes into account the actual structure of the network, traffic restrictions, road directions, travel speed, and other parameters.
This is why network analysis is widely used in transportation planning, logistics, urban management, and geomarketing.
What is network analysis used for?
Finding the optimal route
The most common example is creating a route between two or more points based on distance, travel time, or other criteria. Such algorithms are used in navigation systems and logistics services.
Transport Accessibility Analysis
Network analysis can be used to identify areas that can be reached within a certain time. For example:
areas located within a 15-minute drive of a hospital;
populated areas within the service area of a fire department;
residential neighborhoods within a 10-minute walk of a metro station.
Network Connectivity Analysis
Network analysis helps identify bottlenecks in transport infrastructure, assess the impact of road closures, and model various network development scenarios.
Main types of network analysis
The most common tasks are:
finding the shortest route;
constructing isochrones;
determining the nearest object;
analyzing service areas;
optimizing delivery routes;
constructing distance and time matrices.
Network Analysis in ArcGIS
The ArcGIS platform provides network analysis tools through the Network Analyst extension. It can be used to:
create routes between points;
calculate service areas;
create isochrones;
find nearby facilities;
solve vehicle routing problems.
To use this tool, you need a network dataset or use ArcGIS Online routing services.
The advantage of ArcGIS is its wide range of ready-to-use tools and the ability to analyze large transportation networks.
Network Analysis in QGIS
In QGIS, network analysis is available through built-in data processing tools and third-party plug-ins. The most popular are:
They can be used to create routes, create isochrones, and analyze transportation accessibility. Many tools use open-source OpenStreetMap data and routing services, making network analysis accessible even without commercial software.
Network Analysis in GISCARTA
On the GISCARTA platform, network analysis is implemented through a transport analytics widget. Users can:
create routes between objects;
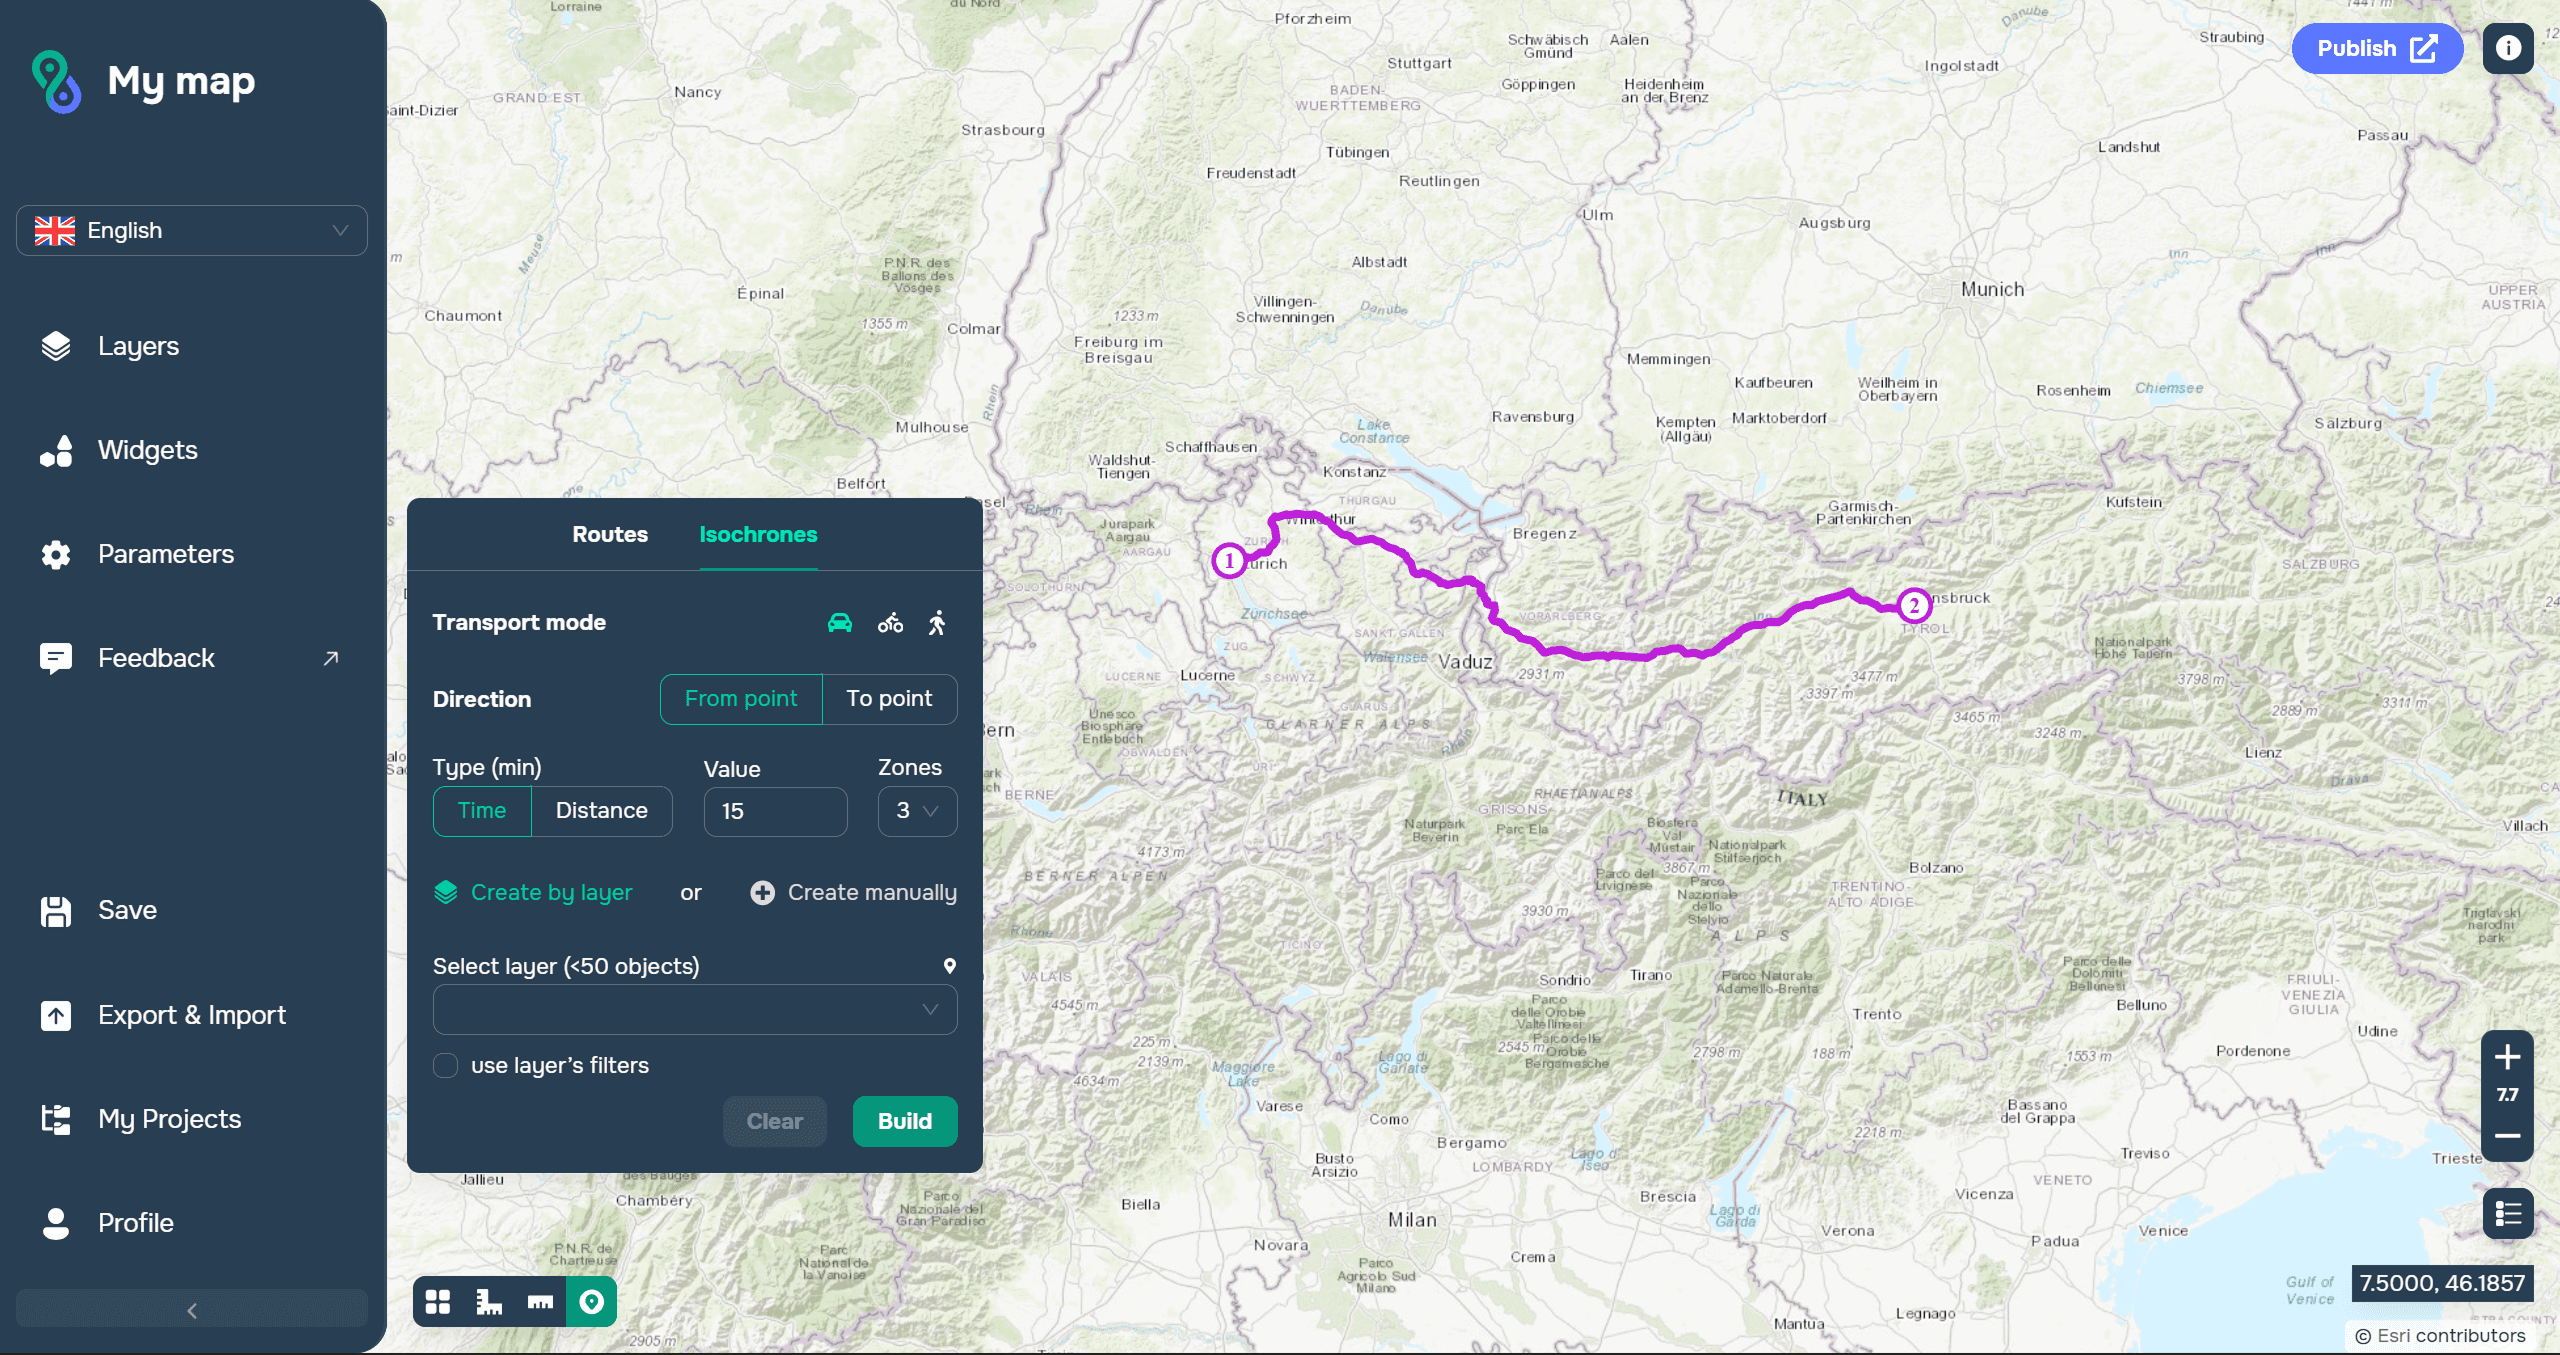
create isochrones;
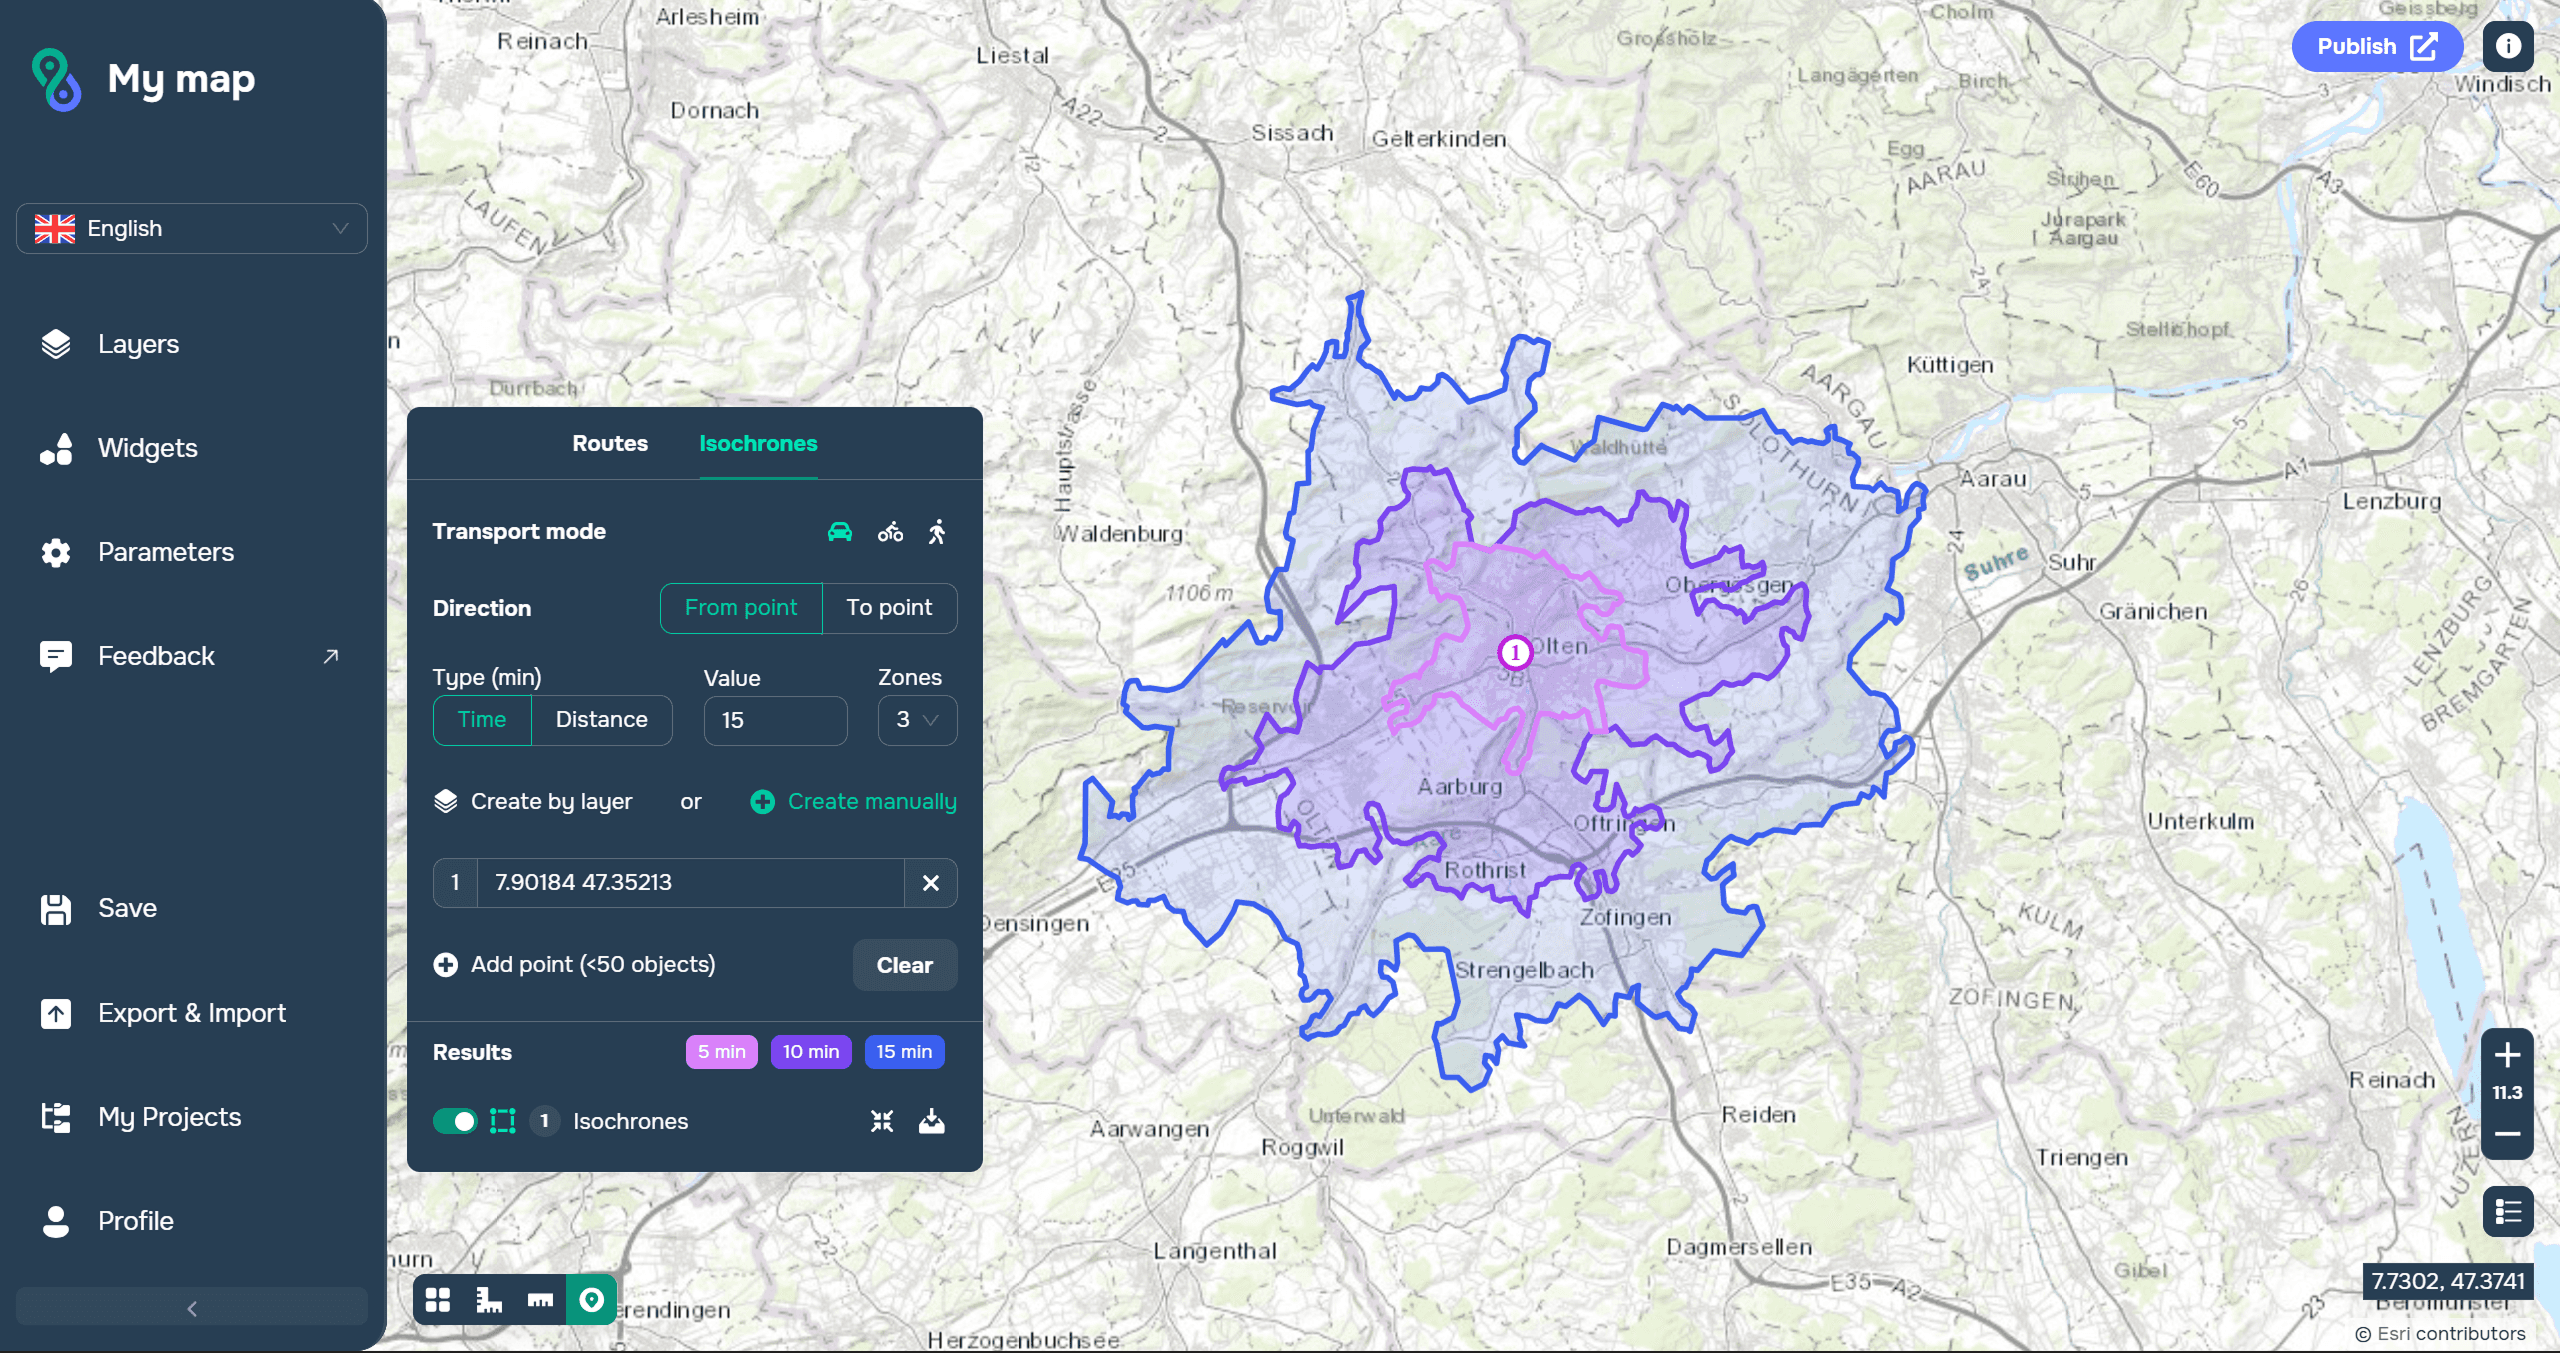
This approach allows analysis to be performed directly in the web interface without the need for desktop software.
Network analysis can be used to assess the accessibility of social facilities, select locations for new infrastructure, analyze logistics, and solve territorial planning problems.
FAQ
What is an isochrone?
An isochrone is an area that can be reached from a given point in a given time.
What data is needed for network analysis?
A network of roads or other connected objects is needed, along with information on the connections between them and, where necessary, traffic restrictions.
Where is network analysis used?
In logistics, transportation planning, geomarketing, urban management, and accessibility analysis.
Key Takeaways
Network analysis allows you to study the movement of objects across a real-world transportation network.
The most popular tasks are routing, isochrones, and service area analysis.
ArcGIS, QGIS, and GISCARTA provide tools for solving transportation accessibility and logistics problems.